1
Chronic fatigue and fibromyalgia symptoms are key components of deficit schizophrenia and are strongly associated with activated immune-inflammatory pathways.
Abbas F. Almulla a, Hussein Kadhem Al-Hakeim b, Mokhlad Swadi Abed c, Andre F. Carvalho d,e, Michael Maes f,g,h *
a Medical Laboratory Technology Department, College of Medical Technology, The Islamic University, Najaf, Iraq. E-mail: [email protected]
mail: -E University of Kufa, Iraq. Department of Chemistry, College of Science,
b
c
Ibn-Rushd Psychiatric Teaching Hospital, Baghdad, Iraq. E-mail:[email protected] d Department of Psychiatry, University of Toronto, Toronto, ON, Canada; E-mail:
e Centre for Addiction and Mental Health (CAMH), Toronto, ON, Canada
f Department of Psychiatry, Faculty of Medicine, Chulalongkorn University, Bangkok, Thailand g Department of Psychiatry, Medical University of Plovdiv, Plovdiv, Bulgaria
h IMPACT Strategic Research Centre, Deakin University, Geelong, Australia
* Corresponding Author
Prof. Dr. Michael Maes, M.D., Ph.D. Department of Psychiatry
Faculty of Medicine Chulalongkorn University
2 Bangkok
Thailand
https://scholar.google.co.th/citations?user=1wzMZ7UAAAAJ&hl=th&oi=ao
3 Abstract
4
Key words: Chronic fatigue syndrome, inflammation, neuro-immune, physio-somatic, schizophrenia, cytokines.
5 Introduction
Classically, schizophrenia is thought to be characterized by two major symptoms domains namely a) positive symptoms (including hallucinations, delusions, conceptual disorganization, aggression and hostility); and b) negative symptoms (including blunted affect, apathy, anhedonia, alogia, and social withdrawal) (Crow, 1985; Mellor, 1991; Cuesta and Peralta, 1995). Recently, we have shown that positive symptoms should be dissected into relevant symptom areas namely psychotic, hostility, excitation and mannerism (PHEM) symptoms (Maes et al., 2019a; Sirivichayakul et al., 2019a; Almulla et al., 2019). Moreover, in stable phase schizophrenia, PHEM and negative symptoms are strongly associated with psychomotor retardation (PMR) and formal thought disorders (FTD), which are other hallmarks of schizophrenia and especially of deficit schizophrenia (Maes et al., 2019a; Sirivichayakul et al., 2019a; Almulla et al., 2019). PMR is a symptom complex consisting of impairments in fine and gross motor performance, extended response latency, slowing in motor responses and movements, bradykinesia and even catatonia in more extreme cases (Almulla et al., 2019a; Maes et al., 2019a). FTD refers to a deterioration in abstract and concrete thinking with disorganized, illogical and inadequate thought processes coupled with intrusions, fluid thinking and loosened associations (Andreasen and Grove, 1986; Bachman and Cannon, 2012; Kircher et al., 2018). The strong intercorrelations between PHEM and negative symptoms, PMR and FTD are also indicated by our findings that a single latent trait may be extracted from those different symptom areas thereby reflecting overall severity of schizophrenia (OSOS) (Almulla et al., 2019).
6
cognitive impairments often comprise both subjective cognitive complaints (SCCs) and objective neurocognitive deficits including impairments in executive functions, episodic and semantic memory, spatial working memory and attention (Reichenberg 2010; Yu et al. 2015; Keefe and Harvey 2012; Seidman et al. 2003; Grillon et al. 2010; Kanchanatawan et al., 2018f; Sirivichayakul et al., 2019b). In schizophrenia, neurocognitive and affective symptoms are strongly associated with both PHEM and negative symptoms (Kanchanatawan et al., 2017; 2018f; Sirivichayakul et al., 2019b). Recently, we found that a meaningful subset of schizophrenia patients exhibit physio-somatic symptoms reminiscent of chronic fatigue syndrome (CFS) and fibromyalgia, including chronic fatigue, muscle pain, muscle tension, autonomic and a flu-like malaise (Kanchanatawan et al., 2017; 2018g). A study showed that these CFS- and fibromyalgia-like symptoms are together with anxiety disorders the most important predictors of lowered health-related quality of life (HR-Qol) in patients with schizophrenia, thereby suggesting that those symptom complexes could be more relevant than PHEM and negative symptoms in predicting HR-QoL in this population (Kanchanatawan et al., 2019). Furthermore, those burdensome physio-somatic symptoms were significantly associated with PHEM and negative symptoms (Kanchanatawan et al., 2018g).
sIL-7
2R (Maes et al., 1996; 2002; Roomruangwong et al., 2019; Noto et al., 2019; Al-Hakeim et al., 2019). Immune products of both IRS and CIRS components may have neurotoxic, cytotoxic and excitotoxic effects on brain cells thereby causing deleterious effects on neuroplasticity, synaptic sampling, synaptic and neuronal functioning, apoptosis, neurogenesis and neuroprotection (Smith and Maes, 1995; Roomruangwong et al., 2018). Most importantly, products of IRS/CIRS including IL-1β, TNF-α, and CCL-11 are strongly associated with PHEM, negative, affective and neurocognitive symptoms suggesting that their neurotoxic effects may be associated with the phenomenology of schizophrenia (Sirivichayakul et al., 2019a; 2019b; Al-Hakeim et al., 2019). Moreover, IRS activation in schizophrenia (including Th-1 and M1 macrophage) may cause stimulation of peripheral IDO (indoleamine 2,3-dioxygenase), which causes an increased catabolism of tryptophan into tryptophan catabolites (TRYCATs), some of which are neurotoxic, e.g. picolinic acid (PA), xanthurenic acid (XA), kynurenine (KYN) and quinolinic acid (QA) (Kanchanatawan et al., 2018c; 2018d). Importantly, increased levels of IgA directed to those TRYCATs (indicating TRYCAT pathway activation) in schizophrenia are significantly associated not only with PHEM, negative, affective and neurocognitive symptoms but also with physio-somatic symptoms (Kanchanatawan et al., 2017; 2018a; 2018b; 2018g), indicating that the latter may be immune-mediated. Nevertheless, to our knowledge no previous study investigated whether physio-somatic symptoms belong to the same latent vector (OSOS) which underlies the key symptom areas of schizophrenia, namely PHEM and negative symptoms, and FTD, and PMR; and whether physio-somatic symptoms are associated with increased levels of neurotoxic cytokines/chemokines.
8
increased levels of cytokines/chemokines with well-known neurotoxic activities.
Methods Participants
The current study enrolled 120 patients with deficit schizophrenia (DEFSCZ) and 54 healthy control subjects participated. Patients were recruited at the Ibn-Rushd Training Hospital for Psychiatric Medicine, Baghdad, Iraq from December 2018 to February 2019. We used the diagnostic criteria of DSM-IV-Text revised to make the diagnosis of schizophrenia, the Schedule of Deficit Schizophrenia (SDS) to make the diagnosis of DEFSCZ (Kirkpatrick et al., 1989) and the diagnostic criteria described in (Kanchanatawan et al., 2018e) to make the diagnosis of Major Neurocognitive Psychosis (MNP), which are more restrictive than the SDS criteria. However, in the present study all patients with DEFSCZ also met the MNP criteria. Controls were recruited by word of mouth including family, friends or acquaintances of staff members and both controls and patients were recruited from the same catchment area in Baghdad city, Iraq.
9
in the same stable condition. Participants who had a lifetime history of other axis-I disorders including bipolar disorder, schizoaffective disorder, psycho-organic disorders, primary major depression, OCD and substance use disorders (except nicotine use) were also excluded. Finally, controls with any axis-I disorder and those who with a positive family history for schizophrenia were excluded.
All participants as well as the guardians of patients (first degree family members) provided written informed consent prior to participation in the current study. The study was carried out in accordance to the Iraq and international ethics and privacy laws. Approval for the study was obtained from the Institutional Review Board of the University of Kufa (347/2019), which is in compliance with the International Guidelines for Human Research protection as required by the Declaration of Helsinki, The Belmont Report, Council for International Organizations of Medical Sciences (CIOMS) Guideline and International Conference on Harmonization in Good Clinical Practice (ICH-GCP).
Measurements
Clinical assessments
10
(Overall & Gorham 1962), the Positive and Negative Syndrome Scale (PANSS) (Kay et al., 1987), and the Hamilton Depression and Anxiety Rating Scales (HAM-D and HAM-A) (Hamilton, 1959; 1960) were also completed by the same research psychiatrist. The drug state of the patients was also recorded as some patients were taking risperidone (n=109), olanzapine (n=11), or fluphenazine (n=68). On the same day, a well-trained research psychologist, blinded to the clinical assessments and diagnosis, performed neuropsychological tests using the Brief Assessment of Cognition in Schizophrenia (BACS) (Keefe et al., 2004). In brief, the BACS comprises different tests, namely List Learning, which assesses verbal episodic memory; Digit Sequencing Task, which assesses working memory; Category Instances, which probes semantic and verbal fluency; Control Oral Word Association, which probes letter and verbal fluency; Symbol Coding, which assesses attention; and the Tower of London, which assesses executive functions and problem solving. The same psychologist also assessed the Mini-Mental State Examination (MMSE). The diagnosis of Tobacco Use Disorder (TUD) was made using the DSM-IV Text Revision. Body mass index (BMI) was computed as body weight (kg) / length (m2).
Based on our previous publications (Almulla et al., 2019; Maes et al., 2019a), we computed z-unit weighted composite scores based on BPRS, HDRS, PANSS and SANS items denoting PHEM, FTD, and PMR while severity of negative symptoms was assessed using total scores on the SANS and PANSS negative subscale score.
Assays
11
conducted. Serum CRP was measured using a kit supplied by Spinreact®, Spain. The test is based on the principle of the latex agglutination. Commercial ELISA sandwich kits were used to measure serum CCL-11, MCP-1, IL-1β, sIL-1RA, sTNFR1, sTNFR2, and TNF-α (Elabscience, Inc. CA, USA). For samples with highly concentrated biomarkers, we used sample dilution as required. The intra-assay coefficients of variation (CV) (precision within-assay) were < 7.0%.
Statistical analysis
12
differences among the classical and bootstrapped approaches were observed. We transformed biomarkers to normalize the distribution as assessed using the Kolmogorov-Smirnov test; sIL-1RA and CCL11 were processed in square root transformation while IL-1β, TNF-α, sTNFR1, sTNFR2 and MCP-1 were processed in Ln transformation. Tests were 2-tailed and a p-value of <0.05 was considered for statistical significance. All statistical analyses were performed using IBM SPSS windows version 25, 2017. As machine learning techniques we used Neural Networks (NN) (SPSS version 25), Soft Independent Modeling of Class Analogy or Statistical Isolinear Multiple Component Analysis (SIMCA) (the Unscrambler, CAMO) and Partial Least Squares (PLS) path analysis (SmartPLS, 2019). We have previously described the use of those techniques elsewhere (Almulla et al., 2019).
Results
Socio-demographic and clinical data
Table 1 shows demographic data of patients and controls who took part in the current study.
13
Table 1 shows the measurements of the different cognitive tests. These data were analysed using univariate GLM analysis with age, sex, and education as covariates. All scores on the neurocognitive tests were significantly lower in both patient groups compared to controls, while there were no significant differences among both DEFSCZ subgroups (i.e. those with high versus low FF scores). Table 1 shows the measurements of the biomarkers which were analysed using univariate GLM analysis with age, sex, BMI, education and TUD as covariates. Levels of all biomarkers were significantly higher in both schizophrenia groups as compared to controls, whilst there were no significant differences in the levels of those biomarkers between both patient subgroups.
Differences in FF scores between DEFSCZ and controls
Multivariate GLM analysis (with age, sex and education as covariates) showed that there was a highly significant association (F=106.31, df=12/157, p<0.001) between the 12 FF items and the diagnosis DEFSCZ with an effect size of 0.890. All FF items were significantly higher in DEFSCZ as compared with controls (all p<0.001 after p-correction for FDR). There were no significant effects of sex (F=0.23, df=12/157, p=0.996), age (F=1.58, df=12/157, p=0.103) and education (F=0.88, df=12/157, p=0.570) on the FF items’ scores. Moreover, there were no significant effects of risperidone (F=0.99, df=12/157, p<0.001), olanzapine (F=1.00, df=12/157, p=0.456), and fluphenazine (F=1.03, df=12/157, p=0.426) on the 12 FF items (results of multivariate GLM analysis).
14
and DEFSCZ patients. PCA showed that there were no outliers either in the control group or in the patient group. The control group was modelled employing 2 PCs, while the DEFSCZ group was modelled with 7 PCs. All 12 items displayed significant modelling power in both controls and patients (all > 0.4384). Figure 1 shows the discrimination plot with the discriminatory power of the 12 FF items. The top-5 items with the highest discriminatory power were in descending order: sadness, concentration disorders, fatigue, a flu-like malaise and sleep disorders. The intra-class distance was 738. The classification table shows that all controls and all DEFSCZ patients were authenticated as belonging to their target class while there were no aliens, namely controls or DEFSCZ patients intruding into the critical limits of the alternative class. As such the accuracy of the 12 FF items for DEFSCZ and the control group is 100%, with a 100% sensitivity and 100% specificity for DEFSCZ.
Factor and PC analysis.
Figure 2 shows a PC plot obtained by PCA performed on the 12 FF items. This plot shows
the distribution of patients (red dots) and control subjects (blue squares) along PC1 and PC2. The first PC explained 71% of the variance and the second PC 5% of the variance in the 12 FF items. DEFSCZ patients are clearly separated from controls with a very large boundary between both groups showing that there is no overlap between both classes. Figure 3 shows the correlation loading plot of the 12 FF items on the same PCs. All FF items are located between the outer and inner ellipses and group together indicating that all 12 FF items contribute significantly to the discrimination of patients and controls especially along PC1.
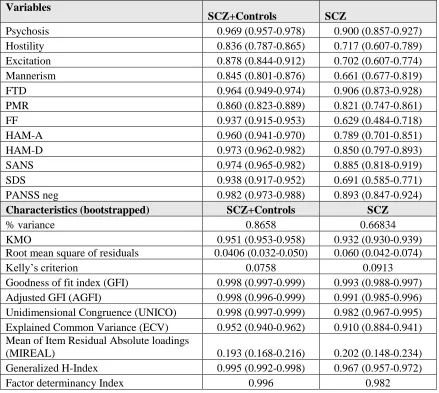
Table 2 displays the results of two explanatory factor analysis (EFAs) performed on all
15
study group (controls + patients) and a second in patients only. The EFA performed on the DEFSCZ group (right column) shows a good Kaiser-Meyer-Olkin Test (KMO), that measures sampling adequacy for each variable in the model and for the complete model, and a significant Bartlett's test for homogeneity of variances (ꭓ2=1346, df=666, p<0.00001) indicating that the correlation matrix has adequate factorability. In addition, we found that only one eigenvalue was greater than 1 (namely 8.02004). Three different tests, i.e. Parallel Analysis, Hull test and BIC test, showed that one factor fits the data. Moreover, the UNICO, ECV and MIREAL values show that the 12 FF items set should be treated as unidimensional. Table 2 shows that all symptom domains loaded highly on the first factor. FF items showed the lowest loading which, however, was still sufficient to be included in the model. GFI and AGFI showed a good fit of the model, while the high FDI values indicate a good quality of the factor scores estimates. The high values obtained for the H index show a good performance across studies as well as good construct replicability. Table 2 (left column) shows the results of a similar EFA but now performed in patients and controls combined. Overall the results are quite similar as those in DEFSCZ patients only, but most tests showed even better model quality data and also the loadings on the first factor (including the FF score) were higher. The results show again that there is one factor which is essentially unidimensional.
Associations of the FF score with other symptom domains and cognitive test results.
Table 3 shows the partial correlation coefficients (adjusted for age, sex and education)
16
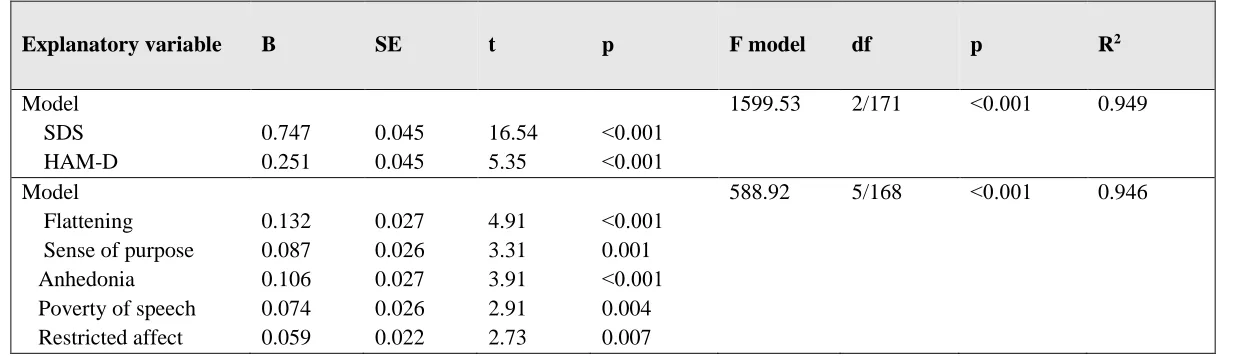
after FDR p correction). The partial correlation coefficients in the combined study group were higher than in DEFSCZ patients and all were significant at p<0.0001 (after p correction for FDR). Table 4 shows the results of stepwise multiple regression analysis, whereby the total FF
score was entered as the dependent variable and the other symptom domains as well as age, sex and education as explanatory variables. In the total study group, 94.9% of the variance in the FF score was predicted by SDS and HAM-D scores combined. Consequently, we have examined which negative items of the SDS were significantly associated with the SDS score. Multiple regression showed that flattening, anhedonia, poverty of speech, restricted affect and diminished sense of purpose explained 94.6% of the variance in the total FF score.
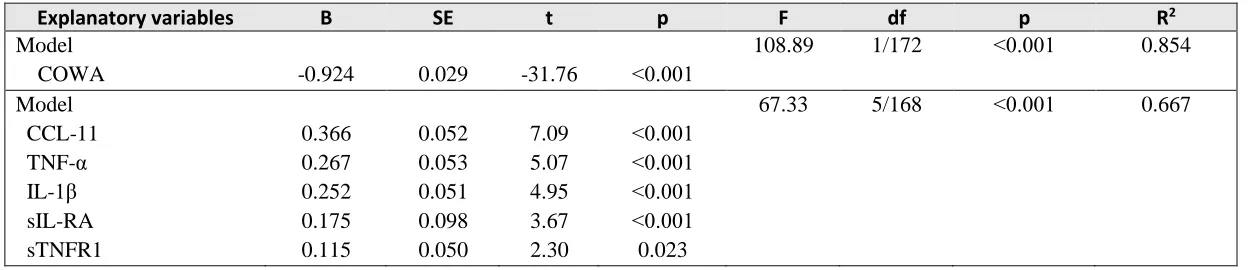
Partial correlations (adjusted for age, sex and education) showed that in the total study sample there were significant associations (all at p<0.001 after p-correction for FDR, all n=169) between the total FF score and test scores on MMSE (r=-0.674), List learning (r=-0.726), digit sequencing task 0.724), category instances 0.568), controlled oral word association (r=-0.874), symbol coding (r=-0.786) and Tower of London (r=-0.698). Table 5 shows the results of a stepwise multiple regression analysis whereby 85.4% of the variance in the FF score was associated by the scores on a single test, namely controlled oral word association. Nevertheless, no significant associations could be detected between the FF score and any of the cognitive probes in the restricted DEFSCZ group.
Associations the FF score and biomarkers.
17
(r=0.452), sTNFR1 (r=0.319), sTNFR2 (r=0.307), MCP-1 (r=0.287) and CCL-11 (r=0.548). Table 5 shows the results of a stepwise multiple regression analysis whereby 66.7% of the variance in
the FF score was predicted by the combination of CCL-11, TNF-α, IL-1β, sIL-1RA and sTNFR1. Figure 4 shows the partial correlation between the total FF score and CCL-11 in the total study
group. No significant correlations were found in the restricted DEFSCZ group between the FF score and any of the biomarkers.
Using PLS path analysis (Figure 5) (complete and consistent bootstrapping with 5000 bootstrap samples) we examined the significant biomarker predictors (input variables) of the 12 FF items (output variables). We obtained a very good model fit with SRMR = 0.044 (95% CI: 0.044-0.049). The latent construct FF (overall severity of FF) showed excellent quality criteria including Cronbach alpha (0.963 ±0.004), rho_A (0.965 ±0.004), composite reliability (0.963 ±0.004) and AVE (0.6853 ±0.025) and all loadings on this were significant at p<0.0001 and higher than 0.675. Also, the discriminant validity was more than adequate as established with the Fornell-Larcker criterion, cross-loadings and the HTMT ratio. Figure 5 shows that 66.8% of the variance in the FF LV was explained by sIL-1RA, IL-1β, TNF-α and CCL-11.
18
0.470. About 59.4% of the variance in the OSOS LV was explained by sIL-1RA, IL-1β, TNF-α and CCL-11.
In order to examine the combined effects of the symptom domains, biomarkers and cognition on the FF score in subjects with DEFSCZ we used a Neural Network. The latter machine learning method entered the FF score as output variable and 7 biomarkers, cognitive test results (entered as the first PC extracted from the 7 cognitive tests and explaining 84.31% of the variance) and 12 symptom domains as input variables. The model was trained with 2 hidden layers with each 2 units whereby the first layer was trained using hyperbolic tangent as activation function while the output layer used identity as activation factor. During the training, the error term (sum of squares) was minimized from 15.672 to 10.344 which shows that the NN model learnt to generalize from the trend. Moreover, the relative error terms were fairly constant in the training (0.514), testing (0.597) and holdout (0.525) samples indicating that the model is not overfitted. The correlation between the model-predicted FF value and the FF score was r=0.681 (p<0.001). Figure 7 displays the relevance chart showing the (normalized) importance of all input variables. The SDS
score was the most important determinant of the predictive model, followed at a distance by HAM-A, psychosis, SANS and sIL-1RHAM-A, and again at a distance by sTNFR1, PMR and CCL-11.
Discussion
19
that patients with deficit schizophrenia show increased scores on the FF scale compared to controls (Kanchanatawan et al., 2017). Therefore, it appears that deficit patients show symptoms such as changes in pain perception and hyperalgesia which are similar in magnitude to those observed in fibromyalgia (Zachrisson et al., 2002). Previously, we have shown that SCCs in schizophrenia are associated with objective neurocognitive test scores as measured with CERAD (Sirivichayakul et al., 2019b). Patients with schizophrenia repeatedly complain from fatigue (Skapinakis et al., 2000) while a meaningful subset of those patients show higher fatigue scores (Hedlund et al., 2015). Furthermore, many schizophrenia patients exhibit reduced energy levels and sleep disturbances (Palmese et al. 2011; Hedlund et al 2015) as well as gastro-intestinal symptoms (Chen 2016). Moreover, in the present study we found that the total FF score was significantly associated with all other symptom domains. These results corroborate those of a previous paper reporting that FF symptom are not only associated with affective symptoms, but also with PHEM and negative symptoms (Kanchanatawan et al., 2018g).
20
(2018g) found in a combined group of deficit and non-deficit schizophrenia patients and controls that PHEM and negative symptoms belong to one factor while HAM-D, HAM-A and FF data belong to another factor (although both components are strongly inter-related). These differences may be explained by differences in selection and exclusion criteria of both studies. Thus, Kanchanatawan et al. (2018g) excluded subjects with current major depression, while the current study did not a priori exclude patients with secondary major depression.
The third major finding of this study is that, using the 12 FF symptoms as discriminatory variables, deficit schizophrenia is modelled and discriminated from controls with a 100% accuracy indicating that this condition is a qualitatively distinct entity with regard to physio-somatic symptoms. At first sight those findings on qualitative or categorical differences are difficult to reconcile with our findings that FF symptoms belong to the same OSOS latent vector, which increases all over a continuum. Therefore, it is possible that the frequency of FF symptoms increases with severity of negative and PHEM symptoms to shape and model deficit schizophrenia as a distinct nosological entity. However, it is important to stress that physio-somatic symptoms are not only a key component of deficit schizophrenia (this study) but also of non-deficit schizophrenia (Kanchanatawan et al., 2017).
21
noted that CFS is associated with neurocognitive impairments including in concentration, memory, working memory, thought processes, and information processing speed (Jason et al., 2002; Deluca et al., 2004; Lange et al 2005). Cook et al. (2007) reported a significant relationship between mental fatigue and brain activity during a fatiguing cognitive task. Patients with CFS show moderate to more profound impairments in straightforward and complex information processing speed and in assignments requiring working memory over a supported timeframe (Cockshell et al., 2010). CFS is also accompanied by a working memory deficit suggesting that executive functions are impaired and may mediate fatigue (Dobbs et al., 2001).
22
elevation in pro-inflammatory cytokine/chemokine levels in CFS patients as compared to controls and, additionally, that these biomarkers were associated with the severity of CFS. Roerink et al. (2017) found that MCP-1 and CCL-11 were among the chemokines that were associated with CFS. Moreover, in the current study we found that, using neural networks, the total FF score was highly predicted by a combination of schizophrenia symptoms (especially negative, affective and psychotic symptoms), biomarkers (especially increased IL-1, TNF-α and CCL-11 signalling) and to a lesser degree also by cognitive deficits. Our results indicate that schizophrenia patients are primed to develop FF symptoms in part via activated immune-inflammatory pathways.
The results of our study should be interpreted in the light of its limitations. First, this is a case-control study and therefore no causal inferences can be firmly drawn. Further research should examine when FF symptoms appear during the course of illness. Second, this study was performed in patients in a stable phase of schizophrenia and, consequently, our results cannot be generalized to the acute phase of illness. Further research should examine the correlations among FF and other symptoms of schizophrenia during an acute psychotic episode. Third, it would have been even more interesting if we had measured other biomarkers of deficit schizophrenia including lowered natural IgM and indices of the breakdown of gut and blood brain paracellular and vascular pathways (Maes et al., 2019a; 2019b).
23
symptoms as being a core component of schizophrenia. Second, our findings indicate that FF symptoms should be part of rating scales constructed to measure HR-QoL and overall severity of schizophrenia. In addition, our results show that such rating scales should be constructed as reflective scales and not as composite scales as most scale are constructed. For example, the BPRS did not take into account FF symptoms and is a composite scale. Also the PANSS is constructed as a composite scale while the SANS and SDS only measure negative symptoms and therefore do only partly reflect OSOS. Finally, our results have also some implications for CFS because it appears that a syndrome comprising CFS symptoms may appear during schizophrenia. Nevertheless, our results do not show that schizophrenia patients suffer from the clinical syndrome CFS as one of the exclusion criteria of most case definitions is secondary CFS due to schizophrenia. Previously, we have shown that CFS may appear during the acute phase of major depression, another neuro-immune disorder, and that this comorbidity is accompanied by greater neuro-immune aberrations (Maes et al., 2012). These findings further corroborate that CFS-like syndromes are neuro-immune conditions be it as secondary syndromes in neuro-immune disorders (major depression and schizophrenia) or as Myalgic Encephalomyelitis (ME/CFS) (Maes and Twisk, 2010; Morris and Maes, 2012). Future research should examine whether the CFS symptom cluster in schizophrenia, CFS in major depression and ME/CFS have a common immune etiology including breakdown of the gut paracellular tight junctions, for example (Maes et al., 2007; 2019b; Slyepchenko et al., 2017).
Acknowledgements
24 Funding
There was no specific funding for this specific study.
Conflict of interest
The authors have no conflict of interest with any commercial or other association in connection with the submitted article.
Author’s contributions
25 References
Al-Hakeim, HK., Al-Fadhel, SZ., Al-Dujaili, AH., Carvalho, A., Sriswasdi, S., Maes, M., 2019b. Development of a Novel Neuro-immune and Opioid-Associated Fingerprint with a Cross-Validated Ability to Identify and Authenticate Unknown Patients with Major Depression: Far Beyond Differentiation, Discrimination, and Classification. Mol. Neurobiol. doi: 10.1007/s12035-019-01647-0.
Al-Hakeim, HK., Almulla, AF., Maes, M., 2019a. The Immune Fingerprint of Major Neuro-Cognitive Psychosis or Deficit Schizophrenia: A Supervised Machine Learning Study. Preprints, 2019050285 (doi: 10.20944/preprints201905.0285.v1).
Almulla, AF., Al-Hakeim, HK., Maes, M., 2019a. Schizophrenia phenomenology revisited: positive and negative symptoms are strongly related reflective manifestations of an underlying single trait indicating overall severity of schizophrenia. Preprint. 10.13140/RG.2.2.11798.80967.
Anderson, G., Maes, M., Berk, M., 2013. Schizophrenia is primed for an increased expression of depression through activation of immuno-inflammatory, oxidative and nitrosative stress, and tryptophan catabolite pathways. Prog. Neuro-Psychopharmacology Biol. Psychiatry. 42,101-141.
Andreasen NC, Grove WM. 1986. Thought, language, and communication in schizophrenia: diagnosis and prognosis. Schizophr. Bull. 12(3),348–359.
26
theoretical foundations. Brit. J. Psychiatry Suppl. 7,49-58.
Bachman, P., Cannon, TD., 2012. The cognitive neuroscience of thought disorder in schizophrenia. The Oxford handbook of thinking and reasoning. Oxford University Press, New York.
Benjamini, Y., Hochberg, Y., 1995. Controlling the false discovery rate: a practical and powerful approach to multiple testing. J. Royal Statistics Soc. Series b (Methodological) 57(1),289-300.
Bobes, J., Garcia-Portilla, MP., Bascaran, MT., Saiz, PA., Bousoño, M., 2007. Quality of life in schizophrenic patients. Dialogues Clin. Neurosci. 9(2), 215-226.
Burton, N., 2012. Living with Schizophrenia. 2nd Edition, Acheron Press.
Caseras, X., Mataix-Cols, D., Giampietro, V., Rimes, KA., Brammer, M., Zelaya, F., Chalder, T., Godfrey, EL., 2006. Probing the working memory system in chronic fatigue syndrome: a functional magnetic resonance imaging study using the n-back task. Psychosom Med. 68(6),947-955.
Chen, J., 2016. Comorbidity Investigations of Gastrointestinal Disorders with Mental Disorders in Patients or Animals. J. Depress. Anxiety. 6(1), 256-260.
27
Cockshell, SJ., Mathias, JL., 2010. Cognitive functioning in chronic fatigue syndrome: a meta-analysis. Psychol. Med. 40(8),1253-1267.
Cook, DB., O'Connor, PJ., Lange, G., Steffener, J., 2007. Functional neuroimaging correlates of mental fatigue induced by cognition among chronic fatigue syndrome patients and controls. Neuroimage. 36(1),108-122.
Corlett, PR., Honey, GD., Fletcher, PC., 2007. From prediction error to psychosis: ketamine as a pharmacological model of delusions. J. Psychopharmacol. 21(3),238-252.
Crow, TJ., 1985. The two-syndrome concept: origins and current status. Schizophr Bull. 11(3),471-86.
Cuesta, MJ., Peralta, V., 1995. Cognitive disorders in the positive, negative, and disorganization syndromes of schizophrenia. Psychiatry Res. 58(3),227-235.
Deluca, J., Christodoulou, C., Diamond, BJ., Rosenstein, ED., Kramer, N., Natelson, BH., 2004. Working memory deficits in chronic fatigue syndrome: differentiating between speed and accuracy of information processing. J. Int. Neuropsychol. Soc. 10(1),101-109.
28
Dobbs, BM., Dobbs, AR., Kiss, I., 2001. Working memory deficits associated with chronic fatigue syndrome. J. Int. Neuropsychol. Soc. 7(3),285-93.
Emsley, RA., Oosthuizen, PP., Joubert, AF., Roberts, MC., Stein, DJ., 1999. Depressive and anxiety symptoms in patients with schizophrenia and schizophreniform disorder. J. Clin. Psychiatry 60(11),747-751.
Galuppi, A., Turola, M., Nanni, MG., Grassi, L., 2010. Schizophrenia and quality of life: how important are symptoms and functioning?. Int. J. Mental Health Systems 4(31),1-8.
Górna, K., Jaracz, K., Jaracz, J., Kiejda, J., Grabowska-Fudala, B., Rybakowski, J., 2014. Social functioning and quality of life in schizophrenia patients -relationship with symptomatic remission and duration of illness. Psychiatry Pol. 48(2),277-288.
Grillon, ML., Krebs, MO., Gourevitch, R., Giersch, A., Huron, C., 2010. Episodic memory and impairment of an early encoding process in schizophrenia. Neuropsychology. 24(1),101–108.
Hamilton, M., 1959. The assessment of anxiety states by rating. Br. J. Med. Psychol.
Hamilton, M., 1960. A rating scale for depression. J. Neurol. Neurosurg. Psychiatry 23,56-62.
29
deficits: what is the nature of their relationship? Schizophr. Bull. 32,250-258.
Hedlund, L., Gyllensten, AL., Hansson, L., 2015. A psychometric study of the multidimensional fatigue inventory to assess fatigue in patients with schizophrenia spectrum disorders. Community Ment. Health J. 51(3),377-382.
Hoftman, GD., Dienel, SJ., Bazmi, HH., Zhang, Y., Chen, K., Lewis, DA., 2018. Altered Gradients of Glutamate and Gamma-Aminobutyric Acid Transcripts in the Cortical Visuospatial Working Memory Network in Schizophrenia. Biol. Psychiatry 83(8),670-679.
Jason, LA., Taylor, RR., Kennedy, CL., Jordan, K., Huang, CF., Torres-Harding, S., Song, S., Johnson, D., 2002. A factor analysis of chronic fatigue symptoms in a community-based sample. Soc Psychiatry Psychiatr Epidemiol. 37(4),183-9.
Kanchanatawan, B., Hemrungrojn, S., Thika, S., Sirivichayakul, S., Ruxrungtham, K., Carvalho, AF., Geffard, M., Anderson, G., Maes, M., 2017a. Changes in Tryptophan Catabolite (TRYCAT) Pathway Patterning Are Associated with Mild Impairments in Declarative Memory in Schizophrenia and Deficits in Semantic and Episodic Memory Coupled with Increased False-Memory Creation in Deficit Schizophrenia. Mol. Neurobiol. doi: 10.1007/s12035-017-0751-8.
Neuro-30 Psychopharmacol. Biol. Psychiatry. 80(Pt C), 205-216.
Kanchanatawan, B., Sirivichayakul, S., Ruxrungtham, K., Carvalho, AF., Geffard, M., Ormstad, H., Anderson, G., Maes, M., 2017. Deficit, but not nondeficit, schizophrenia is characterized by mucosa-associated activation of the tryptophan catabolite (TRYCAT) pathway with highly specific increases in IgA responses directed to picolinic, xanthurenic, and quinolinic acid. Mol Neurobiol. 55(2),1524-1536.
Kanchanatawan, B., Sriswasdi, S., Thika, S., Stoyanov, D., Sirivichayakul, S., Carvalho, AF., Geffard, M., Maes, M., 2018e. Towards a new classification of stable phase schizophrenia into major and simple neuro-cognitive psychosis: Results of unsupervised machine learning analysis. J Eval Clin Pract. 24(4),879-891.
Kanchanatawan, B., Thika, S., Anderson, G., Galecki, P., Maes, M., 2018a. Affective symptoms in schizophrenia are strongly associated with neurocognitive deficits indicating disorders in executive functions, visual memory, attention and social cognition. Prog Neuropsychopharmacol Biol Psychiatry. 80(Pt C),168-176.
31
Kanchanatawan, B., Sirivichayakul, S., Ruxrungtham, K., Carvalho, AF., Geffard, M., Anderson, G., Maes, M., 2018b. Deficit Schizophrenia Is Characterized by Defects in IgM-Mediated Responses to Tryptophan Catabolites (TRYCATs): a Paradigm Shift Towards Defects in Natural Self-Regulatory Immune Responses Coupled with Mucosa-Derived TRYCAT Pathway Activation. Mol Neurobiol.55(3),2214-2226.
Kanchanatawan, B., Sirivichayakul, S., Thika, S., Ruxrungtham, K., Carvalho, AF., Geffard, M., Anderson, G., Noto, C., Ivanova, R., Maes, M., 2017b. Physio-somatic symptoms in schizophrenia: association with depression, anxiety, neurocognitive deficits and the tryptophan catabolite pathway. Metab Brain Dis.32(4),1003-1016.
Kanchanatawan, B., Sriswasdi, S., Maes, M., 2019. Supervised machine learning to decipher the complex associations between neuro-immune biomarkers and quality of life in schizophrenia. Metab Brain Dis.34(1),267-282.
Kay, SR., Fiszbein, A., Opler, LA., 1987. The positive and negative syndrome scale (PANSS) for schizophrenia. Schizophr. Bull. 13,261-276.
Keefe, RS., Harvey, PD., 2012. Cognitive impairment in schizophrenia. Handb. Exp. Pharmacol. 213,11–37.
32
Assessment of Cognition in Schizophrenia: Reliability, sensitivity, and comparison with a standard neurocognitive battery. Schizophr. Res.68,283–97.
Kircher, T., Bröhl, H., Meier, F., Engelen, J., 2018. Formal thought disorders: from phenomenology to neurobiology. Lancet Psychiatry.5(6),515– 526.
Kirkpatrick, B., Buchanan, RW., McKenney, PD., Alphs, LD., Carpenter, WT., 1989. The schedule for the deficit syndrome: an instrument for research in schizophrenia. Psychiatry Res. 30,119-123.
Lange, G., Steffener, J., Cook, DB., Bly, BM., Christodoulou, C., Liu, WC., Deluca, J., Natelson, BH., 2005. Objective evidence of cognitive complaints in Chronic Fatigue Syndrome: a BOLD fMRI study of verbal working memory. Neuroimage.26(2),513-524.
Luo, Y., He, H., Zhang, J., Ou, Y., Fan, N., 2019. Changes in serum TNF-α, IL-18, and IL-6 concentrations in patients with chronic schizophrenia at admission and at discharge. Compr. Psychiatry. 90,82-87.
Maes, M., 2011. An intriguing and hitherto unexplained co-occurrence: depression and chronic fatigue syndrome are manifestations of shared inflammatory, oxidative and nitrosative (IO&NS) pathways. Prog. Neuro-Psychopharmacol. Biol. Psychiatry. 35(3),784-794.
33 28,162-174.
Maes, M., Twisk, FN., 2010. Chronic fatigue syndrome: Harvey and Wessely's (bio)psychosocial model versus a bio(psychosocial) model based on inflammatory and oxidative and nitrosative stress pathways. BMC Med. 8,35.
Maes, M., Bosmans E., Ranjan, R., Vandoolaeghe, E., Meltzer, HY., De, Ley M., Berghmans, R., Stans, G., Desnyder, R., 1996. Lower plasma CC16, a natural anti-inflammatory protein, and increased plasma interleukin-1 receptor antagonist in schizophrenia: effects of antipsychotic drugs. Schizophr. Res.21(1),39-50.
Maes, M., Bocchio, CL., Bignotti, S., Battisa, Tura GJ., Pioli, R., Boin, F., Kenis, G., Bosmans, E., de, Jongh R., Altamura, CA., 2002. Increased serum interleukin-8 and interleukin- 10 in schizophrenic patients resistant to treatment with neuroleptics and the stimulatory effects of clozapine on serum leukemia inhibitory factor receptor. Schizophr. Res. 54(3),281-291.
Maes, M., Mihaylova, I., Leunis, JC., 2007. Increased serum IgA and IgM against LPS of enterobacteria in chronic fatigue syndrome (CFS): indication for the involvement of gram-negative enterobacteria in the etiology of CFS and for the presence of an increased gut-intestinal permeability. J. Affect. Disord. 99(1-3),237-40.
34
higher in myalgic encephalomyelitis / chronic fatigue syndrome than in depression. Psychother Psychosom. 81(5),286-295.
Maes, M., Ringel, K., Kubera, M., Anderson, G., Morris, G., Galecki, P., Geffard, M., 2013. In myalgic encephalomyelitis/chronic fatigue syndrome, increased autoimmune activity against 5-HT is associated with immuno-inflammatory pathways and bacterial translocation. J. Affect. Disord.150(2),223-230.
Maes, M., Kanchanatawan, B., Sirivichayakul, S., Carvalho, AF., 2018. In Schizophrenia, Deficits in Natural IgM Isotype Antibodies Including those Directed to Malondialdehyde and Azelaic Acid Strongly Predict Negative Symptoms, Neurocognitive Impairments, and the Deficit Syndrome. Mol. Neurobiol. doi: 10.1007/s12035-018-1437-6. [Epub ahead of print] PMID:30484113
Maes, M., Sirivichayakul, S., Kanchanatawan, B., Carvalho, A.F. 2019a. In schizophrenia, psychomotor retardation is associated with executive and memory impairments, negative and psychotic symptoms, neurotoxic immune products and lower natural IgM to malondialdehyde. Preprints, doi:10.20944/preprints201901.0108.v1.
Maes, M., Sirivichayakul, S., Kanchanatawan, B., Vodjani, A., 2019b. Breakdown of the paracellular tight and adherens junctions in the gut and blood brain barrier and damage to the vascular barrier in patients with deficit schizophrenia. Neurotox. Res. 36(2),306-322.
35
of Schizophrenia. In: Marneros A, Andreasen N, Tsuang MT (eds) Negative Symptoms in Schizophrenia: Relationship to Positive Symptoms and Outcome., Springer-Verlag, Berlin Heidelberg, pp 71-78.
Montoya, JG., Holmes, TH., Anderson, JN., Maecker, HT., Rosenberg-Hasson, Y., Valencia, IA., Chu, L., Younger, JW., Tato, CM., Davis, MM., 2017. Cytokine signature associated with disease severity in chronic fatigue syndrome patients. Proc Natl Acad Sci U S A 114(34), E7150-E7158.
Morris, G., Maes, M., 2013. Myalgic encephalomyelitis/chronic fatigue syndrome and encephalomyelitis disseminata/multiple sclerosis show remarkable levels of similarity in phenomenology and neuroimmune characteristics. BMC Med. 17,11,205.
Morris, G., Berk, M., Galecki, P., Maes, M., 2014. The emerging role of autoimmunity in myalgic encephalomyelitis/chronic fatigue syndrome (ME/cfs). Mol. Neurobiol.49(2),741-756.
Noto, MN., Maes, M., Nunes, SOV., Ota, VK., Rossaneis, AC., Verri, WA., Cordeiro, Q., Belangero, SI., Gadelha, A., Bressan, RA., Noto, C., 2019. Activation of the immune-inflammatory response system and the compensatory immune-regulatory system in antipsychotic naive first episode psychosis. Eur. Neuropsychopharmacol. 29(3),416-431.
36
Overall, JE., Gorham, DR., 1962. The brief psychiatric rating scale. Psycholog. Rep. 10,799-812.
Palmese, L., DeGeorge, P., Rattliff, J., Srihari, V., Wexler, B., Krystal, A., Tek, C., 2011. Insomnia is frequent in schizophrenia and associated with night eating and obesity. Schizophrenia Res 133, 238-243.
Reichenberg, A., 2010. The assessment of neuropsychological functioning in schizophrenia. Dialogues Clin Neurosci. 12(3),383–392.
Ritsner, M., Kurs, R., Gibel, A., Ratner, Y., Endicott, J., 2005. Validity of an abbreviated quality of life enjoyment and satisfaction questionnaire (Q-LES-Q-18) for schizophrenia, schizoaffective, and mood disorder patients. Qual Life Res. 14(7),1693-1703.
Roberts, D., 2018. Chronic fatigue syndrome and quality of life. Patient Relat Outcome Meas. 9,253-262.
Roerink, ME., Knoop, H., Bronkhorst, EM., Mouthaan, HA., Hawinkels, LJAC., Joosten, LAB., Van der Meer JWM., 2017. Cytokine signatures in chronic fatigue syndrome patients: a case control study and the effect of anakinra treatment. J. Transl. Med. 15,267.
37
Schizophrenia: The IRS-CIRS Theory of Schizophrenia. Preprints, doi: 10.20944/preprints201809.0289.v1.
Saury, JM., 2016. The role of the hippocampus in the pathogenesis of Myalgic Encephalomyelitis/Chronic Fatigue Syndrome (ME/CFS). Med. Hypotheses 86,30-38.
Seidman, LJ., Lanca, M., Kremen, WS., Faraone, SV., Tsuang, MT., 2003.Organizational and visual memory deficits in schizophrenia and bipolar psychoses using the Rey-Osterrieth complex figure: effects of duration of illness. J. Clin. Exp. Neuropsychol. 25(7),949–964.
Sim, K., Mahendran, R., Siris, SG., Heckers, S., Chong, SA., 2004. Subjective quality of life in first episode schizophrenia spectrum disorders with comorbid depression. Psychiatry Res. 129(2),141-147.
Sirivichayakul, S., Kanchanatawan, B., Thika, S., Carvalho, AF., Maes, M., 2019a. A new schizophrenia model: immune activation is associated with induction of different neurotoxic products which together determine memory impairments and schizophrenia symptom dimensions. CNS Neurol. Disord. Drug Targets. 18(2),124-140.
35(1),122-38 138. doi: 10.1007/s12640-018-9937-8.
Skapinakis, P., Lewis, G., Meltzer, H., 2000. Clarifying the relationship between unexplained chronic fatigue and psychiatric morbidity: results from a community survey in Great Britain. Am J Psychiatry. 157(9),1492-1498.
Slyepchenko, A., Maes, M., Jacka, FN., Köhler, CA., Barichello, T., McIntyre, RS., Berk, M., Grande, I., Foster, JA., Vieta, E., Carvalho, AF., 2017. Gut Microbiota, Bacterial Translocation, and Interactions with Diet: Pathophysiological Links between Major Depressive Disorder and Non-Communicable Medical Comorbidities. Psychother Psychosom. 86(1),31-46.
Smets, E., Garssen, B., Bonke, B., Haes, J., 1995.The multidimensional fatigue inventory (MFI) psychometric qualities of an instrument to assess fatigue. J. Psychosomatic Res. 39, 315-325. Smith, RS., Maes, M., 1995. The macrophage-T-lymphocyte theory of schizophrenia: additional evidence. Med. Hypotheses 45(2),135-141.
Stewart, JM., Medow, MS., Messer, ZR., Baugham, IL., Terilli, C., Ocon, AJ., 2012, Postural neurocognitive and neuronal activated cerebral blood flow deficits in young chronic fatigue syndrome patients with postural tachycardia syndrome. Am. J. Physiol. Heart Circ. Physiol. 302(5),H1185-1194.
39
Targum, S., Hassman, H., Pinho, M., Fava, M., 2012. Development of a clinical impression scale for fatigue. J. Psychiatric Res. 46;370-374.
Ye, L., Huang, Y., Zhao, L., Li, Y., Sun, L., Zhou, Y., Qian, G., Zheng, JC., 2013. IL-1β and TNF-α induce neurotoxicity through glutamate production: a potential role for neuronal glutaminase. J. Neurochem. 125(6),897-908.
Yu, M., Tang, X., Wang, X., Zhang, X., Zhang, X., Sha, W., Yao, S., Shu, N., Zhang, X., Zhang, Z., 2015. Neurocognitive impairments in deficit and non-deficit schizophrenia and their relationships with symptom dimensions and other clinical variables. PLoS One 10(9), e0138357.
40
ESF Figure 1 Results of Soft Independent Modelling of Class Analogy. Shown is the discrimination plot with the discriminatory power of the 12 FibroFatigue items.
41
42
ESF Figure 3 Correlation loading plot of the 12 FibroFatigue items. All FibroFatigue items are located between the outer and inner ellipses and group together indicating that all items
contribute significantly to the discrimination of patients and healthy controls as shown in ESF Figure 2.
43
44
45
ESF Figure 6 Results of Partial Least Squares analysis with the 12 symptom domains as output variables and biomarkers as input variables. 59.4% of the variance in the overall seveity of illness (OSOS) latent vector (LV) was explained by soluble interleukin (IL)-1 receptor (sIL-1RA), IL-1β, tumor necrosis factor (TNF)-α and CCL-11 (eotaxin).
SDS: Schedule for the deficit syndrome; SANS: Scale for the Assessment of Negative
46
ESF Figure 7 Results of neural network analysis. Relevance chart showing the (normalized) importances of all input variables predicting the total FibroFatigue scale score entered as output variable.
47
Table 1: Socio-demographic, clinical and biomarker data in healthy controls (HC) and deficit schizophrenia (SCZ) patients divided into
those with and without an increased FibroFatigue (FF) score.
Variables HC A n=54
SCZ (FF<23.5) B
n=63
SCZ (FF≥23.5)
n=57 F/χ2/KW df p
Age (Years) 37.9(10.3) 42.0(9.1) 39.9(10.2) 2.51 2/171 0.085 Sex (Female/Male) 18/36 26/37 22/35 0.79 2 0.672 BMI (kg/m2) 26.9(3.8) 26.7(52) 26.7(4.3) 0.04 2/171 0.962
Age of onset (Years) - 30.6(8.6) 30.0(10.9) 0.11 1/118 0.737 Education (0,1,2,3) 2.85(0.45)B,C 1.41(0.84) A 1.33(0.95)A KW - ˂0.001
Marital state (Y/N) 23/31 29/33 24/32 0.26 2 0.876 TUD (N/Y) 37/17 39/24 39/18 0.77 2 0.680 Rural/Urban 2/52 6/57 10/47 5.80 2 0.055 Employment (N\Y)* 4/50B,C 50/13 A 48/9 A 84.95 2 ˂0.001 MMSE* 28.4(0.7)B,C 15.7(0.6)A 15.6(0.6)A 94.73 2/168 ˂0.001
List learning* 56.7(1.5)B,C 26.2(1.2)A 25.9(1.3)A 120.98 2/168 ˂0.001
Digit sequencing task* 16.9(0.6)B,C 4.5(0.5)A 4.4(0.5)A 138.72 2/168 ˂0.001
Category instances * 67.2(2.6)B,C 33.4(2.0)A 33.7(2.1)A 51.53 2/168 ˂0.001
Control oral word association* 32.5(0.6)B,C 7.1(0.5)A 6.0(0.5)A 495.71 2/168 ˂0.001
Symbol coding* 78.6(2.3)B,C 18.8(1.8)A 19.4(1.9)A 215.14 2/168 ˂0.001
Tower of London * 18.2(0.6)B,C 7.4(0.5)A 6.3(0.5)A 94.02 2/168 ˂0.001
Psychosis -1.24(0.0)B,C 0.23(0.55)A,C 0.92(0.60)A,B KW - ˂0.001
Hostility -1.00(0)B,C 0.21(0.70)A,C 0.72(1.00)A,B KW - ˂0.001
Excitation -1.11(0.0)B,C 0.19(0.68)A,C 0.84(0.79)A,B KW - ˂0.001
Mannerism -1.00(0.0)B,C 0.05(0.67)A,C 0.89(0.90)A,B KW - ˂0.001
FTD -1.22(0.0)B,C 0.21(0.62)A,C 0.92(0.56)A,B KW - ˂0.001
PMR -0.99(0)B,C 0.11(0.78)A,C 0.82(0.87)A,B KW - ˂0.001
48
SANS 1.0(0.6)B,C 82.8(15.1)A,C 100.2(13.2)A,B KW - ˂0.001
SDS 0.0(0.0)B,C 37.6(4.4)A,C 42.2(3.2)A,B KW - ˂0.001
PANSS Neg. 7.0(0.0)B,C 30.7(5.3)A,C 35.8(5.2)A,B KW - ˂0.001
HAM-D 0.0(0.0)B,C 24.8(6.4)A,C 33.8(7.1)A,B KW - ˂0.001
HAM-A 0.7(1.3)B,C 21.4(3.3)A,C 25.0(3.6)A,B KW - ˂0.001
IL-1β ( pg/ml)** 3.68(0.70)B,C 9.30(0.54)A 10.32(0.59)A 25.18 2/166 ˂0.001 sIL-1RA (pg/ml)** 282.8(44.2)B,C 564.8(34.3)A 566.6(37.1)A 12.09 2/166 ˂0.001 TNF-α (pg/ml)** 39.0(2.6)B,C 59.2(2.0)A 60.8(2.1)A 21.71 2/166 ˂0.001 sTNFR1 ( pg/ml)** 961.3(134.1)B,C 1508.6(104.1)A 1505.1(112.5)A 8.55 2/166 ˂0.001 sTNFR2 (pg/ml)** 739.9(141.0)B,C 1316.6(109.4)A 1267.5(118.3)A 12.43 2/166 ˂0.001 CCL-11 (pg/ml)** 126.9(13.0)B,C 288.9(10.1)A 275.8(10.9)A 57.45 2/166 ˂0.001 MCP-1 (pg/ml)** 202.4(30.0)B,C 320.5(23.0)A 331.2(24.9)A 10.21 2/166 ˂0.001
All analysis of contingency tables (χ2), analysis of variance (F), or Kruskal-Wallis test (KW), *All values of univariate GLM analyses adjusted for age, sex, and education.
**All values of univariate GLM analyses adjusted for age, sex, BMI, TUD, and education. These data are processed in Ln or square root transformation
Education (0,1,2,3): 0: Illiterate, 1: Primary school, 2: Secondary school, 3: Diploma-BSc.
BMI: Body mass index; SDS: Schedule for the deficit syndrome; SANS: Scale for the Assessment of Negative Symptoms; PANSSneg: Negative subscale of the Positive and Negative Syndrome Scale; BPRS: Brief Psychiatric Rating Scale; FF score: FibroFatigue scale; FTD: Formal thought disorders; PMR: Psychomotor retardation; MMSE: Mini Mental State Examination; HAM-A, HAM-D: Hamilton Anxiety and Depression Rating Scale score;
49
Table 2: Results of explanatory factor analysis (EFA) expressed as Bias Corrected Factor loadings with 95% confidence intervals (CI) in patients with schizophrenia (SCZ) and in the combined group pf patients and controls.
Variables
SCZ+Controls SCZ
Psychosis 0.969 (0.957-0.978) 0.900 (0.857-0.927)
Hostility 0.836 (0.787-0.865) 0.717 (0.607-0.789)
Excitation 0.878 (0.844-0.912) 0.702 (0.607-0.774)
Mannerism 0.845 (0.801-0.876) 0.661 (0.677-0.819)
FTD 0.964 (0.949-0.974) 0.906 (0.873-0.928)
PMR 0.860 (0.823-0.889) 0.821 (0.747-0.861)
FF 0.937 (0.915-0.953) 0.629 (0.484-0.718)
HAM-A 0.960 (0.941-0.970) 0.789 (0.701-0.851)
HAM-D 0.973 (0.962-0.982) 0.850 (0.797-0.893)
SANS 0.974 (0.965-0.982) 0.885 (0.818-0.919)
SDS 0.938 (0.917-0.952) 0.691 (0.585-0.771)
PANSS neg 0.982 (0.973-0.988) 0.893 (0.847-0.924)
Characteristics (bootstrapped) SCZ+Controls SCZ
% variance 0.8658 0.66834
KMO 0.951 (0.953-0.958) 0.932 (0.930-0.939)
Root mean square of residuals 0.0406 (0.032-0.050) 0.060 (0.042-0.074)
Kelly’s criterion 0.0758 0.0913
Goodness of fit index (GFI) 0.998 (0.997-0.999) 0.993 (0.988-0.997)
Adjusted GFI (AGFI) 0.998 (0.996-0.999) 0.991 (0.985-0.996)
Unidimensional Congruence (UNICO) 0.998 (0.997-0.999) 0.982 (0.967-0.995)
Explained Common Variance (ECV) 0.952 (0.940-0.962) 0.910 (0.884-0.941)
Mean of Item Residual Absolute loadings
(MIREAL) 0.193 (0.168-0.216) 0.202 (0.148-0.234)
Generalized H-Index 0.995 (0.992-0.998) 0.967 (0.957-0.972)
50
51
Table 3: Partial correlation coefficients between the FibroFatigue (FF) score and scores on all other symptom domains in patients with schizophrenia (SCZ) and in the combined group pf patients and controls.
FTD: Formal thought disorders;
PMR: Psychomotor retardation;
HAM-A, HAM-D: Hamilton Anxiety and Depression Rating Scale score;
SANS: Scale for the Assessment of Negative Symptoms;
SDS: Schedule for the Deficit Syndrome
PANSSneg: Negative subscale of the Positive and Negative Syndrome Scale;
** All values of partial correlation coefficient with age, sex, and education as covariates.
* p<0.0001 (after p-correction); ** p<0.001 (after p-correction). Variables
SCZ+Controls * n=169
SCZ ** n=115
Psychosis 0.834 0.526
Hostility 0.625 0.300
Excitation 0.713 0.360
Mannerism 0.640 0.470
FTD 0.822 0.520
PMR 0.684 0.424
HAM-A 0.927 0.510
HAM-D 0.896 0.568
SANS 0.942 0.618
SDS 0.951 0.599
52
Table 4: Results of multiple regression analysis with FibroFatigue score as dependent variable.
Explanatory variable B SE t p F model df p R2
Model SDS HAM-D 0.747 0.251 0.045 0.045 16.54 5.35 ˂0.001 ˂0.001
1599.53 2/171 ˂0.001 0.949
Model Flattening Sense of purpose Anhedonia Poverty of speech Restricted affect 0.132 0.087 0.106 0.074 0.059 0.027 0.026 0.027 0.026 0.022 4.91 3.31 3.91 2.91 2.73 ˂0.001 0.001 ˂0.001 0.004 0.007
588.92 5/168 ˂0.001 0.946
SDS: Schedule for the Deficit Syndrome
53
Table 5: Results of stepwise multiple regression analysis with FF scores as dependent variable.
Explanatory variables B SE t p F df p R2
Model
COWA -0.924 0.029 -31.76 ˂0.001
108.89 1/172 ˂0.001 0.854
Model CCL-11 TNF-α IL-1β sIL-RA sTNFR1 0.366 0.267 0.252 0.175 0.115 0.052 0.053 0.051 0.098 0.050 7.09 5.07 4.95 3.67 2.30 ˂0.001 ˂0.001 ˂0.001 ˂0.001 0.023
67.33 5/168 ˂0.001 0.667
COWA: Control oral word association
CCL-11 or eotaxin
TNF: tumor necrosis factor
IL: interleukin;
IL-1RA: IL-1 receptor antagonist