Article
A microfluidic spheroid culture device with a
concentration gradient generator for high-throughput
screening of drug efficacy
Wanyoung Lim 1 and Sungsu Park 1, 2, *
1 Department of Biomedical Engineering, Sungkyunkwan University, Suwon 16419, Korea [email protected]
2 School of Mechanical Engineering, Sungkyunkwan University, Suwon 16419, Korea * Correspondence: [email protected]; Tel.: +82–31–290–7431
Abstract: Three-dimensional (3D) cell culture is considered more clinically relevant in mimicking the structural and physiological conditions of tumors in vivo compared to two-dimensional cell cultures. In recent years, high-throughput screening (HTS) in 3D cell arrays has been extensively used for drug discovery because of its usability and applicability. Herein, we developed a microfluidic spheroid culture device (μFSCD) with a concentration gradient generator (CGG) that enabled cells to form spheroids and grow in the presence of cancer drug gradients. The device is composed of concave microwells with several serpentine micro-channels which generate a concentration gradient. Once the colon cancer cells (HCT116) formed a single spheroid (approximately 120 μm in diameter) in each microwell, spheroids were perfused in the presence of the cancer drug gradient irinotecan for 3 days. The number of spheroids, roundness, and cell viability, were inversely proportional to the drug concentration. These results suggest that the μFSCD with a CGG has the potential to become an HTS platform for screening the efficacy of cancer drugs.
Keywords: spheroids; concentration gradient generator; drug screening; high-throughput
1. Introduction
Traditionally, two-dimensional (2D) cell cultures have been commonly used for evaluating efficacy or toxicity of drug candidate molecules in screening studies [1]. However, studies have shown that a) 2D cell culture models are relatively poor in predicting drug responses, and b) there are significant differences in the phenotypic and functional characteristics between 2D and 3D cell cultures [2, 3]. 3D cell culture models represent the in vivo microenvironments more accurately, and their predictability of drug effectiveness is better [4-6]. Recently, high-throughput screening (HTS) techniques of drugs have incorporated 3D cell cultures, and have rapidly progressed in the testing and selection of these drugs [7-9]. Accordingly, 3D cell arrays are extensively used nowadays for drug screening applications. From these, scaffold-free, 3D cell arrays—such as low-adhesion plates, micro-patterned plates, and hanging drop micro-plates—are being the most commonly used at the present time [10-13]. These methods rely on the self-aggregation of cells. Moreover, these 3D cell arrays would include scaffolds, such as hydrogels and meshes, to mimic cell-to-extracellular matrix interactions and tissue-specific properties [14, 15]. These micro-plate-based 3D cell arrays involve robotics, liquid handling devices, sensitive detectors, and software, for data processing and control [16]. Furthermore, they are associated with several advantages, such as their reproducibility, simplicity of use for handling cultures, and abilities to treat and routinely analyse multi-cellular spheroids. However, current robotic systems are burdened by several issues, such as high costs, poor reliability of data, standardisation of data types, rapid and accurate dispensing of very small liquid volumes, and uncontrolled evaporation of dispensed liquids [17]. The cost of biological samples and
reagents for drug screening is also high because of high-volume consumptions. Therefore, new HTS systems combined with microfluidics, which require low sample and liquid volumes, are affordable, can easily handle small liquid volumes, enable serial processing and analysis, and are in an urgent need for the drug discovery industry.
Microfluidic spheroid formation platforms have been applied to HTS for long-term perfusion cell cultures and have maintained high-cell viability.In the past, numerous microfluidic platforms have been designed for formation of spheroids using microwells or U-shaped microstructures in the device. Microwell-based microfluidic platforms have been utilised more than other methods owing to their simplicity and easy operation [18-20]. Liu et al. designed a microfluidic device which had temporary U-shaped pneumatic microstructures for high-throughput spheroid formation, culture assessments, and drug efficacy tests [21]. These platforms were often combined with a concentration gradient generator (CGG) as a mixing channel [22-24]. Such a channel can be controlled for precise flow control. Recently, Fan et al. reported a high-throughput drug screening brain cancer chip composed of a photo-polymerised hydrogel to form multiple cancer spheroids [25]. They demonstrated that the culture array in association with a gradient generator was capable of forming spheroids, and for widespread parallel testing of drug responses. However, their microfluidic chip is difficult to be commercialised because of the short storage time of the hydrogel. In addition, because cells are injected through inlets, it is difficult for cells to go into the microwells through sub-channels, and their losses are thus high.
In this study, we developed a microfluidic spheroid culture device (μFSCD) with a CGG made of poly-dimethyl siloxane (PDMS) for evaluating the efficacy of cancer drugs to tumor spheroids. In the device, colon cancer cells (HCT116) were first deposited in concave microwells and later adhered to each other because they were not able to attach to the surface that was coated with bovine serum albumin (BSA). Once spheroids formed in this device, they were perfused with the anti-neoplastic enzyme inhibitor irinotecan (Camptosar ®) to demonstrate the feasibility of the device for HTS applications. The device allowed cells to grow in 3D and to be perfused at different drug concentrations.
2. Results
2.1 Design of the μFSCD with a CGG
Figure 1. Design of the μFSCD with a CGG. View (A) and dimensions (B) of the μFSCD with a CGG; (C) schematic showing two layers in the μFSCD with a CGG.
2.2 Concentration Gradient on the μFSCD with a CGG
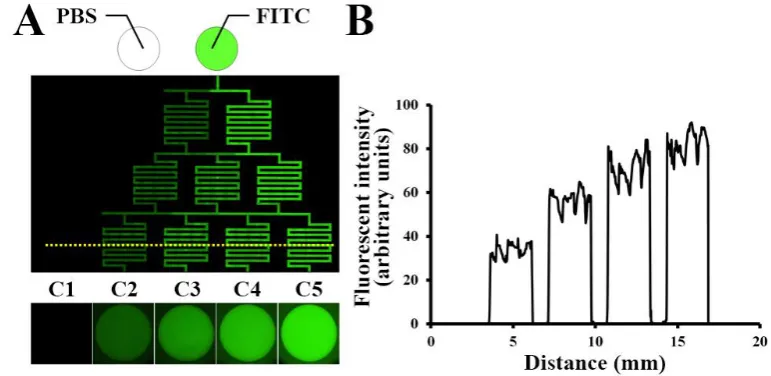
To quantify the concentration gradient, the same volume (250 μL) of phosphate-buffered saline (PBS) and 5 μM fluorescein isothiocyanate (FITC) in PBS were filled into the left and right inlets. Fluorescent images were taken every 8 h and the concentration gradient was maintained for 16 h. Different intensities of fluorescence were observed through the parallel channels (Figure 2A). The fluorescent intensity was highest in the right channel (C5; approximately 85%) and decreased gradually from C5 to C1 (Figure 2B).
Figure 2. Concentration gradient of FITC in the μFSCD with a CGG. (A) Fluorescent image of FITC in the channels and concave microwells (C1–C5) 16 h after injection of PBS and FITC into the left and right inlets; (B) Fluorescent intensities of channels as a function of distance (yellow dotted line)
2.3. Spheroid Formation in the μFSCD with a CGG
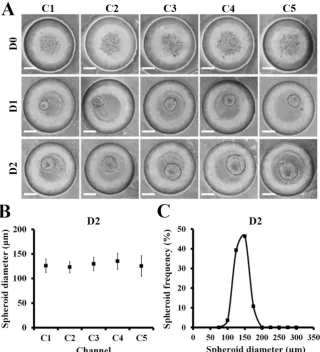
Figure 3. HCT116 spheroid formation in the μFSCD with a CGG at different days (0–2). (A) Optical images of spheroids formed in concave microwells. Scale bars, 100 μm; (B) Spheroid diameters in each channel at day 2 (n = 10); (C) Spheroid diameter frequency distribution at day 2 (n = 50).
2.4. Drug Screening for Spheroids in the μFSCD with a CGG
Figure 4. Responses of HCT116 spheroids to irinotecan in the μFSCD with a CGG. (A) Optical images of HCT116 spheroids with the treatment of 5 μM irinotecan at various days (D2–D5) (Scale bars, 100 μm). Relative numbers (B) and relative roundness values (C) of HCT116 spheroids in each channel at D2 and D5 (n = 20, Student’s t-test, *P<0.05, ***P<0.001). Live/dead staining images (D) and cell viability (E) of HCT116 spheroids treated with irinotecan in each channel at day 5 (Scale bars, 100 μm). Calcein AM (green) and EthD-1 (red) were used to stain live and dead cells, respectively.
3. Discussion and Conclusions
ranged from 100 to 220 μm [30], so the spheroids with diameters in the range of 100 to 150 μm were selected for drug responses. As a result of the optimisation of the cell density to 5 × 10⁴ cells/mL, spheroids with a relatively uniform size distribution with an average diameter of 120 μm were obtained in the μFSCD with a CGG (Figure 2). Although our experiments were performed with the use of a spheroid with an average diameter of 120 μm in size, the size of the spheroid can be controlled based on the cell density [25]. The homogeneity of spheroids is also very important to obtain precise drug responses. When the size of the spheroids is not homogeneous, the permeability of nutrients, gas, and drug, differs for each spheroid, and elicits various drug responses [31-33]. The μFSCD with a CGG can generate homogeneous spheroids because it is easy to load a similar number of cells through the cell injection hole.
Gradient generation by CGG provided five different irinotecan concentration conditions and was suited for HTS with a large number of spheroids in parallel. The concentrations can be also easily calculated [34, 35]. Thus, the irinotecan concentrations at the channels (C1-C5) are calculated to be 0, 1.25, 2.5, 3.75 and 5 μM, respectively. CGG has been included in many microfluidic systems for drug screening because it generates various drug concentrations by perfusing a single concentration of the drug. Additionally, its concentration is predictable so it is advantageous to identify the appropriate concentration of the drug [35]. Furthermore, PDMS are proper for extending the duration of the chemical gradient because of their evaporation and liquid absorption functions [36]. In the future, the number of concentration points can be increased to handle more drug concentrations at any time instant.
In addition, the numbers and shapes of spheroids can be easily observed under an optical microscope in label-free conditions owing to the transparent PDMS substrate (Figure 3). Spheroid disaggregation increased after drug treatment. Thus, it was difficult to compare the drug effects by measuring the spheroid diameters. Instead of measuring the diameter, the surface of the spheroids was measured [37], and spheroids which displayed a rough surface were not counted (Figure 3B). The roundness of the spheroids elicited more accurate drug response results as their spheroid shapes were collapsed by the drug (Figure 3C). Furthermore, viability analysis by live/dead staining can provide a sensitive measure of spheroid responses to a particular drug (Figure 4). Spheroids can be easily stained through the cell injection holes.
In conclusion, our μFSCD with a CGG offered a new approach for large-scale drug screening using spheroid microarrays. This approach was based on features of concave microwells connected with a CGG. Given that the μFSCD with the CGG provided a large amount of homogeneous 3D spheroids and several drug concentrations, it can constitute a convenient tool for widespread, parallel processing for the prediction of the effectiveness of the drugs and the determination of the proper cancer drug concentration in patients. Therefore, the proposed μFSCD with a CGG could be useful for clinical samples and could become cost-effective in personalised medicine given that a small number of cells can rapidly form spheroids, and given that the device consumes a small volume of nutrients and drugs.
4. Materials and Methods
4.1. Design and Fabrication of the Device
μm diameter), two inlets (8 mm diameter), and five outlets (2 mm diameter) were punched through the top layer. For the manufacturing of the bottom layer with the concave microwells, the cylindrical microwells were filled with PDMS and removed by wiping. Remained PDMS in the cylindrical microwells formed a concave meniscus. Details can be found in a previous publication [39]. Subsequently, both layers were treated with O2 plasma for 30 s at 90 W, and were then bound to each other.
4.2 Demonstration of Concentration Gradients in the μFSCD with a CGG
The inlets were filled with 250 μL of PBS, and PBS contained 5 μM FITC (Sigma–Aldrich). Fluorescent images were acquired every 8 h using a DeltaVision Elite fluorescence microscope (GE Healthcare, Chicago, IL, USA). Fluorescent intensity profiles over the μFSCD with a CGG were analysed with Image J (NIH, Bethesda, MD, USA).
4.3. Cells and their Maintenance
The colon cancer cell line (HCT116) was purchased from ATCC (Manassas, VA, USA). HCT116 was maintained in McCoy’s 5A medium (Life Technologies, Carlsbad, CA, USA) and was supplemented with 10% (v/v) fetal bovine serum (HyClone Laboratories, Inc., Logan, UT, USA), 100 units per mL of penicillin (Life Technologies) and 100 μg/mL of streptomycin (Life Technologies). The cell was cultured at 37°C with 5% CO2 and 95% relative humidity.
4.4 Operation of the μFSCD with a CGG
For sanitisation, 70% ethanol was carefully injected into the μFSCD with a CGG through one of the reservoirs, and was rinsed with PBS (pH=7.4) using a 1 mL syringe. The device was then coated with 3% (w/v) BSA (Sigma–Aldrich) for 1 h at RT to prevent cell adhesion to its surface. It was rinsed again three times with PBS to remove the uncoated BSA from it.
The freshly sanitised device was washed with medium through one of the reservoirs using a 1 mL syringe, and the inlets were filled with 250 μL of medium. Approximately 1 μL of 2 × 10⁴ cells/mL in medium were then loaded into the device through each cell injection hole using a pipette. The device, which contained the cells, was incubated at 37°C in a 5% CO2 incubator for 2 days to generate spheroids. After 2 days, inlets were filled with 250 μL of medium, and contained 5 μM irinotecan and medium. The inlet contents were replaced daily with fresh medium and contained 5 μM irinotecan or medium, and the outlet contents were removed over a period of 3 days.
4.5 Live/Dead Staining and Cell Viability Measurements
HCT116 spheroids at day 5 after irinotecan treatment were treated with a LIVE/DEAD™ Viability/Cytotoxicity Kit (Molecular Probes, Eugene, OR, USA), as suggested by the manufacturer. The prepared live/dead solution was dropped into the inlets and was then incubated at 37°Cfor 30 min. Green and red fluorescence intensities were measured with Image J, and cell viability was calculated as the ratio of the red with the green fluorescence intensities.
Author Contributions: W.L. and S.P.; conceived, designed the study, W.L.; performed and analysed the experiments, W.L. and S.P.; wrote the paper, S.P.; supervised the whole research.
Acknowledgments: This research was equally supported by the National Research Foundation grants (2018R1A2B2002066 and 2016M3A9B4917320) of Korea through the Ministry of Science and ICT (MSIT).
References
1. Fang, Y.; Eglen, R.M. Three-Dimensional Cell Cultures in Drug Discovery and Development. SLAS Discov.
2017,22, 456-472, 10.1177/1087057117696795.
2. Birgersdotter, A.; Sandberg, R.; Ernberg, I. Gene expression perturbation in vitro--a growing case for three-dimensional (3D) culture systems. Semin. Cancer Biol. 2005,15, 405-412, 10.1016/j.semcancer.2005.06.009. 3. Bhadriraju, K.; Chen, C.S. Engineering cellular microenvironments to improve cell-based drug testing.
Drug Discov. Today 2002,7, 612-620, 10.1016/s1359-6446(02)02273-0.
4. Nelson, C.M.; Bissell, M.J. Modeling dynamic reciprocity: engineering three-dimensional culture models of breast architecture, function, and neoplastic transformation. Semin. Cancer Biol. 2005, 15, 342-352, 10.1016/j.semcancer.2005.05.001.
5. Lee, J.; Cuddihy, M.J.; Kotov, N.A. Three-dimensional cell culture matrices: state of the art. Tissue Eng. Part B Rev. 2008,14, 61-86, 10.1089/teb.2007.0150.
6. Baharvand, H.; Hashemi, S.M.; Ashtiani, S.K.; Farrokhi, A. Differentiation of human embryonic stem cells into hepatocytes in 2D and 3D culture systems in vitro. Int. J. Dev. Biol. 2004,50, 645-652, 10.1387/ijdb.052072hb. 7. Edmondson, R.; Broglie, J.J.; Adcock, A.F.; Yang, L. Three-dimensional cell culture systems and their applications in drug discovery and cell-based biosensors. Assay Drug Dev. Technol. 2014, 12, 207-218, 10.1089/adt.2014.573.
8. Montanez-Sauri, S.I.; Beebe, D.J.; Sung, K.E. Microscale screening systems for 3D cellular microenvironments: platforms, advances, and challenges. Cell Mol. Life Sci. 2015,72, 237-249, 10.1007/s00018-014-1738-5.
9. Ryan, S.L.; Baird, A.M.; Vaz, G.; Urquhart, A.J.; Senge, M.; Richard, D.J.; O'Byrne, K.J.; Davies, A.M. Drug Discovery Approaches Utilizing Three-Dimensional Cell Culture. Assay Drug Dev. Technol. 2016, 14, 19-28, 10.1089/adt.2015.670.
10. Tung, Y.C.; Hsiao, A.Y.; Allen, S.G.; Torisawa, Y.S.; Ho, M.; Takayama, S. High-throughput 3D spheroid culture and drug testing using a 384 hanging drop array. Analyst 2011,136, 473-478, 10.1039/c0an00609b. 11. Madoux, F.; Tanner, A.; Vessels, M.; Willetts, L.; Hou, S.; Scampavia, L.; Spicer, T.P. A 1536-Well 3D Viability Assay to Assess the Cytotoxic Effect of Drugs on Spheroids. SLAS Discov. 2017, 22, 516-524, 10.1177/2472555216686308.
12. Kessel, S.; Cribbes, S.; Dery, O.; Kuksin, D.; Sincoff, E.; Qiu, J.; Chan, L.L. High-Throughput 3D Tumor Spheroid Screening Method for Cancer Drug Discovery Using Celigo Image Cytometry. SLAS Technol. 2017,22, 454-465, 10.1177/2211068216652846.
13. Zanoni, M.; Piccinini, F.; Arienti, C.; Zamagni, A.; Santi, S.; Polico, R.; Bevilacqua, A.; Tesei, A. 3D tumor spheroid models for in vitro therapeutic screening: a systematic approach to enhance the biological relevance of data obtained. Sci. Rep. 2016,6, 19103, 10.1038/srep19103.
14. Friedrich, J.; Seidel, C.; Ebner, R.; Kunz-Schughart, L.A. Spheroid-based drug screen: considerations and practical approach. Nat. Protoc. 2009,4, 309-324, 10.1038/nprot.2008.226.
15. Mosaad, E.O.; Chambers, K.F.; Futrega, K.; Clements, J.A.; Doran, M.R. The Microwell-mesh: A high-throughput 3D prostate cancer spheroid and drug-testing platform. Sci. Rep. 2018,8, 253, 10.1038/s41598-017-18050-1.
16. Du, G.; Fang, Q.; den Toonder, J.M. Microfluidics for cell-based high throughput screening platforms - A review. Anal. Chim. Acta. 2016,903, 36-50, 10.1016/j.aca.2015.11.023.
17. Wu, G.; Doberstein, S.K. HTS technologies in biopharmaceutical discovery. Drug Discov. Today 2006,11, 718-724, 10.1016/j.drudis.2006.06.010.
18. Chen, Y.C.; Lou, X.; Zhang, Z.; Ingram, P.; Yoon, E. High-Throughput Cancer Cell Sphere Formation for Characterizing the Efficacy of Photo Dynamic Therapy in 3D Cell Cultures. Sci. Rep. 2015, 5, 12175, 10.1038/srep12175.
19. Chen, Y.; Gao, D.; Liu, H.; Lin, S.; Jiang, Y. Drug cytotoxicity and signaling pathway analysis with three-dimensional tumor spheroids in a microwell-based microfluidic chip for drug screening. Anal. Chim. Acta. 2015,
898, 85-92, 10.1016/j.aca.2015.10.006.
22. Okuyama, T.; Yamazoe, H.; Mochizuki, N.; Khademhosseini, A.; Suzuki, H.; Fukuda, J. Preparation of arrays of cell spheroids and spheroid-monolayer cocultures within a microfluidic device. J Biosci. Bioeng. 2010,
110, 572-576, 10.1016/j.jbiosc.2010.05.013.
23. Kwapiszewska, K.; Michalczuk, A.; Rybka, M.; Kwapiszewski, R.; Brzozka, Z. A microfluidic-based platform for tumour spheroid culture, monitoring and drug screening. Lab Chip 2014, 14, 2096-2104, 10.1039/c4lc00291a.
24. Occhetta, P.; Centola, M.; Tonnarelli, B.; Redaelli, A.; Martin, I.; Rasponi, M. High-Throughput Microfluidic Platform for 3D Cultures of Mesenchymal Stem Cells, Towards Engineering Developmental Processes. Sci. Rep.
2015,5, 10288, 10.1038/srep10288.
25. Fan, Y.; Nguyen, D.T.; Akay, Y.; Xu, F.; Akay, M. Engineering a Brain Cancer Chip for High-throughput Drug Screening. Sci. Rep. 2016,6, 25062, 10.1038/srep25062.
26. Amaral, R.L.F.; Miranda, M.; Marcato, P.D.; Swiech, K. Comparative Analysis of 3D Bladder Tumor Spheroids Obtained by Forced Floating and Hanging Drop Methods for Drug Screening. Front Physiol 2017,8, 605, 10.3389/fphys.2017.00605.
27. Kim, C.; Bang, J.H.; Kim, Y.E.; Lee, S.H.; Kang, J.Y. On-chip anticancer drug test of regular tumor spheroids formed in microwells by a distributive microchannel network. Lab Chip 2012,12, 4135-4142, 10.1039/c2lc40570a. 28. Hong, J.W.; Quake, S.R. Integrated nanoliter systems. Nat. Biotechnol. 2003,21, 1179-1183, 10.1038/nbt871. 29. Langhans, S.A. Three-Dimensional in Vitro Cell Culture Models in Drug Discovery and Drug Repositioning. Front. Pharmacol. 2018,9, 6, 10.3389/fphar.2018.00006.
30. Sutherland, R.M. Cell and environment interactions in tumor microregions: the multicell spheroid model.
Science 1988,240, 177-184, 10.1126/science.2451290.
31. Kunz‐Schughart, L. Multicellular tumor spheroids: intermediates between monolayer culture and in vivo tumor. Cell Biol. Int. 1999,23, 157-161, 10.1006/cbir.1999.0384.
32. Mueller-Klieser, W. Multicellular spheroids. J. Cancer Res. Clin. Oncol. 1987, 113, 101-122, 10.1007/BF00391431.
33. Hirschhaeuser, F.; Menne, H.; Dittfeld, C.; West, J.; Mueller-Klieser, W.; Kunz-Schughart, L.A. Multicellular tumor spheroids: an underestimated tool is catching up again. J. Biotechnol. 2010, 148, 3-15, 10.1016/j.jbiotec.2010.01.012.
34. Dertinger, S.K.; Chiu, D.T.; Jeon, N.L.; Whitesides, G.M. Generation of gradients having complex shapes using microfluidic networks. Anal. Chem. 2001,73, 1240-1246, 10.1021/ac001132d.
35. Wang, X.; Liu, Z.; Pang, Y. Concentration gradient generation methods based on microfluidic systems. RSC Adv. 2017,7, 29966-29984, 10.1039/c7ra04494a.
36. Mulholland, T.; McAllister, M.; Patek, S.; Flint, D.; Underwood, M.; Sim, A.; Edwards, J.; Zagnoni, M. Drug screening of biopsy-derived spheroids using a self-generated microfluidic concentration gradient. Sci. Rep. 2018,
8, 14672, 10.1038/s41598-018-33055-0.
37. Lim, W.; Hoang, H.H.; You, D.; Han, J.; Lee, J.E.; Kim, S.; Park, S. Formation of size-controllable tumour spheroids using a microfluidic pillar array (muFPA) device. Analyst 2018,143, 5841-5848, 10.1039/c8an01752b. 38. Xia, Y.; Whitesides, G.M. Soft lithography. Annu. Rev. Mater. Sci. 1998, 28, 153-184, 10.1002/(sici)1521-3773(19980316)37:5<550::aid-anie550>3.0.co;2-g.