Trend-based Document Clustering for Sensitive and Stable Topic Detection
*Yoshihide Satoa, Harumi Kawashimab, Hidenori Okudab, and Masahiro Okub
a
NTT West Corporation b NTT Cyber Solutions Laboratories, NTT Corporation 1-1, Hikarino-oka, Yokosuka, Kanagawa, 239-0847 Japan
[email protected], {kawashima.harumi, okuda.hidenori, oku.masahiro}@labs.ntt.co.jp
Abstract. The ability to detect new topics and track them is important given the huge amounts of documents. This paper introduces a trend-based document clustering algorithm for analyzing them. Its key characteristic is that it gives scores to words on the basis of the fluctuation in word frequency. The algorithm generates clusters in a practical time, with O(n) processing cost due to preliminary calculation of document distances. The attribute allows the user to settle on the best level of granularity for identifying topics. Experiments prove that our algorithm can gather relevant documents with F measure of 63.0% on average from the beginning to the end of topic lifetime and it largely surpasses other algorithms.
Keywords: trend, clustering, gradient model, word frequency
1. Introduction
Due to the information explosion on the WWW, the cost of catching up with the latest trends has risen. Consumer Generated Media (CGM), such as weblogs and social networking service (SNS), are only accelerating this explosion. The best approach to recognizing trends from among the huge number of documents being created is to analyze the topics in them.
The goal of Topic Detection and Tracking (TDT) is to find state-of-the-art events in a stream of broadcast news stories (Allan et al., 1998). The study defines segmentation, new event detection, and event tracking as the major tasks. Segmentation proceeds by automatically dividing a text stream into topically homogeneous blocks. New event detection identifies stories in several continuous news streams that pertain to new or previously unidentified events. Event tracking identifies any and all subsequent stories describing the same event as sample instances of stories describing the event. Document clustering is an efficient approach to find topics in many documents. In the tasks, new event detection is intimately related to clustering, and involves the functions of retrospective detection and on-line detection. The input to retrospective detection task is the entire corpus, and it is desired to divide them into event-specific groups. The input to on-line detection is a chronologically ordered document stream, and the change point of topics should be found.
On the WWW, where documents are numerous and increasing hourly, our goal is to provide an environment that supports users on finding and tracking the topics. In particular, sensitive detection of new topics is needed there. Then, our research is categorized as both on-line event detection and event tracking in TDT. As a matter of fact, both aspects are essential for adequately grasping the topics. This paper introduces a trend-based document clustering algorithm that enables the detection of topic occurrence at the earliest possible stage and the observation of topic transition.
The remainder of this paper is organized as follows: Section 2 describes related work; Section 3 describes our clustering algorithm; Section 4 describes our experiments and their results; and we conclude in Section 5.
2. Related Work
New event detection is the target of incremental clustering algorithms for on-line documents. In new event detection, conventionally, the similarity between new document and existing clsuters are
*
calculated, and it is judged that which cluster is appropriate to include the document or any one is inappropriate. Developments of similarity measure (Dharanipragada et al., 1999) and term weighting (Brants et al., 2003) have proposed for better detection performance.
Many clustering algorithms have been applied for the task, such as single-pass based algorithm (Papka and Allan, 1998) and incremental k-means algorithm (Walls et al., 1999). They do not consider trends in on-line documents. However, it is required to focus attention on “time” for the sensitive topic detection.
The time-focused approach attempts to enhance detection performance by attenuating document similarities on the basis of time interval between documents (Yang et al., 1998). The strategy yielded measurable improvements in their on-line detection experiments. Word distribution in a corpus is used to choose core lexicon in the corpus (Zhang et al., 2004). The algorithm is applied to choose topical words in document if the documents are divided into some parts by their timestamps, though time temporal continuity is not considered.
Another incremental clustering algorithm F2ICM (Ishikawa et al., 2001; Khy et al., 2006) is characterized by its ease in updating the statistics value used for calculating document similarities when new documents arrive. It defines the forgetting model as being exponential. It attenuates worth of documents exponentially as time passes, as if they are forgotten. In their model, recent documents are likely to be situated closer to each other, and older ones are likely to be more widely separated. The algorithm tends to generate clusters containing especially newer documents. On the other hand, persistent clusters are seldom generated. Thus, the algorithm is not the best way to observe topics continuously in terms of event tracking.
3. Trend-based Clustering Algorithm
What the prior studies lack in is the responsiveness to the current trends. Our approach to accomplish the goal is based on the trends in documents.
More and more documents describing the same event are created when people’s interest in the event arises. In on-line documents, a rapid increase in the frequency of a word indicates a trend toward one or more topics relevant to the word. Taking such trends into account, when clustering documents, yields the sensitive detection of new topics.
The most remarkable feature in our algorithm is that it senses current trends by word frequency fluctuation and gathers relevant documents based on the latest trends. Since its clustering process finishes in a short time after the classification granularity is indicated, it helps users to find adequate clustering results interactively that meet their intentions.
Word weights in our algorithm involve word appearance growth and its accumulative appearance. We declare the gradient model in the following part before describing word weights. The concept of gradient, essential idea in our algorithm, represents the growth of the two aspects. Word weighting algorithm is described in the second subsection, and the clustering algorithm is detailed in the third subsection.
3.1.Gradient Model
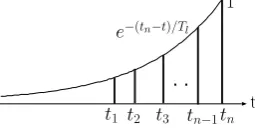
The impression of word appearance in a document declines over time. Suppose that the initial intensity of the impression is one, the intensity after time
Δ
t
can be defined as following the forgetting model in Fl
T t
e−Δ/
2
ICM (Ishikawa et al., 2001). denotes the parameter deciding the rate of intensity attenuation.
l
T
. . 1
t
e−(tn−t)/Tl
t1 t2 t3 tn−1tn Figure 1: Impression Intensity.
Figure 1 shows the residual impression of each appearance of word w. Here, is the time of the
nth appearance. Given that the current time is , the current appearance is assigned the maximum
n
t
n
(
w
,
t
n+1)
=
e
−Δt/T⋅
TREND
(
w
,
t
n)
+
G
(
w
,
t
n+1)
.
(12)
TREND
sAll the system has to do is to preserve the latest M, F, and TREND for each word, and the timestamp when they were last updated. When a new document arrives, M and F for the words in the document are updated as shown in Equation 2, and then the latest TREND is calculated as shown in Equation 12.
For trend-based document clustering, documents are expressed as vectors based on TREND. The vector of document dn (arrived at tn) is defined in the following equation.
(
) (
) (
)
(
)
(
1,
n,
2,
n,
3,
n,
,
m,
n)
.
(13)
n
W
w
t
W
w
t
W
w
t
W
w
t
v
=
L
Here, m denotes the number of unique words in dn, and weight W
(
wx,tn)
is defined as follows.(
)
(
)
(
)
.
(14)
else
0
,
if
0
,
,
>
⎩
⎨
⎧
=
x n x nn x
t
w
TREND
t
w
TREND
t
w
W
Equation 14 means that words with negative trend scores are eliminated from the document. This is because words with negative score can be considered to be completely irrelevant to current trends. However, the same word in another document is used for vector element if its trend score rises above zero due to the arrival of the second document.
3.3.Clustering based on Trend Scores
Many clustering algorithms have been invented, which are roughly classified into hierarchical or partitioning-optimization. The former generate a document tree called a dendrogram, whereas the latter give flat document clusters without any hierarchy.
For observing topic transition, the clustering algorithm should offer cluster reproducibility. There are two perspectives to reproducibility. First, the documents, already classified into clusters, should not be moved to another cluster when a new document arrives. If documents in a cluster move continuously, we cannot observe topic expansion and declination. Next, the documents should also remain stable when classification granularity is changed. If cluster coherency is preserved during the merging and partitioning processes, we can find the most effective level of granularity easily.
For the twin goals of reproducibilities, our approach is based on the single linkage clustering algorithm as a hierarchical scheme. Most hierarchical algorithms have processing cost of O(n2) where n is the number of documents. However, the single linkage algorithm has processing cost of
O(n) after a threshold is given and the nearest document for each document has been already identified.
Our clustering algorithm is composed of two steps. In the first step, distances between a new document and prior ones are calculated upon its arrival, and the nearest one is recorded in a nearest-neighbor table. In the second step, document clusters are generated based on the threshold given by the user. This admits of interactive analysis through the flexible threshold changes in a practical time by usingthe nearest-neighbor table as a cache.
The distance between two clusters, in the single linkage algorithm, is defined as the distance between the closest documents in the clusters. One of the problems in this algorithm is the chaining phenomenon, which is due to the definition of distances between clusters. Even if each two documents in a cluster are substantially relevant, the farthest documents in the cluster may cover decidedly irrelevant topics. The focus of the single linkage algorithm is the result of giving preference to both high speed clustering performance and reproducibility rather than trying to suppress the influence of chaining.
The two key steps in our clustering algorithm are detailed below.
Step1: Updating Nearest-Neighbor Table
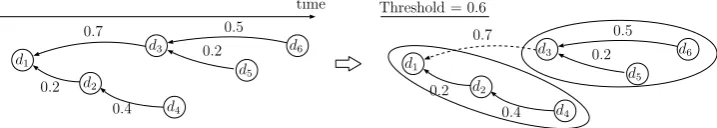
nearest links from newer document to older one, and the values beside the arrows denote the distance between twodocuments.
When the latest document d6 arrives, the nearest-neighbor table is updated as follows.
time
d1
d2
d4
d5 d6
0.2
d3
0.4 0.7
0.2 0.5 Threshold = 0.6
d1
d2
d4
d5 d6
0.2
d3
0.4 0.7
0.2 0.5
Figure 3: Nearest-Neighbor Table and Clusters
First, for the words in d6, M, F, and TREND are updated based on their previous results and the elapsed time since they were last updated. In the definition of trend scores in Equation 11, the score for a word with the first appearance is one. The timestamp of d6 is stored for the next update. Then, the current trend scores are assigned to d6; the weighted words form the vector of the document. Though trend scores of words are updated whenever new documents arrive,
v
6 (the vector of d6) isnever updated even if the new documents contain same words in d6. In other words, weighted words in a document reflect the trends at the time of its arrival. Therefore, scores in different documents may be different if the documents arrive at different times.
Second, v6 is compared to the vectors of older documents respectively, and the distances are calculated. The distance between two documents is defined by subtracting cosine similarity of respective vectors from one. The cosine similarity is normalized between zero and one.
(
,
)
1
sim
( )
,
.
(15)
dis
d
md
n=
−
v
mv
nWhen the nearest document as d6is identified from among the older documents, the identifier of the nearest document and the corresponding distance are added to the nearest-neighbor table. In the Figure 3, the nearest neighbor as d6is d3, and the distance is 0.5.
Step2: Clustering based on Nearest-Neighbor Table
The clustering process begins after the threshold is given. Since the nearest-neighbor table specifies the most similar older documents, document clusters can be generated in a short time.
The right of Figure 3 shows the composition of clusters after threshold 0.6 is given. Links shorter than 0.6 are valid, and only the link from d3 to d1is regarded as invalid. As a result, two clusters, “d1,
d2, d4” and “d3, d5, d6”, are generated. Since it is not necessary to update distances between clusters during clustering processes, the algorithm can generate clusters with O(n) processing cost. Even if the threshold is changed, the algorithm can process again with the same cost.
4. Evaluation
For the evaluation, we reviewed the clusters generated by our algorithm, and examined the sensitivityperformance as regards new topics.
We used the Mainichi newspaper tagged corpus (in Japanese) in our experiments. All articles are tagged with issued date and category of the page on which they were placed, such as world topics, politics, economics, and sports. Several keywords are attached to each article.
We extracted 1,037 articles which are classified as world topics in January and February in 1994. The number of keywords in articles varies from 8 to 243, and the average article includes 54.2 keywords. We used the keywords as the elements of the document vectors. Though we stated that trend scores are updated each time a new document arrives, the scores are updated once a day in this experimentbecause the documents in the corpus had only day-based timestamps.
4.1.Reviewing Clusters
different thresholds.
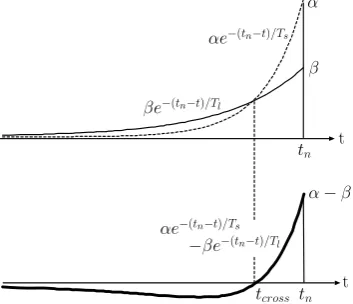
In this experiment, we set Tl as 10(days) and Ts as 5(days) so as to set tcross to 7(days) approximately. The appearance in the last seven days is thus emphasized in calculating trend scores. Our word weighting algorithm performs reasonably well only when the positive and negative regions of the differential curve are populated by existing documents; word scores calculated in the earlier period are not proper. Therefore, the articles prior to the last thirty days (about half of whole period) were not used for constructing the nearest-neighbor table, though all articles were processed to obtain trend scores during the last thirty days. Consequently, 567 articles (from the total of 1,037) were included in the nearest-neighbor table, and used for clustering.
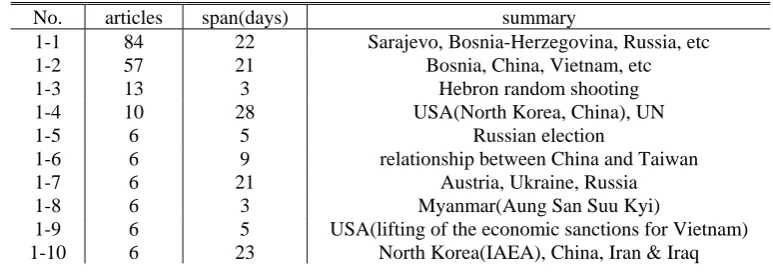
Table 1 and Table 2 summarize the largest top 10 clusters yielded by our algorithm. They are the results at the end of the two months. In the results in Table 1, instead of giving distance threshold directly, we indicate the threshold that made the number of clusters half the number of articles in the nearest-neighbor table. In the results in Table 2, we set the threshold to make the number of clusters one quarter the number of articles. Clusters are sorted by size, the number of articles in it, in descending order. Span is the days from the timestamp of the latest article to that of the earliest one in each cluster. Clusters are manually summarized at the rightmost column.
Table 1: The Summary of Top 10 Clusters (clusters: 1/2).
No. articles span(days) summary
1-1 84 22 Sarajevo, Bosnia-Herzegovina, Russia, etc
1-2 57 21 Bosnia, China, Vietnam, etc
1-3 13 3 Hebron random shooting
1-4 10 28 USA(North Korea, China), UN
1-5 6 5 Russian election
1-6 6 9 relationship between China and Taiwan
1-7 6 21 Austria, Ukraine, Russia
1-8 6 3 Myanmar(Aung San Suu Kyi)
1-9 6 5 USA(lifting of the economic sanctions for Vietnam) 1-10 6 23 North Korea(IAEA), China, Iran & Iraq
Table 2: The Summary of Top 10 Clusters (clusters: 1/4).
No. articles span(days) summary
2-1 160 30 North Korea(IAEA), China, South Korea 2-2 87 22 Sarajevo, Bosnia-Herzegovina, PKO, etc 2-3 21 24 relationship between China and Taiwan, North Korea
2-4 14 8 Russian politics
2-5 13 3 Hebron random shooting
2-6 10 9 Italy, China, NATO
2-7 9 19 North Korea, Russia
2-8 9 14 Taiwan, Israel
2-9 7 21 NATO, Russia
2-10 6 3 Myanmar(Aung San Suu Kyi)
As for the clusters in Table 1, a review finds that No.1-3, 1-5, 1-6, 1-8, and 1-9 cover single topics; the other clusters are composed of several topics. The results are relative to cluster span. Clusters with short span gather relative articles quite precisely. Longer cluster spans indicate more topics. Larger clusters, such as No.1-1 and 1-2, cover especially wide various topics due to the chaining effect.
prior days. On the other hand, due to the negative coefficient in the differential curve, it seldom reaches high scores after big peaks pass.
Eventually, Trend scores faithfully follow document frequency change, and they reflect the beginning and the end of trend lifetime. Moreover, they are unaffected by smaller peaks.
Clustering Performance
We evaluated clustering performance precisely.
For this experiment, we prepared a target article group with fifteen articles among the corpus. They are manually gathered so as to cover a single topic. For the four algorithms, nearest-neighbor tables were constructed for the last thirty days, as in the previous experiment. After constructing them, we generated clusters by adding articles day by day. The first results contain the articles in the first day of the thirty day period. The second ones contain the articles the first two days.
The previous experiments proved that using the large threshold, which yielded the cluster number of 25% of all documents, could gather articles related to new topics. Since reducing cluster number makes it easier to comprehend, we also used the large threshold in this experiment.
0 0.2 0.4 0.6 0.8 1
1 6 11 16 0
1 2
F
date F measure
Trend
W-DFIDF
Gradient
Document Frequency
DF
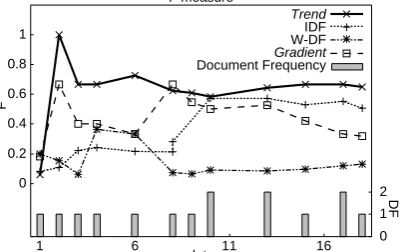
Figure 5: Target Group Detection Performance.
Table 3: Target Group Detection Performance.
date Trend IDF W-DF Gradient
1 0.059 0.083 0.20 0.18
2 1.0 0.11 0.15 0.67
3 0.67 0.22 0.062 0.40
4 0.67 0.24 0.36 0.40
6 0.73 0.22 0.33 0.33
8 0.63 0.21 0.073 0.67
9 0.61 0.28 0.065 0.55
10 0.58 0.57 0.091 0.50
13 0.64 0.57 0.086 0.53
15 0.67 0.53 0.097 0.42 17 0.67 0.55 0.12 0.33 18 0.65 0.51 0.13 0.32
Ave. 0.63 0.44 0.34 0.18
Figure 5 plots F measure day by day. The horizontal axis plots the days since the first article in the target group appeared. The bars are the number of articles in the target group. Data details are shown in Table 3; several dates are missing because the performance was estimated for the dates when the articles in the target group were issued. The bold values indicate the best performance achieved by each algorithm.
performance compared to IDF or W-DF initially, it does not last so long, as also seen in word scores in Figure 4(d).
The experiment proved the performance of our algorithm to detect topics sensitively and follow them over time.
5. Conclusion
This paper introduced a trend-based clustering algorithm for detecting and tracking new topics in online documents. Our algorithm is marked by its word weighting algorithm based on the gradient model, that represents word appearance growth. The clustering process adopts the single linkage algorithm, that offers high speed clustering in a practical time.
The experiments proved that word weights in our algorithm reflect their frequency transitions and that the clustering algorithm can gather related news articles persistently as well as sensitively identify new topics. The performance meets the purpose of detecting new topics effectively and tracking them sustainably for documents increasing hourly.
Our next goal is to optimize the adequate parameters related to attenuation power for different types of documents.
References
Allan, James., Jaime Carbonell, George Doddington, Jonathan Yamron, and Yiming Yang. 1998. Topic Detection and Tracking Pilot Study Final Report, Proceedings of the DARPA Broadcast News Transcription and Understanding Workshop.
Brants, Thorsten., Francine Chen, and Ayman Farahat. 2003. A System for New Event Detection,
Proceedings of SIGIR 2003, the 26th Annual International ACM SIGIR Conference on Research and Development in Information Retrieval.
Dharanipragada, S., M. Franz, J.S. McCarley, S. Roukos, and T. Ward. 1999. Story Segmentation and Topic Detection in the Broadcast News Domain, Proceedings of the DARPA Broadcast News Workshop.
Ishikawa, Yoshiharu., Yibing Chen, and Hiroyuki Kitagawa. 2001. An On-Line Document Clustering Method Based on Forgetting Factors, 5th European Conference on Research and Advanced Technology for Digital Libraries.
Khy, Sophoin., Yoshiharu Ishikawa, and Hiroyuki Kitagawa. 2006. Novelty-based Incremental Document Clustering for On-line Documents, Proceedings of the 22nd International Conference on Data Engineering Workshops.
Papka, Ron., and James Allan. 1998. On-Line New Event Detection using Single Pass Clustering,
UMASS Computer Science Technical Report 98-21.
Walls, Frederick., Hubert Jin, Sreenivasa Sista, and Richard Schwartz. 1999. Topic Detection in Broadcast News, Proceedings of the DARPA Broadcast News Workshop, 193-198.
Yang, Yiming., Tom Pierce, and Jaime Carbonell. 1998. A Study on Retrospective and On-Line Event Detection, Proceedings of the 21st Annual International ACM SIGIR conference on Research and development in information retrieval.