ISSN 2042-2695
CEP Discussion Paper No 1370
September 2015
Academies 2: The New Batch
Andrew Eyles
Stephen Machin
Olmo Silva
Abstract
The English education system has undergone a large restructuring programme through the introduction of academy schools. The most salient feature of these schools is that, despite remaining part of the state sector, they operate with more autonomy than the predecessor schools they replace. Two distinct time periods of academy school introduction have taken place, under the auspices of different governments. The first batch was initiated in the 2002/03 school year by the Labour government of the time and was directly aimed at turning around badly performing schools. The second batch involved a mass academisation process following the change of government in May 2010 and the Academies Act of that year and resulted in increased heterogeneity of new academies. This paper compares the two batches of introduction with the aim of getting a better understanding of their similarities and differences. To do so, we study what types of schools were more likely to change to academy status in the two programmes, and the impact of this change on the quality of new pupil enrolments into the new types of school. Whilst we do point out some similarities, these are the exception rather than the norm. For the most part, our analysis reveals a number of marked dissimilarities between the two programmes in terms of both the characteristics of schools that become academies and the subsequent changes in intakes.
Keywords: Academies, pupil intake JEL codes: I20; I21; I28
This paper was produced as part of the Centre’s Education Programme. The Centre for Economic Performance is financed by the Economic and Social Research Council.
We would like to thank participants at the CEP Education Work-in-Progress seminar for their comments.
Andrew Eyles, Research Assistant at Centre for Economic Performance, London School of Economics and MRes (Economics) student, University College London. Stephen Machin, Department of Economics, University College London and Centre for Economic Performance, London School of Economics. Olmo Silva, London School of Economics and Political Sciences, Centre for Economic Performance and Spatial Economics Research Centre.
Published by
Centre for Economic Performance
London School of Economics and Political Science Houghton Street
London WC2A 2AE
All rights reserved. No part of this publication may be reproduced, stored in a retrieval system or transmitted in any form or by any means without the prior permission in writing of the publisher nor be issued to the public or circulated in any form other than that in which it is published.
Requests for permission to reproduce any article or part of the Working Paper should be sent to the editor at the above address.
1. Introduction
In the past few decades, a feature of the education systems of a number of countries has been the introduction of school reforms operating through the creation of new school types. The best known examples of these are the free schools (“friskolor”) of Sweden, the charter schools in the United States and the academy schools of England. These new school types have mostly been introduced with the justification that the pre-existing education system was not delivering high enough standards for children. Whilst there are notable differences between them (in particular whether they are brand new schools or conversions from existing schools), they all represent movements away from what can be thought of as the traditional, state controlled, local or community school. More specifically, these new schools are typically decentralised from local authority/municipality/school district control, and thus have more operational autonomy.
This paper focuses on the academy schools of England. The introduction of academies, which began in the early 2000s, is turning out to be one of the most radical and encompassing programmes of school reform seen in the recent past amongst advanced countries. Unlike traditional community schools, academies are autonomous, state-funded schools which are managed and run outside of local authority control. In almost all cases, they are conversions of already existing predecessor schools that inherit pupils already enrolled in the school. In essence, academies are school ‘takeovers’ which, because of their nature, enable schools to operate with considerably more autonomy and strategic independence than they did in their predecessor state.1
At present, around 2000 of England's secondary schools (or about 63 percent of schools) and a further 2300 (about 15 percent) of primary schools have become academies.2 Whilst the first academies were introduced in the 2002/03 school year by the Labour Government in power at the time, the vast majority became academies after the change of government in May 2010. The newly elected Conservative-Liberal Democrat Coalition quickly ushered in the 2010 Academies Act, a legislative change that widened the academies’ remit. Prior to the Act, only secondary schools could become academies, and in order to convert they were required to sign up a sponsor. After the Academies Act, there was more heterogeneity as primaries were also
1 They are therefore different from most US charter schools which are typically, though not always, set up from
scratch. A closer comparison to the typical charter school in England would be the free schools which are a recent addition to the education landscape. These are new schools often set up by parent or community groups. Conversely, the closer US comparison to English academies would be ‘in-district’ charters where an already existing public school is converted to a charter as a school takeover. Although these are less commonplace than US charters as a whole, there are places where conversions of public schools to charters have taken place (like Boston and New Orleans – see Abdulkadiroglu et al., 2014).
2 In England, secondary schooling takes place from ages 11-12 to 15-16 (years 7 to 11) and primary from ages 4-5
allowed to become academies, free schools were introduced, and a sponsor was no longer required for conversion to take place.
In fact, the introduction of the act dramatically changed the aim of the programme. While the Labour Government introduced academies as a remedial programme aimed at replacing failing schools, the Coalition Government expanded the programme as part of a project aimed at introducing greater autonomy and competition into the state school sector. While new Labour-type ‘sponsored’ academies have continued to open, most of the expansion of the academy sector has come from ‘converter’ high-performing schools which mainly change their institutional arrangements to acquire more autonomy in terms of budgeting, hiring of staff, pay and working condition negotiations, performance management, taught curriculum, and length of the school day. To put things in perspective, ‘converters’ represent almost 80% of the expansion of the academy sector in the past five years.
This aim of this paper is to compare and contrast the two programmes. Understanding similarities and differences between them is important from both an academic research and a public policy perspective. One reason why this investigation is needed is the continued extrapolation of findings from the first programme to the post-May 2010 conversions, by policymakers, media commentators and – in some cases – academics. The extent to which this extrapolation is valid depends on the extent to which the two programmes are alike.
To uncover similarities and differences between the two regimes, we undertake an empirical study of all academy conversions that took place between the academic years 2002/2003 and 2012/2013, with two particular policy relevant research questions in mind. Firstly, we study the characteristics of schools that convert to an academy. It is well documented that the pre-2010 conversions were under-achieving schools usually serving urban inner-city disadvantaged neighbourhoods. The general perception – as well as the nature of the Coalition Government academy programme – suggests that this is not true for the new batch of academies. In this paper, we present direct empirical evidence of the differences between the two programmes.
The second research focus of interest is on whether academy conversion impacts differentially on the quality of new pupil enrolments into the school. Earlier evidence (Eyles and Machin, 2015; Machin and Vernoit, 2011; Machin and Wilson, 2008; Wilson, 2011) suggests that the Labour academies enrol pupils with higher end of primary school test scores and other advantageous background characteristics (e.g. fewer pupils eligible for free meals) post-conversion. We therefore consider how similar or different this trend has been for the pre- and post-May 2010 academy schools.
To preview our findings, we do find that the programmes are significantly different in terms of the characteristics of the schools converting and in terms of the quality of new enrolments to the school. This clearly shows that the programmes are not prima facie
comparable; therefore, findings from the earlier conversions cannot be meaningfully extrapolated to later conversions. That said, we also highlight some commonalities suggesting that a more careful and nuanced comparison could in some circumstances be undertaken. We discuss this later in more detail, but one clear instance is that a comparison of Labour-type ‘sponsored’ academies in both regimes may be a legitimate comparison to draw. Conversely, any extrapolation from ‘sponsored’ academies to Coalition ‘converters’ would be a distorted comparison likely to lead to biased conclusions.
Our evidence contributes to a small but growing literature on the nature and effects of academy schools. The first round of studies focussed on a small number of early Labour academies and investigated the effect of conversion on pupil achievement at the end of secondary schooling (see Machin and Wilson, 2008; Machin and Vernoit, 2011; Price Waterhouse Coopers, 2008; and National Audit Office, 2010). More recently, Eyles and Machin (2015) conducted a comprehensive causal evaluation of the Labour academies programme studying both intake and performance effects. The authors found significant changes in the ability composition of pupils enrolling at academies after conversion. This result echoes the findings of Wilson (2011). The authors also found significant academy effects on school performance even after accounting for compositional changes. However, no empirical investigation has been undertaken to quantitatively assess the (dis)similarities between the Labour and Coalition Government academies. Our study fills this gap.
Our work also contributes to the literature on the effect of different school types on pupil enrolment and performance. While research on the impact of attending different types of schools is extensive (Neal, 1997; Gibbons and Silva, 2011), there is much less evidence on what happens when the type of school attended by pupils changes. One study closely related to this paper, albeit from an earlier time period, is the analysis of grant-maintained (GM) schools by Clark (2009) in England in the late 1980s-early 1990s.3 Clark documented significant test score improvements, but provided limited evidence on changes in pupil intake.
In the US the growing body of work on charter schools is clearly related to our work because charters have similarities to academies – even though most charters are new schools while academies are not (see Abdulkadiroglu et al, 2011; Hoxby and Murarka, 2009; Angrist et al, 2010; and Dobbie and Fryer, 2011). A smaller number of studies have focused on the less frequently observed event of conversions of already existing schools to charters
(Abdulkadiroglu et al., 2014), or the introduction of practices used in charters to US public schools (Fryer, 2014). Most of these studies analysed the causal effect of charter attendance on students’ performance by exploiting the use of lotteries by oversubscribed schools; therefore, they cannot provide (by construction) evidence on the effect of charter conversion on pupil intake. Finally, the evidence on Swedish free schools is also related to our work (Ahlin, 2003, Björklund et al., 2005, and Sandström and Bergström, 2005) – in particular the work by Bohlmark and Lindahl (2007) who show that free schools tend to enrol pupils from better off families and affect the composition of pupils in public sector schools.
Although the background of the academy policy is unique and different from both the US charter movement and the Swedish free school programme, we believe our work sheds light on related issues about school reform that are of general interest. Firstly, we provide evidence on how the characteristics of pupils and schools change as the impetus of the programme changes from addressing underperformance to providing more autonomy to all schools. Secondly, we
provide such evidence in a setting where expansion of a more autonomous school sector has not happened at the margin – but has taken centre stage and become a reality for more than 60% of secondary schools over a five-year period. These features make the on-going English academy reform a truly exceptional experiment in terms of its scale and celerity. Given the growing trend away from traditional schooling and towards more decentralised and autonomous systems with school accountability, our work holds relevant lessons for academics and policy makers alike.
The remainder of the paper is structured as follows. In the next section, we discuss the institutional context and the data we use in our empirical analysis. In Section 3 we spell out in more detail the methods that we use. Section 4 presents our results on the association between school characteristics and the probability of converting to academy, while Section 5 discusses our results on changes in pupil intake. Finally, Section 6 provides conclusions.
2. Institutional Context and Data
2.1 The English school system
Compulsory education in England is organised into Key Stages (KS) that stretch over the course of primary and secondary education. In terms of primary schooling, pupils enter school at age 4-5. This is known as the Foundation Stage. They then move on to KS1 (up until age 6-7), before finishing at KS2. The latter covers the last three years of primary schooling (ages 7-8 to 10-11), and ends with the externally-marked KS2 standardized national tests (SATs) where proficiency in English, Mathematics and Science is assessed.
Secondary schooling covers ages 11-12 through to ages 15-16 and is divided into KS3 (up to age 13-14) and KS4 (ages 14-15 and 15-16), which marks the end of compulsory education. At the end of KS4, pupils sit externally-marked academic (GCSEs) and/or vocational (NVQ/BTEC) tests in a range of subjects, although, English, Mathematics and Science are compulsory for every student at this stage. In our analysis, we focus on secondary schooling where the majority of conversions to academies has taken place.
For each of the Key Stages the central government sets learning targets (levels) and runs a national curriculum. Average attainment within a school at the various Key Stages as well as measures of school value added are published alongside other school characteristics (such as size and composition) in annual performance tables. These are highly salient in the education and policy debate and the media. They are also routinely used by parents to inform their school choice.
The principle of ‘free choice’ guides parental applications to schools and admissions practices at both the primary and the secondary phase. However, parental freedom to choose is limited when school are over-subscribed. When this occurs, various admissions criteria are used to prioritise students, usually favouring those who live nearby, those with special educational needs or in care of the Local Authority (LA), and those with siblings in the school. Religious schools can prioritise students according to their faith, while a small proportion of secondary schools select on admission tests (Grammar schools).
The institutional arrangements of secondary schools determine more precisely whether the school, as opposed to the LA, holds responsibility for admissions and the margin of freedom the school enjoys over taught curriculum, personnel management and strategic decision making. Secondary schools can take one of the following alternative structures: community schools, voluntary-controlled (VC) schools, foundation schools, voluntary-aided (VA) schools, city technology colleges (CTCs) and, since their introduction in the early 2000s, academy schools.4 Although academies are the focus of our work, we briefly discuss the structures of other school types for comparison.
Community and VC schools are mainly managed by the LA and by a governing body predominantly composed of members of staff and LA representatives. Since the majority of VC schools are religiously denominated, their governing body also includes members of the foundation supporting the school. Responsibility for recruiting, human resources decisions and admissions is in the hands of the LEA. As a result, these schools are characterised by very little autonomy.
VA and foundation schools are similarly structured – even though voluntary aided schools are mainly religiously denominated, while foundation schools are not. These two types of school are run as partnerships between the state and voluntary sector, and their associated foundations have a significant representation on their governing bodies. These institutional arrangements grant VA and foundation schools more autonomy than community and VC institutions.
Similarly, CTCs enjoy relative autonomy from the LA. In particular, the majority of their governing body is filled with representatives of the sponsor – usually a business or voluntary group – and the school has control over staffing and admission decisions. However, CTCs follow the national teaching curriculum and are characterised by a strong emphasis on technological, scientific and practical subjects.
Lastly, academy schools enjoy a much larger degree of autonomy than any of the other school types in the state system. Academies were gradually introduced by the Labour Government starting from September 2002 with the aim of replacing failing schools. In essence, the Labour Government designed the programme as a targeted intervention aimed at addressing underperformance by changing organizational structure, providing schools with more autonomy and linking schools to Government-approved sponsors enlisted to drive educational improvements. Indeed, sponsors – usually educational charities or business groups – were seen as crucial in bringing to schools a more entrepreneurial ‘ethos’.
The election of the Conservative-Liberal Democrat Coalition Government in May 2010 dramatically changed the aims of the programme. The Academies Act of June 2010 allowed as many schools as possible – including primaries – to ‘convert’ to academies and removed the requirement that would-be academies had to find a sponsor. Although a number of new Labour-type ‘sponsored’ academies have opened since, approximately 80% of the expansion of the academy sector has happened through Coalition-type ‘converters’.
Importantly, in the new regime, greater emphasis is put on the voluntary process of conversion to academy status. This is in marked contrast with the process characterising ‘sponsored’ academies – where institutional change was imposed onto schools as a remedial tool. All that is required from would-be ‘converts’ is that they discuss the possibility of converting with parents, members of staff and pupils, and obtain consent from the foundation or religious body backing the school (if any). They must then register their intention to apply with the Department for Education (DfE) and send in information about school attainment, pupil progress and school finances for the past three years, before finally providing the most recent school report prepared by the school inspectorate (OFSTED).
The latter is a key determinant of approval for conversion. OFSTED visits schools every three to five years (although this frequency depends on school performance, with poor
performers visited more regularly) and inspections result in publicly available reports rating schools from ‘Outstanding’ to ‘Inadequate’ on their overall quality as well as on specific aspects such as teaching, management and pupil behaviour.5 Schools with ‘Outstanding’ overall rating (and more recently schools with ‘Good, with Outstanding Features’ rating) are fast-tracked and pre-approved for conversion by the DfE. Broadly speaking, the process of (voluntary) conversion can take between three and five months, though the time lapse can expand and the exact timing depends on specific aspects of the proposed conversion and the volume of new applications.
Despite these differences, both ‘sponsored’ and ‘converter’ academies enjoy similarly wide margins of autonomy. Although they remain part of the state sector, they broadly fall outside the control of the LA in terms of key strategic decisions and day-to-day management. This is administered by the head-teacher and a self-appointed board of governors with a limited number of representatives from the LA. This body has responsibility for hiring the staff, negotiating pay and working conditions, and deciding on matters such as career development, discipline and performance management. Furthermore, academies enjoy more autonomy in terms of the majority of the taught curriculum (except for English, Maths, Science and IT where they have to follow the national curriculum), as well as of the structure and length of the school day.
2.2 Data construction and sample selection
The main data source used in our analysis is the National Pupil Database (NPD). The NPD is obtained by linking several centrally-gathered datasets that collect census-type information on the characteristics of all pupils in primary and secondary state education, their achievements at the various Key Stages, and the characteristics of the schools they attend. These databases are used by the DfE to assess schools’ performance and funding needs – mainly linked to the number of pupils on roll and measures of their disadvantage. The information they store is highly reliable and the datasets contain very few missing observations.
A core element of the NPD is the Pupil Level Annual Census data (PLASC) which contains information on the characteristics of pupils – such as gender, eligibility for free school meals (a proxy for low parental income), ethnic background and special education needs status – as well as the identity of the school attended in every year of their schooling (and not just at the time when they sit for a Key Stage assessment). This is a crucial piece of information since it allows us to identify the school where pupils start their secondary education and evaluate any effect of academy conversion on pupil intake characteristics. PLASC has been collected three times per year (January, May and September) from the 2001/02 school year onwards. In our analysis, we 5 More details on OFSTED, its inspections and the possible outcomes are provided in Eyles and Machin (2015).
only use the January collection because this contains all relevant pupil level information and is the most consistently available over time.
For our analysis, we also gather data on pupils’ KS2 and KS4 attainments. For KS2, we focus on test scores across the three compulsory subjects assessed at this stage – namely, English, Maths and Science. Test scores in Science span the 0-80 range (coming from the sum of two separate papers each marked out of 40), while the English and Maths tests are marked out of 100 (both composed of the sum of two separate test scores, each marked out of 50). We use KS2 test scores averaged across the three subjects. At KS4, we consider attainments in both the more academic GCSE (General Certificate of Secondary Education) and the more vocationally-oriented GNVQs and BTECs. GCSEs are graded A*-G and the current points score calculations give an A* a score of 58 and a G a score of 16 with grades in between going up in increments of 6. GNVQ/BTEC subjects are instead graded as a combination of GCSE grades and often worth multiple GCSEs. After converting GNVQ/BTEC attainments to a GCSE-comparable scale and making scores consistent over time6, we construct our measure of KS4 attainment by summing the grades obtained in the best eight qualifications. Capping qualifications at the best eight allows us to deal with the possibility that pupils entering many exams – but performing poorly on all of them – would still appear to do well. However, this restriction is inconsequential for our results.
Finally, the NPD also collects information at the school level – in particular data on school types and institutional arrangements – through the Annual School Census and Edubase. We use these data in conjunction with files provided by the DfE, which give information on all academies that have opened (or are in the process of doing so), to identify schools that become academies, their time and mode of conversion (‘sponsored’ or ‘converter’ route), and the predecessor school that underwent transformation.
We use this information to construct two datasets. The first one is a school-level panel covering the period spanning the school years 2001/2002 to 2012/2013. We use this dataset to study which school characteristics are associated with conversion to academy and investigate whether these associations change from the Labour Government years to the Coalition Government period. For our analysis, we only retain secondary schools that cover the whole of the Key Stage 3 and Key Stage 4 phases (age 11-12 to age 15-16); therefore, we drop middle schools (which stop at or before Key Stage 3) and upper secondary schools (which start after age 11-12). This restriction is motivated by the fact that our goal is to analyse the link between academy conversion and school characteristics – in particular the KS4/KS2 attainments of the predecessor school and average KS2 attainments of the intake at the school. Middle/upper 6 More details can be found in the Data Appendix of Eyles and Machin (2015).
secondary schools do not have the complete set of information we plan to use. We also drop a very small number of ‘anomalous’ cases. These include: (i) two schools that, for unexplained
reasons, convert to academies later than expected. These are dropped because we would not be able to precisely align the timing of conversion with the characteristics of the school pre-conversion; and (ii) three schools each splitting from one predecessor into more than one
academy. These are dropped as it would be hard to link conversion to changes in intake in the newly formed academies relative to the one single pre-existing school. On the other hand, we keep a number of predecessor schools that merge into a single academy. In this case, we construct an artificial predecessor school by averaging across the characteristics of the different predecessors (averages are weighted by the number of pupils on roll at each school). Finally, we distinguish between schools that we can observe across all eleven years and those we cannot. We label these ‘balanced panel’/‘unbalanced panel’ schools, respectively.
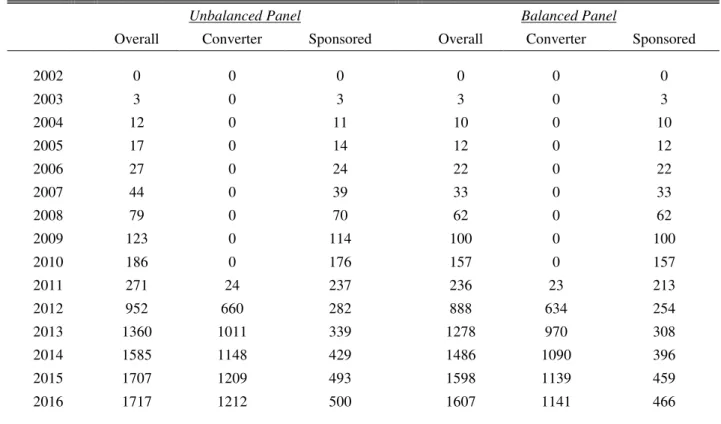
Table 1 reports the cumulative number of open academies in our sample over the years covered by our investigation.7 Overall, academies went from representing just a few exceptional cases in the early 2000s to covering more than half of secondary schools (Column 1). There are, of course, no ‘converters’ prior to the school year 2010/2011 (Column 2). Interestingly, the table shows that most of the academy sector expansion between 2010/2011 and 2012/2013 occurred through the ‘converter’ route. The number of ‘sponsored’ academies in our sample almost doubled – from 176 to 339 (Column 3). However, ‘converters’ went from zero in 2009/2010 to more than a thousand three years later. This represent about 80% of the overall expansion of the academy sector in this period. These patterns remain when we consider only schools in the balanced panel (as shown in Columns 4 to 6).
Although our analysis only covers the period up to the school year 2012/2013, we also collect information on schools that convert in 2013/2014, 2014/2015 and 2015/2016. We use data published by the DfE in March 2015 to track academies already opened and/or planning to open soon after. As a result, we understate the number of academies that will start operating in the academic year 2015/2016. Despite this limitation, the figures for these last three school years continue to show that the expansion of the academic sector is mainly occurring through ‘conversions’. Nevertheless, a number of Labour-type ‘sponsored’ academies have continued to open during the Coalition Government period.
The second dataset that we construct is a pupil-level database that assigns pupils to the school they attend at the beginning of secondary school (when children are age 11-12 and right 7 Note that these numbers do not precisely match the official statistics published by the DfE because of the
restrictions we impose on our data (mainly the fact that we do not consider middle/upper secondaries). However, our data reproduces the main national trends in terms of sector expansion and the relative importance of ‘sponsored’ and ‘converter’ academies.
after the KS2 exams). We use this dataset to study whether schools converting to an academy change their pupil intake post-conversion. For most of our analysis, we only consider schools that convert to academies during the Coalition Government years – that is from the academic year 2010/2011 to present. This is because Wilson (2011) and Eyles and Machin (2015) have already presented evidence on the impact of Labour’s academies on pupil intake, reporting positive effects. However, in some cases, we provide complementary evidence for the Labour years. Note also that we apply the same restrictions as in the school-level dataset, and drop middle/upper secondary schools and anomalous conversions.
Importantly, we only consider the following sets of pupils: (i) pupils enrolled at academies
that open between 2010/2011 and 2012/2013 in the time-window covering six school years prior to conversion and up to two school years after conversion; and (ii) pupils enrolled at academies
that will open between 2013/2014 and 2015/2016 in the time window going from six school years to one school year prior to conversion. These restrictions are applied so that our analysis of the effect of academy conversion on pupil intake composition compares the changes in the composition of actual academies (pre- and post-conversion) to changes in the composition of future academies. The use of future academies as a comparison group reduces the extent to
which compositional changes caused by academy conversion are conflated with natural year-on year variation in KS2 scores. As well as this, it allows us to net out unobservable school-level characteristics, such as the ‘ethos’ of academy status, from our estimates. We return to this issue in the next section, where we discuss our empirical methods.
3. Empirical methods
3.1 Research design I – School characteristics and academy conversion
In the first part of our analysis, we investigate which characteristics predict academy conversion and whether the association between these characteristics and academy status changes between the Labour and the Coalition Government periods.
In order to do so, we estimate the following linear probability model for school s in year t: = + , × ≤ 2010 + , × > 2010 + , + , + + (1) where is a dummy variable coded equal to zero when school s is not an academy, one in the
school year in which school s starts operating as an academy, and missing after that point, ,
is a set of school attributes measured in the school year prior to the conversion, ≤ 2010 is a binary indicator taking value one for observations up to the school year 2009/2010 (and zero otherwise) identifying the ‘Labour Years’, > 2010 is a binary indicator taking value one for observations from the school year 2010/2011 onwards (and zero otherwise) identifying the
‘Coalition Years’, and , is a set of dummies characterising the institutional type of the predecessor schools (e.g. community or voluntary controlled - see Section 2.1). , is a set of dummies denoting the Local Authority in which the predecessor school is located (as well as the academy - there are no cross-LA relocations) and are school-year dummies. Finally, is an error term which we assume to be uncorrelated with all other observable characteristics in the model. However, we allow for a degree of autocorrelation in the residuals within schools over time, and cluster standard errors at the school level.
The parameters of interest are and which capture the associations between school characteristics and the probability of conversion in the ‘Labour Years’ and ‘Coalition Years’, respectively. The differences between these coefficients (and their statistical significance) are key to this paper since they allow us to test the notion that the nature of academies has changed since the Academies Act of 2010.8
The way in which we have specified the dependent variable makes our analysis similar to a transition model in which schools are ‘at risk’ of becoming academies. This allows us to isolate the effect of school characteristics at time t-1 on the probability of conversion at time t – without
confounding this estimate with the effect of these characteristics on the probability of being an academy from time t onwards (i.e. survival). Since academies do not convert back to
non-academy status, the observations after conversion has occurred do not add any useful element of variation to our analysis and are essentially disregarded (by coding our dependent variable as missing).
In our analysis, we are also interested in analysing whether the association between school characteristics and academy status changes for different types of academies. For example, during the Coalition Government years we observer schools becoming ‘converter’ (Coalition-type) as well as ‘sponsored’ (Labour-(Coalition-type) academies. Moreover, both type of academies can be ‘stand-alone’ or be part of a ‘chain’ – i.e. belong to a group working together under a shared structure and jointly administered by an Academy Trust.
To test for these differences, we estimate the following model:
!" = + , # + , + , + + (2)
where (2) redefines the dependent variable to take value one only for academy transitions into a specific subgroup – for example only ‘chain academies’ – and taking values zero or missing as
8 These differences can be estimated by changing our specification to have a set of main effects for each school
characteristic (e.g. by dropping the interaction between school characteristics and the variable) and only one set of interactions (e.g. the interaction between the and the school characteristics). In this case, the coefficients on the interactions capture the change in the association between school characteristics and the likelihood of conversion to academy across the two periods.
previously discussed. In order to test whether the effect of school characteristics on the probability of becoming an academy are significantly different across subgroups, we set the problem up as a seemingly unrelated equation system so that our tests for the differences in the # parameters take into account the joint variance/covariance structure of the error terms across equations.
3.2 Key descriptive statistics: School-level data
Table 2.a presents descriptive statistics of the main variables that we use in our school-level analysis. The dependent variable ‘Academy’ takes a mean value of 0.041 across the period, although this figure varies substantially from the Labour years (0.007) to the Coalition years (0.161). This marked difference is due to the fact that many more academies opened since 2010/2011. The figures for the school characteristics we consider (measured in the school year prior to conversion) reveal that our set of schools is broadly representative of secondary schools in England. Approximately 16% of the pupils are eligible for free meals and nearly 80% are of White ethnic origin. KS2 attainment of pupils aged 11-12 in their first year of secondary school has a mean value of approximately 64, while KS4 scores of pupils aged 15-16 are, on average, just above 315. In terms of OFSTED inspections, the most recurrent grade is ‘Grade 2’ (Good) at around 43-44%. Many schools achieve ‘Grade 1’ (Outstanding; 21%) and Grade 3 (Satisfactory; 30%). Only 4.5-5% receive a low ‘Grade 4’ evaluation (Unsatisfactory and necessitating improvements). Approximately 60% of all predecessors schools are either community (57.5%) or VC schools (2.7%) which have little autonomy prior to becoming academies. Note that there are no noticeable differences between the unbalanced and unbalanced panel schools.
3.3 Research design II – Academy conversion and school intake
In the second part of our analysis, we investigate whether schools converting to academy change their pupil intake following conversion. In order to do so, we use pupil-level data (described in Section 2.2) and estimate the following model:
$% = + + &× ' ≥ = ) + *% (3)
where $% denotes the background of pupil i (aged 11-12) starting secondary school s in school
year t, and denote school and time fixed effects respectively, denotes whether the
school becomes an academy at some point during the observation window, and ' ≥ = ) is an indicator variable taking value one for all school years in which the school is operating as an academy – that is at or after conversion c has taken place. Finally, *% is an error term which we
degree of autocorrelation in the residuals of pupils in the same school and over years, and cluster standard errors at the school level.
The main coefficient of interest is & which captures the effect of academy conversion on intake. One concern with our specification is that it only controls for time-fixed school unobservables; however, schools that become/do not become academies could differ along other unobservable dimensions that might be time varying and/or time trending. In order to mitigate this problem, we only estimate the model in Equation (3) using observations from the following subset of pupils (already discussed in Section 2.2): firstly, pupils enrolled at schools that become academies between 2010/2011 and 2012/2013 and in the time-window covering six school years prior to conversion and up to two school years after conversion; secondly, pupils
enrolled at schools that will become academies between 2013/2014 and 2015/2016 and in the time window going from six school years to one school year prior to conversion. This approach basically compares the evolution of the intake at schools that actually open as academies during
our observation period (pre- and post- conversion) to the evolution of the intake at schools that
will open as academies in the near future. Identification rests on the assumption that the two
groups of schools are on similar trends and share similar (possibly time-varying) unobservables, and that the timing of the actual opening is ‘as good as random’. We discuss the validity of this assumption when we present our findings.
The empirical model in Equation (3) imposes an average effect of academy conversion on intake quality that is constant across all post-conversion years. To relax this assumption, we estimate the following flexible event study specification where we allow for separate ‘academy effects’ in the different school years post- and pre- conversion:
$% = + + + &, × ' = -,./01
,./ 2
+ *% (4)
where the expression ' = - denotes a set of indicators that separately identify the school years prior to conversion year ) (from ) − 5 to ) − 1; with ) − 6 being the excluded baseline year) and at/after conversion (from ) to ) + 2), and &, capture the effect of academy status on intake in that specific year. Note that estimates of &, for the years prior to conversion allow us to determine whether actual converters (the ‘treated’ schools) differ from future converters (the
‘control’ schools) in the years leading up to the ‘switch’ to academy. This helps us assessing the assumptions that treated and control schools have similar (possibly time varying/trending) unobservables prior to conversion, and that the timing of conversion is random.
As for the school-level analysis of the determinants of conversion, we are also interested in understanding whether the effects on intake are heterogeneous for different types of academies.
In particular, we are interested in disentangling whether ‘Sponsored’ and ‘Converter’ academies change their intake after conversion in different ways, and whether ‘Stand-alone’ vs. ‘Chain’ academies affect their intake differently. In order to do so, we interact the variable )67-89 in Equation (3) above with an indicator denoting whether the academy belong to ones of these groups. Finally, in some extensions, we also investigate whether the impact of academies on intake differ depending on the institutional type of the predecessor school (mainly ‘community’ schools as opposed to all other institutional arrangements).
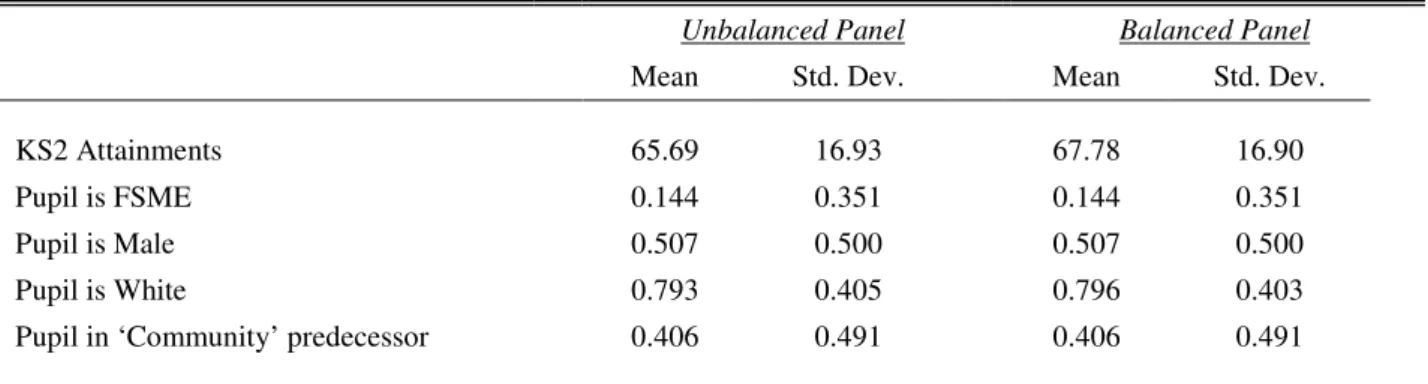
3.4 Key descriptive statistics: pupil-level data
In Table 2.b we present descriptive statistics on the characteristics of pupils in the estimation sample. These are the variables we use to characterise pupils’ background (i.e. the variables $6):;<=>?7% in Equations 3 and 4). KS2 attainment of pupils when they enter secondary school (aged 11-12) are on average 66-68 points – 3 to 4 points above the corresponding figure in the school level panel. This discrepancy is explained by the fact that the pupil level data only focuses on more recent cohorts and KS2 scores have been rising over time. The percentage of pupils eligible for free meals (at 14%) is close to the figure found at the school level, as is the percentage of pupils with White ethnic origins (at 79%). Finally, approximately 41% of the pupils are in schools that were ‘community’ prior to conversion. This figure is lower than the share of community schools in the school level panel (at 57%). This is due to the fact that the pupil level sample only includes actual and future academies, and school types other than ‘community’ are more likely to convert during the Coalition period.
4. The changing characteristics of academies
4.1 Preliminary graphical evidence
We present our first set of results graphically in Figure 1. The four plots display the mean academy percentile in the non-academy distribution of school characteristics in the year prior to conversion for the following four attributes: KS4 attainment (top left panel), KS2 attainment (top right panel), percentage of pupils eligible for free school meals (FSM, bottom left panel), and percentage of pupils with White ethnic background (bottom right panel). The figure also reports the mean percentile for academies that convert during the Labour Government years and the mean percentile for the Coalition Government years. The approach we take in Figure 1 is an adaptation of the methods used in Juhn et al. (1993) and is structured to highlight changes in the characteristics of converting schools, before and after the Academies Act of June 2010, in a descriptive and intuitive way.
The top two panels provide fairly sharp evidence of these changes: the KS4 and KS2 percentiles of schools that convert during the Labour period (measured up to 2009 for conversions up to 2010) are substantially lower than those for the Coalition period. The average Labour academy KS4 percentile is 15, whereas the KS2 percentile is 17. These numbers are clearly pulled up by the 2005 data point (referring to ten academies converting in 2006). Excluding this year, the figures for the KS4 and KS2 average percentile fall to 11 and 12 respectively. This finding is not surprising: Labour ‘sponsored’ academies were among the worst performing schools and academisation was seen as a way to improve standards. In sharp contrast, the average KS4 and KS2 percentiles for the years following the election of the Coalition Government are at or above the median. Strikingly, in the first full school year after the Academies Act of June 2010 (that is for conversions in the school year 2010/2011 with characteristics measured in 2009/2010), academies’ average percentiles are around 80 for both KS2 and KS4.
In the bottom two panels of the figure, we investigate whether similar changes can be detected in the school composition in terms of pupils’ eligibility for FSM and ethnic background. The left panel shows that, during the Labour years, the average percentile for FSM eligibility was close to 90. This finding is also not surprising: Labour academies were among the most disadvantaged inner city schools, serving very deprived communities. This pattern changes substantially during the Coalition period. The average percentile falls to 57 and the drop is substantially more pronounced (down to 33) if we focus on the first full school year after the Academies Act of June 2010. Interestingly, the bottom right panel shows that changes in the percentage of FSM eligible pupils (and in Key Stage attainments) are not mirrored by changes in the ethnic composition of schools that convert. The average percentile in the distribution of the percentage of pupils with White ethnic background goes from 20 (Labour period) to 33 (Coalition period). This change is clearly less pronounced than for the other three characteristics.
4.2 Main regression analysis
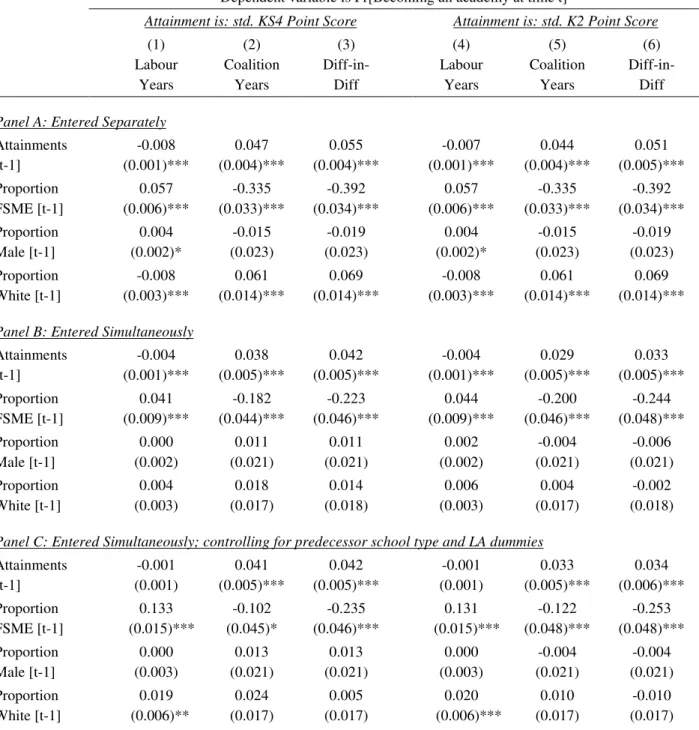
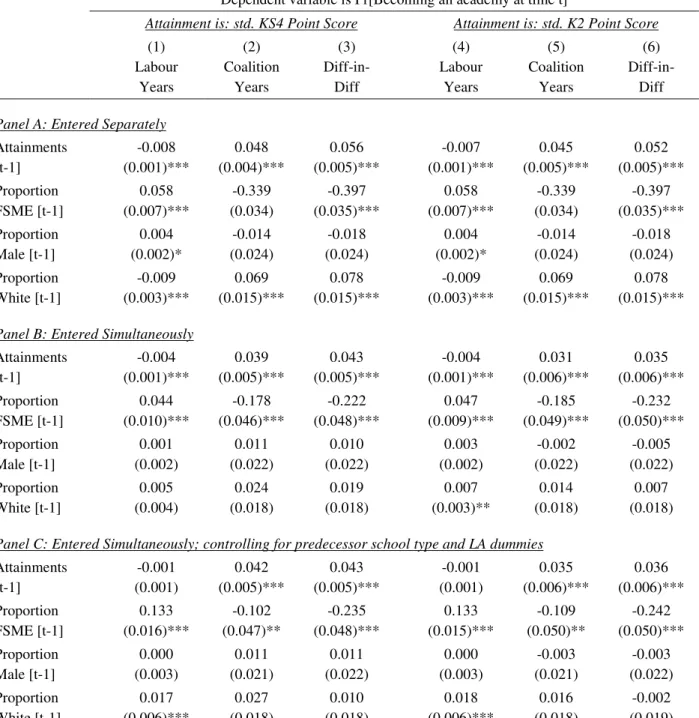
In this section, we provide more formal evidence on the changes in the nature of academies by estimating the model laid out in Equation (1) in Section 3.1. Our estimates are presented in Tables 3 and 4, where we focus on schools in the unbalanced and balanced panels, respectively. The two tables have the same structure: in the top panel, we consider the effect of school characteristics (measured at time t-1) individually on the probability of conversion (at time t); in
the central panel, we consider all these characteristics simultaneously by including them in our specification; finally, the bottom panel considers all characteristics simultaneously and controls
for the LA where the school is located and the institutional type of the predecessor school. Columns (1) and (4) present the effect of school characteristics on conversion in the Labour years, while Columns (2) and (5) present estimates for the Coalition period, and Columns (3) and (6) tabulate the difference between the effects for the Labour and Coalition periods. The first three columns use average KS4 test scores as a measure of attainment, whereas the last three columns use average KS2 test scores. Note that all variables have been standardized so that the coefficients display the effect of a one standard deviation change in the characteristics on the probability of conversion.
Starting with the top panel, our results show that during the Labour years lower KS2 and KS4 attainments, a higher share of FSM pupils and a lower share of White pupils were all positively and significantly associated with probability of conversion. This pattern is completely reversed during the Coalition years: higher KS4 and KS2 attainment, a lower percentage of FSM pupils and a higher incidence of White students are strongly associated with the probability of becoming an academy. As shown in Columns (3) and (6), the differences in these associations are both striking – the coefficients push in opposing directions – and highly significant. These results hold irrespective of whether we consider the unbalanced or balanced panel of schools. As for the percentage of male pupils in the school, we find that this is not strongly associated with academisation during either period, and its effect does not change significantly across the Labour and Coalition years.
In Panel B, we test the robustness of these effects by including all characteristics simultaneously. We still find that lower KS2 and KS4 attainments are strongly associated with the probability of becoming an academy during the Labour year, but the opposite is true during the Coalition period. We also find that the difference between these effects is highly significant. Furthermore, a higher share of disadvantaged pupils from poor family background (i.e. those eligible for FSM) has a positive and significant association with conversion to academy during the Labour period, but a negative and significant association during the Coalition years. Once again, the difference in these estimates is sizeable and significant. These patterns hold irrespective of whether we use the balanced or unbalanced panel. Once we take into account attainment and eligibility for FSM, the share of pupils with White ethnic background is no longer associated with the probability of academisation, neither before nor after 2010. We still find no evidence of a significant association between the percentage of males in the school and conversion to academy.
Finally, in Panel C, we control for the institutional type of the predecessor schools and for the LA where the school is located. Despite a reduction in the precision of some of our estimates, our key findings still hold in Tables 3 and 4. Coalition academies are significantly
more likely to have high KS2 and KS4 attainment prior to conversion than Labour academies. They also have significantly lower percentages of FSM pupils in the year before becoming academies than their Labour counterparts. In short, they are better performing schools enrolling pupils from more advantageous backgrounds. The last row of the table shows that a higher incidence of White pupils is now positively associated with conversion to academy during the Labour years. Since this specification controls for LA effects, this association could be driven by the fact that the first batch of Labour academies took place in inner cities where a higher incidence of White students is linked with disadvantage and economic hardship. This association is instead not significant for the Coalition period, nor is the difference between the coefficients across the two periods. Since the pattern of the estimates we find for the school’s ethnic composition switches signs when moving from the top to the bottom panel (and is insignificant in the central panel) we prefer not to attach too much significance to this estimate and avoid (over-)interpreting in the rest of the paper.
How sizeable are the effects we have documented? To answer this question we use the estimates of Panel B of Table 4. Starting with attainments, a one standard deviation increase in test scores corresponds to a 57% (= 0.004/0.007) decrease in the probability of becoming an academy during the Labour years. Conversely, a one standard deviation change in either KS2 or KS4 test scores would increase the probability of becoming an academy during the Coalition period by 20-24%. Stated differently, a school one standard deviation below average KS4 attainments (approximately at the bottom 15th percentile assuming KS4 scores follow a Normal distribution) would be 57% more likely to become an academy during the Labour years, but 24% less likely to do so during the Coalition period. Note also that the estimates capturing the change in the effect of attainments on the probability of becoming an academy are fairly constant at 4.3 percentage points for KS4, and 3.5 percentage points for KS2 (once we include all school characteristics at the same time). This is independent of whether we consider the balanced or unbalanced panel, and irrespective of whether we control for LA and predecessor type dummies. This means that a one standard deviation change in attainment would have pushed schools in opposing directions by around 3-4 percentage points before and after the Academies Act of 2010. Scaled against an average probability of conversion over the whole period of 4.1%, this is a truly sizeable change.
In order to assess the magnitude of the effect of the percentage of pupils eligible for FSM at the school we consider a 10% change from the mean of 15.6% (rather than using a one standard deviation change which would represent an 83% change in the mean). This corresponds to approximately 12% of a standard deviation change. During the Labour years, an increase in the percentage of FSM eligible pupils of this magnitude would have corresponded to a 75% increase
in the probability of becoming an academy. Conversely, during the Coalition years this same increase would have reduced the probability of conversion by 13%. Once again, the change in the association between the percentage of FSM students and the probability of becoming and academy pre/post 2010 is fairly stable across specifications at -0.22, or 2.7 percentage points for a 10% change. Benchmarked against the average probability of conversion across all year (of 0.041), the change in the direction of the effect of this variable is also very substantial.
4.3 Further results
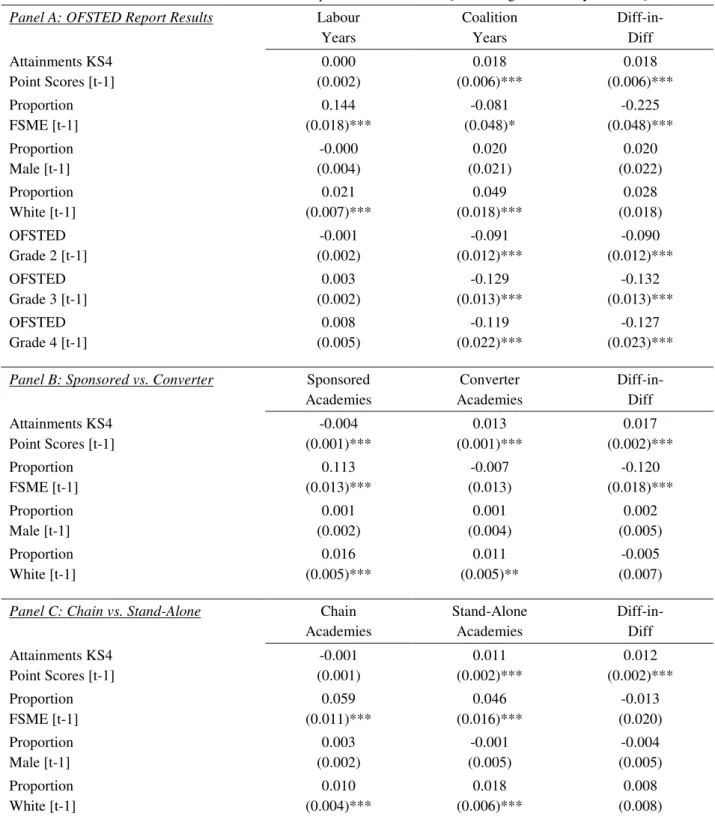
In Table 5, we present additional results on the changing characteristics of academies. All regressions enter school characteristics simultaneously and control for both LA dummies and predecessor school type.9
Panel A repeats the analysis of Table 4, but adds dummies capturing the results of the last OFSTED inspection prior to conversion. The omitted category is ‘Grade 1’ (Outstanding). Note that since we are not able to collect consistent OFSTED data for the late 1990s and early 2000s, we lose some schools for which we are unable to gather inspection results pre-conversion. The results show that during the Labour years schools with lower inspection results – in particular Grade 4 schools – were more likely to become academies, even though the point estimates are statistically insignificant. However, this finding is completely reversed during the Coalition years: the three coefficients on the dummies for the OFSTED inspection results are negative and significant. The last column confirms that the changes in these associations pre- and post-2010 are statistically significant and sizeable, in particular for Grade 3 (Satisfactory) and Grade 4 (Unsatisfactory). We also find that controlling for OFSTED inspections does not affect the change in the association between the percentage of FSM eligible pupils and academy conversion. However, the changes in the association between academy and KS4 test scores are reduced – although they remain sizeable and significant. This is not surprising since OFSTED inspections incorporate an assessment about the quality of teaching which should translate into higher KS4 attainment (at least in as much as these do not solely capture family background and pupils’ own ability, as opposed to school effectiveness).
In Panel B of the table we investigate whether the changes in the associations between the Labour years and the Coalition years (Table 3 and 4) completely reflect the differences between ‘sponsored’ and ‘converter’ academies. We find that the patterns in the coefficients very closely resemble our previous findings: the association between KS4 attainment is negative and significant for ‘sponsored’ academies, but becomes positive and significant for ‘converters’. On the other hand, the association between the share of FSM eligible pupils and ‘sponsored’
academies is positive and significant, but becomes negative (though insignificant) for ‘converters’. Once again, we find that for both variables the change in these associations is significant. Note also that rescaled against the probability of converting through a ‘sponsored’ or a ‘converter’ route the magnitudes of the associations presented in Panel B are similar to those displayed in Tables 3 and 4. Furthermore, the associations between KS4 test scores/the percentage of FSM eligible pupils and the probability of becoming a ‘sponsored’ academy are fairly stable if we estimate them separately for the years up to and after 2010. In short, most of the Labour years vs. Coalition years dichotomy documented above can be explained by the differences between schools that become academies via the two alternative routes.
Lastly, in Panel C we investigate whether the association between school characteristics and conversion differs for academies that belong to chains and those that are instead stand-alone. We find that stand-alone academies have significantly higher KS4 test scores in the year prior to conversion than academies in chains. However, the size of the difference in this association is reduced relative to what we found before. Furthermore, we find that chain academies are not significantly less likely to have a higher fraction of FSM eligible pupils prior to conversion than stand-alone academies. Although the point estimate on the percentage of pupils eligible for FSM is higher for school that convert to chain academies (at 0.059) than for stand-alone ones (at 0.046), the two coefficients are not statistically different. Finally, we do not find any significantly different association between the share of males and the share of pupils with White ethnic background and the probability of becoming a chain academy as opposed to a stand-alone one. This reinforces our previous conclusion that the interesting margin is between the Labour and Coalition years, and that this margin tends to closely match the ‘sponsored’ vs. ‘converter’ dichotomy.
5. Academies and changes in intake composition
5.1 Main regression analysis
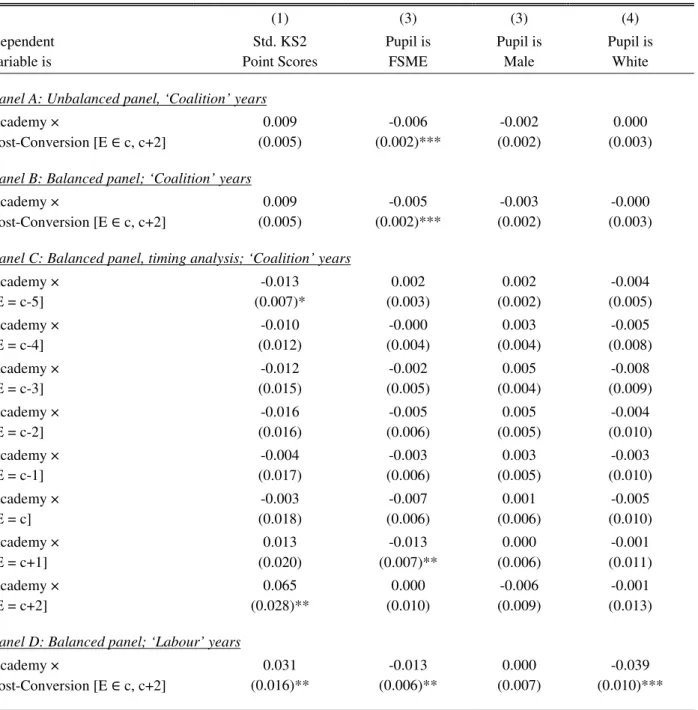
Table 6 presents our first set of results on changes in intake composition. This comes from estimates of the empirical models in Equations (3) and (4) in Section 3.2. The four different columns look at different aspects of a school’s intake composition: Column (1) focuses on the (standardized) KS2 test scores of pupils, Column (2) instead focuses on whether the student is eligible for FSM or not; lastly, Columns (3) and (4) investigate the effect of academisation on the probability that enrolled pupils are male or are of White ethnic origin.
Panel A and Panel B reports estimates of the average effect of conversion during the Coalition years on intake using pupils in the unbalanced and balanced panel of schools,
respectively. The results in Column (1) show that becoming an academy during the Coalition period does not lead to changes in the KS2 of enrolled pupils. Recall that KS2 tests are taken at the end of primary schools (i.e. they are a measure of prior ability) and that we are considering the school where pupils start their secondary education. Our findings therefore suggest that Coalition academies do not change their composition in terms of students’ ability. Column (2) shows that after conversion the Coalition-year academies attract pupils who are less likely to be eligible for FSM. This effect is precisely estimated and corresponds to approximately a 4% reduction in the probability that an FSM eligible pupil is enrolled at an academy. Columns (3) and (4) show that academies do not change their composition in terms of gender and ethnic background after conversion.
In Panel C, we shed some light on the time profile of these effects. To do so, we estimate the model laid out in Equation (4) in Section 3.2. Column (1) shows a positive and significant effect on pupils’ KS2 attainment two years after conversion (at 6.5% of a standard deviation). However, we find no effect at the time of conversion (-0.003) and a small but insignificant effect one year after (at 0.013). It is interesting to note that the coefficients on the years leading up to the time of conversion are small and insignificant (with the exception of c-5) suggesting
that actual academies (the treated group) are balanced in terms of their pupils’ ability relative to future academies (the control schools) before the switch. This lends some support to our identifying strategy, which assumes that the timing of conversion is as good as random (at least within the subset of schools we have chosen – actual and future converters; see Section 3.2 for a discussion). Column (2) reveals that the average effect of conversion on FSM eligible pupils found in Panels A and B comes from the estimate of the impact in the year after the first in which the academy has opened (c+1). Conversely, the impact at time t is still negative, but small
and imprecisely estimated (-0.007), while the impact at time c+2 is zero. Once again, we find no
evidence of differential pre-trends between ‘treated’ (actual academies) and ‘controls’ (future academies), lending support to our approach. Finally, Column (3) and (4) confirm that academies do not change the gender and ethnic composition of their students.
How robust are these findings? As discussed, our sample includes only pupils in schools that convert between 2011 and 2013 in a time window going from six years prior to conversion to up to two years after (‘treated’ schools), and pupils in schools that will convert in 2014, 2015 and 2016 from six years to one year prior to conversion (‘control’ schools). This approach was taken to reduce potentially unobservable time-varying differences between treated and controls, and to guarantee we could test for pre-treatment effects using an equal number of (school-year) observations for the two groups. However, this approach is not the only one we have experimented with. Appendix Table 2 reports a battery of tests to assess the robustness of our
findings to changes in the definition of the control group. Overall, we find that our results are robust to these changes.
Starting with Panel A, we redefine the control group to include all the observations in future converters between 2005 and 2013 (as opposed to between c-6 and c-1 from conversion –
as for our main control group). The school year 2005 was chosen because it corresponds to c-6
for the first batch of converters (those with conversion year c in 2011). Thus we ‘block’ the
beginning of the observation window of the control group to the first school year of the treated, and consider all periods up to the end of the sample (2013). This approach fully confirm our findings. Next, in Panel B we deal with possible spill-over effects across adjacent cohorts of converters. To do so, we use only pupils in future converters opening in 2016 to construct our comparison group. This does not affect our findings. Finally, in Panel C we drop all pupils in the comparison group of future converters and estimate our effects out of the timing of opening of the actual converters. This approach also confirms our findings.
Before moving on, it is worth commenting on the size of the effects we have documented and compare them to the impact of academy conversion during the Labour years. To do so, the bottom panel of Table 6 considers pupils in schools that become academies between 2003 and 2010 (again in a time window spanning [c-6, c+2] around the time of opening c) and pupils
enrolled at schools that become ‘sponsored’ academies in 2011, 2012 and 2013 (from six years prior to conversion to 2010, before the election of the Coalition Government). This approach essentially reproduces the method we have used to assess the effect of academies on intake during the Coalition years, and uses the Labour-type ‘sponsored’ academies in the Coalition period as controls for the academies of the Labour years. Our results show that Labour academies significantly change their intake after conversion (confirming the earlier findings of Wilson, 2011 and Eyles and Machin, 2015). The effect on KS2 is precisely estimated and corresponds to a 3.1% of a standard deviation change, on average, over the three periods post-conversion. This compares to a zero estimated effect for the academies opened during the Coalition period. Furthermore, we find that Labour academies significantly reduced their intake of pupils eligible for FSM. The estimated effect – at around 9% of the baseline probability – is twice as sizeable as the one we found for the Coalition years. Finally, Labour academies also attract fewer pupils of White ethnic origin – while we found no effect for the Coalition years.
5.2 Heterogeneous effects on intake
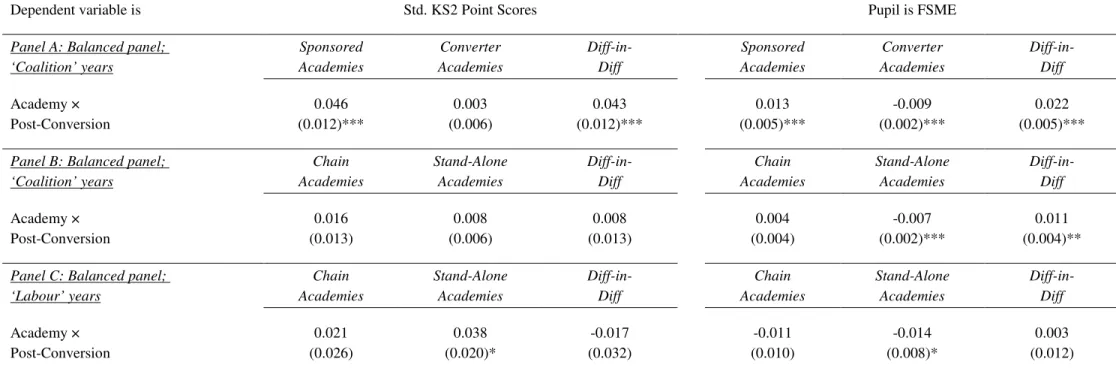
In Table 7 we investigate whether the effects of conversion during the Coalition years on intake are heterogeneous and depend on whether academies are ‘sponsored’ as opposed to ‘converters’,
or part of a chain instead ‘stand-alone’ institutions. We focus only on KS2 test scores and pupils’ eligibility for FSM since these are the variables where we detected significant effects.
The first three columns of Panel A reveal some evidence of heterogeneity. Whereas ‘converter’ academies do not experience any change in the ability of their pupil intake, Labour-type ‘sponsored’ academies that open during the Coalition years attract students with significantly higher KS2 test scores. The estimated effect corresponds to 4.6% of standard deviation for KS2 scores with the difference between the impact of ‘coalition’ and ‘sponsored’ academies being significant. This pattern suggests that zero effect documented in Table 6 is driven by ‘converters,’ and that ‘sponsored’ academies opening after the Academies Act of 2010 more closely resemble the ‘sponsored’ of the Labour period – at least when it comes to changes in their pupil intake. The next three columns of Panel A focus on pupils’ eligibility for FSM and reveal yet another dimension of heterogeneity. We now find that ‘converters’ are associated with a reduction in the share of FSM eligible pupils and drive the overall negative effect presented in Table 6. Conversely, ‘sponsored’ academies attract pupils who are more likely to be eligible for FSM after conversion – with an estimated effect of approximately 9%. As shown in the last column, the difference between these two coefficients is clearly significant. This suggests that along this margin the Labour and the Coalition years ‘sponsored’ academies are not very comparable.
In Panel B, we provide evidence on of the effect of ‘chain’ and stand-alone’ academies on intake. The first three columns show that neither group significantly affects the KS2 composition of its pupil intake ability. This mirrors the overall result we found before. The last three columns however show that ‘stand-alone’ academies tend to attract pupils that are less likely to be eligible for FSM. The estimated effect is approximately 5% of the baseline probability and the difference between ‘chain’ and ‘stand-alone’ academies is significant.
To benchmark the latter results, in Panel C we reproduce the analysis considering ‘chain’ and ‘stand-alone’ academies that opened during the Labour years. The first three columns continue show that academies during this period experienced an increase in the average KS2 attainment of enrolled pupils. Although this effect is larger and statistically significant only for ‘stand-alone’ academies, the effect for schools that convert to become part of a chain is also positive and the two coefficients are not statistically different. Conversely, we find more heterogeneity when considering the effects on the percentage of FSM eligible pupils. ‘Stand-alone’ Labour academies experienced a decrease in the share of disadvantaged students – a pattern that we also found for Coalition-period ‘stand-alone’ academies. However, we find that Labour-period ‘chain’ academies also decreased their intake of FSM eligible students – this was not the case for their Coalition-year equivalents.