INSURANCE
REPORT
05 Preface
Introducing the Eighth Annual World Insurance Report
07 Chapter 1
Non-Life Insurers in Most Markets Demonstrate Improved Underwriting Performance 07 — Key Findings
07 — Insurers Recorded Higher Profits Aided by Drop in Claims Expenses 11 — Conclusion
13 Chapter 2
Alarming Drop in Customer Experience Underscores Rising Customer Expectations 13 — Key Findings
14 — Drop in Positive Customer Experience Was Pervasive across the World 15 — Positive Experience Dropped across All Channels, though Agent Channel
Stands Tall
17 — Claims Servicing Still a Concern, but Efforts to Enhance Claims Experience Resulted in Marginal Improvements
19 — Gen Y Segment Presents Huge Challenge for Insurers, Especially in Developed Markets, as They Strive to Match Rising Expectations 21 — Customer Advocacy Lags in Europe and Developed Asia-Pacific 23 — Conclusion
25 Chapter 3
Disruptive Change Requires Insurers of the Future to Sharpen Strategic, Analytic Skills
25 — Key Findings
25 — Wide Variety of Disruptors Loom
29 — Quickening Trends Point to Additional Vulnerabilities 33 — Maturity Model Identifies Gaps in Insurer Capabilities
37 — Way Forward Requires Customer-Oriented Approach, Analytics 45 — Conclusion
47 Appendix
Efficiency Ratios – Country Analysis
54 CEI Charts 56 Methodology 58 About Us
Capgemini and Efma are pleased to present the 2015 World Insurance Report (WIR). This year’s edition, presented in three chapters, provides a comprehensive overview of the current status of the insurance industry, including detailed assessments of financial performance and customer experience, as well as an overview of looming challenges. An appendix offers a high-level overview of the performance of the non-life insurance industry in 15 countries around the world.
In the first chapter, we analyzed publicly available financial information to see how insurers are faring against a range of industry-standard efficiency ratios. We found that a healthy reduction in claims-related expenses helped boost profits throughout most regions globally, despite the resistance of important levers, such as operational and acquisition ratios, to improvement. Extensive consumer research, based on surveys of more than 15,500 respondents across 30 countries in five regions throughout the world, form the second chapter of our report. In this section, we documented a disquieting drop in the volume of positive experiences customers are having as they interact with their insurance providers. This trend is especially troubling given the strong link we quantified between positive customer experience and advocacy, an important source of loyalty and profitability.
In the third chapter of our report, we outlined the many changes that threaten to negatively impact stability in the insurance industry. Some of these forces of change come from unexpected quarters, while others have been in the works for some time. Alongside this picture of a
changing landscape, we highlighted the tools and strategies available to insurers as they seek to maintain their competitiveness.
We hope you will find our 2015 WIR useful in helping you understand the challenges and opportunities facing global insurers. Armed with details related to peer-level performance and customer attitudes and perceptions, we expect insurers will be better prepared to develop and implement ongoing strategies for continued profitability.
Preface
Jean Lassignardie
Global Head of Sales and Marketing Global Financial Services
Capgemini
Introducing the Eighth Annual World Insurance Report
Patrick Desmarès Secretary General
C
H
A
PT
E
R
1
Non-Life Insurers in Most
Markets Demonstrate
Improved Underwriting
Performance
C
H
A
PT
E
R
1
INSURERS RECORDED HIGHER PROFITS AIDED BY DROP IN CLAIMS EXPENSES
Non-life insurers in most countries recorded healthy profits, aided by a significant drop in claims payout expenses. Global insured losses in 2013 dropped by nearly half to US$45 billion, from US$81 billion in 2012. At the same time, global firms exhibited proficiency in managing the basic risks of the non-life business, showing more improvement than not in the claims ratio, which measures their ability to balance the volumes and prices of premiums against payouts. Other business basics, such as managing operational and customer acquisition costs, proved more resistant to improvement, as operational and acquisition ratios remained largely unchanged or deteriorated slightly in 2013. Despite those difficulties, profitability in the sector was substantial, with insurers in more than half the countries posting double-digit margins.
The global volume of non-life gross written premiums (GWP) increased by 3.3% in 2013, to reach US$2.03 trillion.1 While the 3.3% increase
was a sizable jump over the very slight increase posted between 2011 and 2012, it fell short of the compound annual growth of 4.0% experienced between 2010 and 2012 (see Figure 1.1).
1 “Natural catastrophes and man-made disasters in 2013”, Swiss Re sigma 1/2014, March 2014
Figure 1.1 Global Non-Life Gross Written Premium Volumes (US$ Billion), 2010-2013
1,819.3 1,968.2 1,968.7 2,032.9 0 600 1,200 1,800 2,400 2010 2011 2012 2013 G ro ss W ri tt en P re m iu m (U S $ b ill io n) CAGR 2010-2012 4.0 % Growth 2012–2013 3.3%
Source: Capgemini Financial Services Analysis, 2014; Swiss Re sigma Reports 2010-2014
KEY FINDINGS
Non-life insurers in most regions witnessed improved underwriting ratios due to a significant drop in claims expenses. Australia, Germany, Japan, and Italy recorded the highest improvements, while Netherlands and Switzerland deteriorated the most. The lower claims payouts contrasted with operating and acquisition costs, which were more resistant to positive change. Overall, the improvement in underwriting ratios led to robust profit margins for non-life insurers in most markets.
Global non-life premium volume grew by 3.3% aided by strong growth in emerging markets and marginal improvement in some of the mature markets. Of the markets analyzed, Brazil in Latin America and India in Asia-Pacific witnessed the highest growth in their non-life premiums. Among the developed markets, Sweden and Switzerland posted the highest growth rates while other countries, such as Australia, Japan, Spain and Italy, experienced declines in their premium growth. Given advancements in technology and widespread adoption of different risk mitigation measures, especially in developed markets, it is expected that premium volumes will drop even further in the near future.
While emerging markets witnessed robust growth rates, developed markets found it tough to increase their premium volumes. Brazil in Latin America and India in Asia-Pacific posted the highest increases in gross written premium volumes, at compounded annual growth rates of 8.4% and 8.8% respectively. The more mature markets, beset by stiff competition, experienced more modest growth. The United States and Germany, for example, expanded only in the
3 percentage point range. Several other advanced markets such as Australia, Japan, Spain,
and Italy experienced declines in premium growth (see Figure 1.2). This trend is likely to continue further as adoption of advanced risk mitigation technologies such as telematics and automated home systems, mostly in developed markets increases, resulting in lower incidents and likely lead to a reduction in premiums charged.
Figure 1.2 Non-Life Insurance GWP Volumes by Country (US$ Million), 2010–2013
Gross Written Premium (US$ million) Gross Written Premium (US$ million) CAGR 2010-2013 (2.0%) (2.5%) 4.8% 5.9% 3.2% 3.5% 2.3% 0.6% (0.2%) (1.1%) 5.8% 1.6% 8.4% 8.8% 6.4% Australia Japan Canada Belgium Germany U.S. U.K. Netherlands Spain Italy Switzerland France Brazil India Sweden 32.7 32.3 48.4 34.7 108.8 127.7 130.7 117.2 73.0 72.2 69.0 63.4 16.6 15.3 15.1 14.0 132.8 125.8 131.3 120.8 726.4 703.8 667.1 655.5 106.8 107.4 109.599.7 75.1 71.5 79.7 73.7 38.6 38.4 40.7 38.9 50.6 50.9 55.4 52.3 28.4 27.6 28.5 23.9 94.6 89.7 98.4 90.1 39.5 37.4 37.2 31.0 13.4 13.1 12.2 10.4 10.69.8 10.28.8 2013 2012 2011 2010 200 400 600 800 0
Underwriting ratios mostly improved, with reduced claims costs acting as the most significant lever. In nearly two-thirds of the countries, underwriting ratios improved or stayed the same (see Figure 1.3). The largest improvements in underwriting ratios
occurred in Australia, Germany, Japan, and Italy. Only in Germany did a significant decrease in operational expense play a role in enhancing the underwriting ratio. In all other countries, operating and acquisition ratios stayed about the same or deteriorated slightly. Figure 1.3 Non-Life Insurance Underwriting Ratios (Combined Expenses as a Percentage of GWP) %, 2010–2013
(16.9) (6.6) (1.5) (1.1) (7.6) (2.2) 1.4 6.7 3.3 (5.6) 7.2 (0.3) 0.0 NA 1.0 70.5 97.6 82.8 65.2 11.1 10.6 9.0 8.6 13.1 13.0 12.6 13.7 2010 61.0 71.4 64.8 58.8 18.5 17.6 16.6 16.0 16.7 16.4 16.3 16.3 77.4 72.2 65.5 64.9 10.9 11.1 11.9 11.5 17.3 16.3 16.1 15.6 66.0 60.3 56.6 55.0 9.7 14.3 14.2 14.3 15.1 20.4 20.4 20.8 70.6 71.7 68.5 66.0 13.2 15.4 15.8 10.6 12.2 11.2 10.3 10.4 69.1 74.2 69.6 66.6 18.9 19.0 20.9 22.1 17.9 17.3 16.3 15.9 67.2 63.1 63.8 63.1 12.9 13.2 11.1 11.7 19.7 18.9 20.3 21.8 68.0 70.1 68.6 76.0 8.2 8.5 8.6 8.6 15.4 14.9 14.5 13.9 74.7 72.8 72.8 66.3 8.4 8.2 8.5 9.1 16.1 15.9 15.6 15.9 69.0 68.4 66.9 69.8 9.4 9.7 8.3 9.6 16.3 16.3 12.8 15.8 77.0 67.5 76.0 75.7 7.2 7.7 6.7 6.7 15.9 16.4 15.4 15.4 64.5 58.9 60.6 59.3 13.1 14.4 16.9 17.6 16.6 14.2 20.4 21.3 95.3 89.7 67.7 31.8 26.2 21.2 5.7 6.3 3.9 NA 78.8 75.5 73.9 75.0 16.6 13.7 13.4 13.4 4.7 9.6 10.2 10.1 0 20 40 60 80 100 120 140 2010 2011 2012 2013 2010 2011 2012 2013 2010 2011 2012 2013 2010 2011 2012 2013 2010 2011 2012 2013 2010 2011 2012 2013 2010 2011 2012 2013 2010 2011 2012 2013 2010 2011 2012 2013 2010 2011 2012 2013 2010 2011 2012 2013 2010 2011 2012 2013 2010 2011 2012 2013 2010 2011 2012 2013 2010 2011 2012 2013 Underwriting Ratio (%)
Claims ratio Operational Ratio Acquisition ratio
Australia Japan Canada Belgium Germany U.S. U.K. Netherlands Spain Italy Switzerland France Brazil India Sweden % Point Change 2012–13 9.6 1.4 (12.1) 0.4 (1.3) 0.9 (4.6) 0.1 (2.1) (2.2) (6.8) (2.0) (3.6) (40.1) (2.5) 2010–12 70.9 68.4 68.0 70.9 3.7 3.6 3.5 3.7 17.4 17.7 18.4 18.6
Note: The ratios are valid only for non-life insurance; The ratios reflect non-life data as reported by the countries themselves, and hence include health insurance for Italy, Spain, Switzerland, and Netherlands; At the time of analysis, 2013 data was not available for India; The previous year ratios may have changed based on the refresh of
Coming after a $12.5 billion underwriting loss in 2012, the global underwriting profit of $8.52 billion in 2013 was a welcome turnaround. The profits were the third best of the past decade, following $28.9 billion in 2006 and $23.0 billion in 2007. Fewer natural disasters combined with premium rate revision led to improved claims ratios, which in turn helped propel the underwriting profits.
Most countries were successful in lowering their claims ratio significantly (see Figure 1.4). Australia experienced the largest decrease in the claims ratio by a wide margin, thanks to premium rate increases and portfolio remediation measures, as well as decreased loss and loss adjustment expenses. In Japan, a reduction in direct claim payments for fire insurance helped pull down the claims ratio, while the Italian non-life insurance market benefited from the decrease in claim frequency and from the major attention on fraudulent claims mitigation (subsidized by new regulations).
In Spain and Netherlands, where claims ratios experienced significant degradation, competition hampered the ability of non-life insurers to employ premium pricing as a tool to improve claims ratios. In both markets, insurers lowered premium prices as a means of gaining share in tough markets. Spanish motor insurers, for example, reduced premiums by 10% to 20%. Such price reductions had the effect of increasing claims expenses.
Despite ongoing efforts to drive productivity and improve the bottom line through automation, little change occurred in the operational ratios of non-life insurers in most countries. Companies are striving to make wise investments in technology and automation, yet most are still struggling to achieve the types of operational benefits that would give them a clear competitive advantage. Only in Germany, where non-life insurers have successfully deployed numerous cost-reduction measures, did operational ratios improve in a significant manner. In the United States, where the expenses of supporting the world’s largest insurance market are already high, regulatory requirements, anti-fraud measures, and legacy replacement costs drove operational expenses up even further. The industry as a whole needs to continue to make technology investments aimed at taming the inefficiencies and complexities of basic insurance underwriting.
Acquisition ratios remained mostly flat, even as insurers embraced the use of alternate channels to distribute products. The burden of supporting multiple distribution methods may explain the difficulty insurers have encountered in bringing down acquisition ratios. Even though digital channels offer enormous upside to enhancing the customer experience and improving profitability by helping insurers lower their commission costs, entrenched delivery channels are likely to continue to play a role in product distribution for some time. As insurers continue to make gains in moving customers to alternate channels, they will begin to reap the benefits of more streamlined distribution.
Figure 1.4 Non-Life Insurance Performance in Key Ratios, (percentage point change), 2012–2013
Countries / % Point Change in Ratios,
(2012-13) Australia Japan Canada Belgium Germany U.S. U.K.
Netherlands
Spain Italy
Switzerland France
Brazil
Claims Ratio
High Deterioration Medium Deterioration Low Change No change Medium Improvement High Improvement
Operational Ratio Acquisition Ratio Underwriting Ratio -6.5 2.9 -0.3 -1.3 -17.6 -6.0 -0.6 -1.6 -2.5 -3.0 -0.7 7.4 2.9 0.6 1.3 0.0 0.7 -0.4 -0.6 -0.4 0.1 -5.2 1.2 0.6 0.0 0.2 0.3 3.0 0.0 0.6 1.1 0.0 -0.5 0.4 0.1 -0.4 1.5 -0.6 0.2 -5.6 7.2 -0.3 0.0 Sweden 1.1 0.0 -0.1 1.0 -16.9 -6.6 -1.5 -1.1 -7.6 -2.2 1.4 6.7 3.3
Note: PP refers to percentage point change; 2013 data for India is unavailable since the consolidated data for Indian insurance firms has not been published yet ▲ refers to change
Source: Capgemini Financial Services Analysis, 2014; Industry Reports from Insurance Associations and Regulators 2 AM Best Reports
Profit margins for non-life insurers around the world mostly rose on the strength of improved underwriting ratios. Fewer natural disasters, combined with premium rate revisions, led to better claims ratios. These improved ratios in turn boosted underwriting ratios, a measure reflecting the overall efficiency of insurance companies. Operational and acquisition ratios remained mostly unchanged, causing little impact on underwriting ratios or overall profitability.
U.S. and Australian non-life insurers witnessed the highest growth in profit margins. The Australian market benefited from a massive improvement in the claims ratio, while the United States experienced a major decline in natural disasters following a series of them the previous year. Canada suffered the highest losses. Despite growth of 3.2% in premium volumes, a large number of natural disasters took its toll on profitability. The only other country to experience losses was Germany, where severe hailstorms struck heavily populated areas.
CONCLUSION
Though non-life insurers experienced the benefits of a relatively quiet year in 2013, some of our findings portend growing difficulties in expanding the business going forward. For one, the volume of premiums is growing more slowly in developed markets than emerging ones. Insurers also face a challenge in developing an accurate pricing model to assess the impact of newer risks such as cyber security and increasing terror threats, which could have a negative impact on claims ratio. In addition, insurers continue to leave profits on the table by largely failing to bring down operational and acquisition costs. With rising global temperatures expected to increase the frequency and intensity of natural calamities, the non-life insurance business is only going to get tougher. Global non-life insurers will need to tighten up all aspects of their businesses to be prepared for this shift.
Alarming Drop in
Customer Experience
Underscores Rising
Customer Expectations
C
H
A
PT
E
R
2
KEY FINDINGSGlobally, positive customer experiences decreased significantly in 2014, indicating that steps taken by insurers are not matching rising customer expectations. North America witnessed the largest drop of 8.3 percentage points, followed by Latin America with 5.3 percentage points. A steep drop in positive customer experience by the Gen Y segment contributed to the large decline in North America. The huge drop in positive experience levels of U.S. customers enabled Austria to overtake it and emerge as the country with the highest percentage of customers citing positive experiences.
The agent channel delivered positive experience levels that were almost double those of digital channels, suggesting that digital channels are dragging down global customer experience levels. Customer expectations of digital channels such as mobile and social media are rising rapidly along with their usage and importance. However, more than 40% of customers cited positive experiences through the agency channel, while less than 30% of customers had positive experiences through digital channels such as mobile and social media. Claims servicing is still an area of concern for most insurers when it comes to enhancing customer experience. This process had the lowest percentage of customers with positive experiences. In most regions, customers who made a claim in the past year reported positive experience levels that were significantly lower than customers who did not make a claim. For example, North American customers who made a property claim in the past year reported a positive experience level of 24%, compared to 47% for customers who did not make a claim. The drop in positive experience levels was much steeper for the Gen Y segment compared to other age groups across all regions, especially in the developed markets. In North America, the drop in experience levels for Gen Y customers was approximately 10 percentage points steeper than other age segments, while in developed Asia-Pacific the difference was around five percentage points.
Positive experiences led to better customer advocacy, however advocacy levels varied across regions. Developing Asia-Pacific (Developing APAC), Latin America, and North America displayed higher advocacy levels, while those in developed Asia-Pacific (Developed APAC) and Europe were quite low. Only delighted customers (those with very positive experiences) displayed positive advocacy.
DROP IN POSITIVE CUSTOMER EXPERIENCE WAS PERVASIVE ACROSS THE WORLD
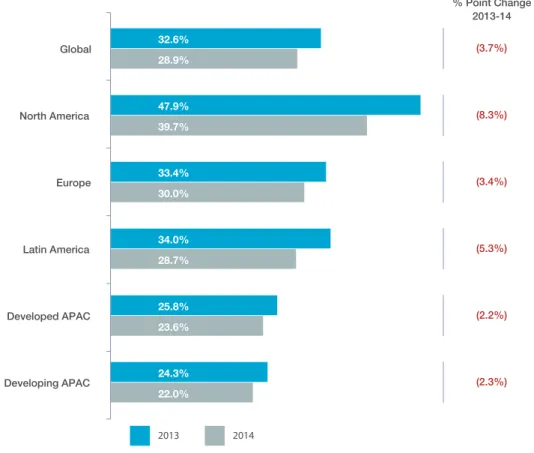
Despite ongoing efforts to improve service, positive customer experience levels decreased significantly across the world in 2014 (see Figure 2.1). The global level, already low in 2013 at 32.6%, decreased by another 3.7 percentage points to 28.9%. Of the 30 countries surveyed, 80% recorded a decline in the percentage of customers with positive experiences. Furthermore, about one-third of these customers witnessed a decrease of more than 5 percentage points.
This was the first time we observed such a drastic drop since we began tracking customer experience three years ago.
North America, which in 2013 had the highest level of positive customer experience at 47.9%, experienced the largest decrease (8.3 percentage points), followed by Latin America with a 5.3 percentage point drop. The United States had been the only country in 2013 to record positive customer experiences in excess of 50.0%. But a large decline of 10.5 percentage points resulted in only 40.8% of U.S. customers citing a
positive experience in 2014. As a result of this drop, the United States dropped down to the second place behind Austria (see Figure 2.2). This decrease may have to do with a decline in satisfaction with digital channels. Positive experience levels for digital channels such as mobile and social media was around 30%, compared to 50%+ rates for the traditional agent channel for both life and non-life.
Positive customer experience levels in Europe decreased by 3.4 percentage points to 30.0%, reflecting large declines in countries throughout the region. Netherlands, France, Germany, Poland, and Spain witnessed the largest declines in Europe, each recording decreases in positive customer experience of more than 5 percentage points. Portugal was the only country that had a significant increase (4.8 percentage points) in the number of customers with positive experiences. However, this increase reflected already low levels of positive customer experience in the country and existing room for improvement.
Figure 2.1 Customers with Positive Experience, by Region (%), 2013–2014
22.0% 23.6% 28.7% 30.0% 39.7% 28.9% 24.3% 25.8% 34.0% 33.4% 47.9% 32.6% Developing APAC Developed APAC Latin America Europe North America Global 2013 2014 % Point Change 2013-14 (8.3%) (3.4%) (5.3%) (2.2%) (2.3%) (3.7%)
In developed and emerging Asia-Pacific, where positive customer experience remained the lowest in the world, the levels decreased further, by 2.2 and 2.3 percentage points, respectively. Seven of the ten countries with the least amount of customers having a positive experience were located in Asia-Pacific in 2014. The inability of insurers to meet the constantly evolving expectations of the tech-savvy populations they serve appeared to play a role, particularly in the developed Asia-Pacific markets of Hong Kong, Japan, and Singapore.
POSITIVE EXPERIENCE DROPPED ACROSS ALL CHANNELS, THOUGH AGENT CHANNEL STANDS TALL
The agent channel continued to be most important to customers of all ages across all regions. In addition, it provided the highest levels of positive customer experience across all markets for both life and non-life insurers (see Figure 2.3). The agent channel was
the most successful in North America with more than 50% of customers claiming a positive customer experience. In all other regions, positive experience levels through the agent channel were well ahead of the remaining channels.
Digital channels, particularly mobile and social media, were found to drag down experience levels across the globe, with less than 30% of customers citing positive experiences from these channels in most markets. Most customers are now accustomed to receiving exemplary services via the digital channels for sectors such as retail, travel, and to a certain extent, banking. Hence their expectations from these digital channels are quite high even while receiving insurance services. As such, the experience levels from digital channels are lower when compared to the agent channel. The ongoing importance of agents in the channel mix and their ability to deliver consistent Figure 2.2 Top 10 and Bottom 10 Countries with Positive Experience (%), 2014
Top 10 Countries for Customers with a Positive Customer
Experience (%), 2014 Bottom 10 Countries for Customers with a Positive CustomerExperience (%), 2014
44.5% 39.5% 40.6% 38.6% 43.1% 31.3% 39.8% 41.2% 51.3% 43.6% 32.0% 33.0% 33.3% 35.2% 35.7% 36.1% 36.7% 37.3% 40.8% 43.0% U.S. Netherlands Germany Australia Switzerland South Africa Portugal Belgium Canada Austria 32.2% 29.7% 25.9% 20.4% 21.1% 19.8% 17.5% 22.2% 16.4% 15.0% 24.6% 2013 2014 23.6% 22.8% 20.6% 20.5% 20.0% 19.7% 19.6% 19.5% 15.2% India Poland Sweden Russia Taiwan Singapore Hong Kong Japan China South Korea 2014 Rank 2013Rank 01 02 03 04 05 06 07 08 09 10 03 01 05 07 16 04 10 06 08 02 2014 Rank 2013Rank 30 29 24 28 27 25 26 23 20 13 30 29 28 27 26 25 24 23 22 21
positive experiences dictates a moderated approach to channel management. While insurers need to continue enhancing mobile and social media channels, they should take care to ensure that these enhancements are not carried out at the expense of the agency channel. Rather, ongoing investments need to support all types of channels, at least for the foreseeable future. In addition, insurers should strive to bring some of the qualities that define traditional channels to the newer channels, and vice versa. For example, insurers should try to replicate the intimacy and personal service that characterize the agent channel as they develop more modern channels. Similarly, they should empower their agents with digital tools that advance the convenience and availability found in newer types of channels.
In the future, usage of Internet-mobile and social media channels are expected to increase more than usage of traditional channels. Furthermore, the
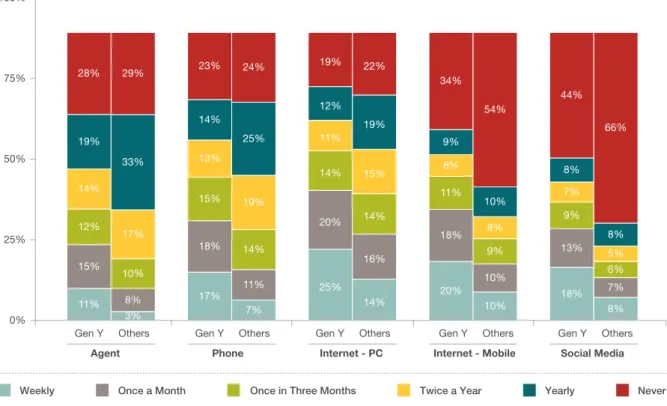
Internet-PC may challenge the agent channel as the most frequently used channel. It is currently the most frequently used channel during pre-sale (information gathering and quote search) and insurers need to enhance their seamless integration capabilities in order to meet expectations in one of the more prevalent customer journeys of research online-purchase offline. Customers will continue to place high importance across the full range of channels for their insurance needs. Insurers thus need to focus on delivering excellent service across all channels. Currently, the frequency of interactions with their insurers is much higher for digital channels such as the Internet-PC, mobile, and social media over traditional channels such as agent and phone (see Figure 2.4). Insurers also have more opportunities to provide positive experiences to Gen Y customers as they interact with their insurer on a more frequent basis, especially using mobile and social media channels. As the popularity
Figure 2.3 Positive Experience Levels by Channel and Region (%), 2014
38% 34% 36% 35% 43% 34% 30% 29% 31% 38%
Agent Phone Internet-PC
Internet-PC 35% 31% 29% 36% 40%
Agent Phone Internet-Mobile
Internet-Mobile Social Media Social Media 35% 30% 33% 38% 43% Latin America Developing APAC Developed APAC Europe North America Latin America Developing APAC Developed APAC Europe North America 32% 28% 22% 25% 33% 31% 29% 26% 22% 32% 29% 30% 23% 26% 30% 31% 32% 29% 27% 35% Non-Life Life 43% 38% 35% 40% 51% 49% 42% 41% 47% 57%
of digital channels continues to rise, insurers can use them to increase the frequency of touch points and the number of opportunities to wow customers.
CLAIMS SERVICING STILL A CONCERN, BUT EFFORTS TO ENHANCE CLAIMS EXPERIENCE RESULTED IN MARGINAL IMPROVEMENTS The multi-faceted insurance lifecycle offers numerous opportunities for insurers to provide positive
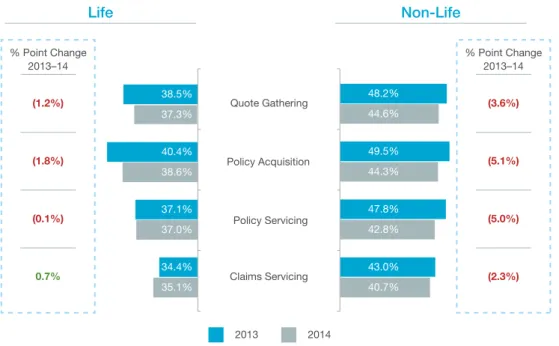
experiences to customers. Yet across almost every dimension of the lifecycle, insurers struggled to do so. The level of positive customer experience declined for nearly all types of activities related to purchasing and holding all types of insurance policies (see Figure 2.5). Non-life insurance customers recorded the biggest declines in positive experience compared to life customers. Positive experience in the policy acquisition phase of non-life insurance declined by 5.1 percentage points, followed by policy servicing, with a decline of 5.0 percentage points, and quote gathering with a decline of 3.6 percentage points. Despite these large decreases, the level of positive customer experience in non-life insurance is still considerably higher than in the life insurance sector, where year-to-year declines were smaller.
Figure 2.4 Frequency of Channel Usage – Gen Y Customers vs. Others (%), 2014
0% 25% 50% 75% 100%
Gen Y Others Gen Y Others Gen Y Others Gen Y Others Gen Y Others
Agent Phone Internet - PC Internet - Mobile Social Media
Yearly Twice a Year
Once in Three Months Once a Month Weekly Never 11% 3% 15% 8% 12% 10% 14% 17% 19% 33% 28% 29% 17% 7% 18% 11% 15% 14% 13% 19% 14% 25% 23% 24% 25% 14% 20% 16% 14% 14% 11% 15% 12% 19% 19% 22% 20% 10% 18% 10% 11% 9% 8% 8% 9% 10% 34% 54% 18% 8% 13% 7% 9% 6% 7% 5% 8% 8% 44% 66%
Source: Capgemini Financial Services Analysis, 2014; Capgemini Insurance Voice of Customer Survey, 2014
Claims servicing remains the lifecycle stage with the lowest levels of positive experience for both life and non-life customers; however, the decline in experience levels was lowest for claims servicing. The lower rate of decline indicates that insurers are taking steps to enhance the claims experience. Nevertheless, customers still view these efforts as inadequate. Effectively leveraging technology to minimize the impact of risk and deliver faster processing can help enhance the overall claims experience of customers. A close look at the data related to claims servicing underscores the difficulty of delivering positive customer experiences in that area (see Figure 2.6). Auto and property insurance customers who made any claim in the past year had significantly lower positive experience levels than customers who did not make a claim. In North America, for example, only 24% of property insurance customers who made a claim in the past year reported a positive experience, compared to 47% of customers who did not make a claim. The lower levels of positive experience related to claims servicing were pervasive, despite ongoing efforts insurers have made to automate the claims process. For customers increasingly accustomed
Figure 2.6 Impact of Claims on Positive Customer Experience Customers with Positive Experience for
Auto Insurance, by Region (%), 2014
Customers with Positive Experience for Property Insurance, by Region (%), 2014
Customers who haven’t made any claim in the past year Customers who have made a claim in the past year
Developed APAC 32% 31% 27% 33% Europe 31% 39% 30% 40% 31% 38% Latin America 34% 34% North America 37% 46% 24% 47% Developing APAC 26% 29% 20% 29%
Source: Capgemini Financial Services Analysis, 2014; Capgemini Insurance Voice of Customer Survey, 2014
Figure 2.5 Insurance Customers with Positive Experience, by Lifecycle Stage (%), 2013–2014
Life Non-Life 2014 2013 % Point Change 2013–14 (1.2%) (1.8%) (0.1%) 0.7% % Point Change 2013–14 (3.6%) (5.1%) (5.0%) (2.3%) 35.1% 34.4% 37.0% 37.1% 38.6% 40.4% 37.3% 38.5% 40.7% 43.0% 42.8% 47.8% 44.3% 49.5% 44.6% 48.2% Claims Servicing Policy Servicing Policy Acquisition Quote Gathering
Source: Capgemini Financial Services Analysis, 2014; Capgemini Insurance Voice of Customer Survey, 2014
to conducting a wide range of personal activity via streamlined, frictionless internet and mobile transactions, the insurance claims process likely feels inconvenient and cumbersome. The pressure for insurers to provide a quick and efficient response
is even greater, given that claims are typically tied to an undesirable incident. Additionally, faster claims processing can save significant costs for the insurer. The longer a claim remains open, the more it is going to cost the insurer. Insurers’ performance in
claims servicing is probably the result of customer expectations that have been set beyond most insurers’ current capabilities.
GEN Y SEGMENT PRESENTS HUGE CHALLENGE FOR INSURERS, ESPECIALLY IN DEVELOPED MARKETS, AS THEY STRIVE TO MATCH RISING EXPECTATIONS
Generation Y, the customer segment aged between 18 and 34, is said to be comprised of individuals who are confident, ambitious and most important, tech-savvy. Having never experienced adult life without the aid of the internet or smart devices, digital technology is essential to the Gen Y lifestyle. With Gen Y comprising one-quarter to one-third of the population in many markets, this segment is of high importance to insurance firms, especially given the high potential of their lifetime values. Insurers must devise strategies that can attract and retain this valuable age segment. The downside is that Gen Y expectations are quite lofty. Any failure to match these expectations will result in a negative impact on experience, as witnessed in our findings this year. Especially in developed markets, the drop in customer experience levels for Gen Y customers was very steep (see Figure 2.7). For life customers in developed Asia-Pacific, for example, the positive experiences of Gen Yers decreased by 5.4 percentage points, compared to an increase of 1.5 percentage points for those older
Figure 2.7 Change in Customers with Positive Experience, by Age and Region (%), 2013 –14
Life Non-Life (1.6%) (1.4%) (0.6%) 1.5% 1.3% (2.3%) (3.0%) (3.1%) (5.4%) (10.9%) (6.0%) (6.4%) (3.8%) (2.5%) (7.9%) (6.7%) (2.7%) (7.2%) (7.3%) (14.6%) North America 18-34 Years 34+ Years Developed APAC Europe Developing APAC Latin America
Source: Capgemini Financial Services Analysis, 2014; Capgemini Insurance Voice of Customer Survey, 2014
than 34. In North America, the difference was even more marked, with positive experiences declining by 10.9 percentage points for Gen Yers, compared to an increase of 1.3 percentage points for older respondents.
This decrease in positive experience for Gen Y customers contributed significantly to the overall decline in positive experience levels throughout the industry. The largest Gen Y-related decreases occurred in North America among life and non-life customers, as well as in developed Asia-Pacific and Europe among non-life customers. These results underscore the very high service expectations that Gen Yers have cultivated as a result of having grown up on a full array of digital media and servicing from a wide range of providers. As a result, insurers must continue to adapt the quality of their automated digital services to cater to the higher expectations of Gen Yers, or risk losing them to newer, more agile competitors.
Gen Y Customers Place Much Higher Importance on Mobile, Social Media Channels
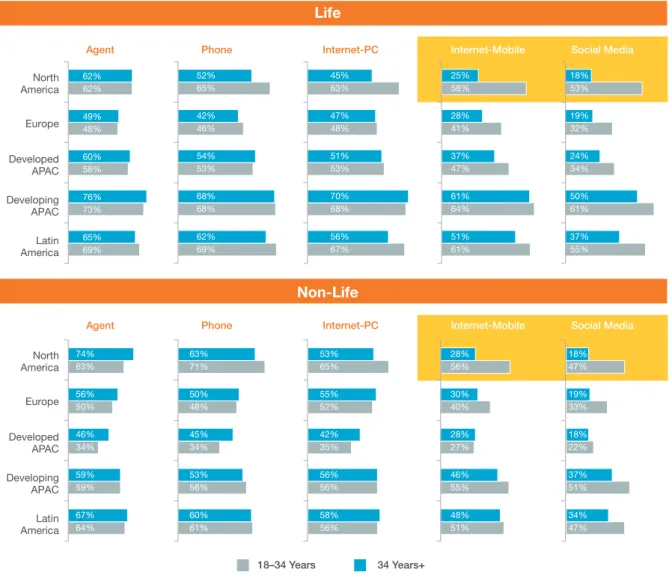
Gen Y customers, given their affinity for technology and their expectations around instant access to information and service convenience, are far more interested than older customers in using advanced alternate channels (see Figure 2.8). In North America,
for example, the distinction is sharp, with 53% of Gen Y life customers citing social media as an important channel, compared to only 18% of those 34 years and older. Similarly, 58% of Gen Yers view the mobile channel as important, compared to only 25% of older customers.
Effective channel management is expected to play an enormous role in insurers’ success in providing positive customer experiences in the future. Our data shows that channel usage and preferences are in a state of flux. As a result, insurers will need to satisfy the desire of some customers for the comfort and familiarity of traditional channels, while at the same time meeting the needs of others for faster, more convenient service.
Decline in Positive Experiences Pervasive across All Channels, Particularly for Gen Y Customers An examination of the importance of particular channels highlights ongoing trends in channel preferences (see Figure 2.9). Globally, the importance of the agent channel declined, even for non-Gen Y customers, while the internet and mobile channels exhibited the largest increases in importance, for both Gen Y and non-Gen Y customers. At the same time, however, the level of positive experience related to every type of channel largely declined.
Customer experience levels dropped the most for the agent channel, however, it still remains the most important channel and also the channel providing the highest levels of positive customer experiences.
Figure 2.8 Channel Importance by Age and Region, 2014
Agent Phone Internet-PC Internet-Mobile Social Media
Agent Phone Internet-PC Internet-Mobile Social Media
Latin America Developing APAC Developed APAC Europe North America Latin America 18–34 Years 34 Years+ Developing APAC Developed APAC Europe North America Non-Life Life 69% 73% 58% 48% 62% 65% 76% 60% 49% 62% 69% 68% 53% 46% 65% 62% 68% 54% 42% 52% 67% 68% 53% 48% 63% 56% 70% 51% 47% 45% 61% 64% 47% 41% 58% 51% 61% 37% 28% 25% 55% 61% 34% 32% 53% 37% 50% 24% 19% 18% 51% 55% 27% 40% 56% 48% 46% 28% 30% 28% 47% 51% 22% 33% 47% 34% 37% 18% 19% 18% 56% 56% 35% 52% 65% 58% 56% 42% 55% 53% 61% 56% 34% 48% 71% 60% 53% 45% 50% 63% 64% 59% 34% 50% 63% 67% 59% 46% 56% 74%
The majority of customers, no matter their age, had fewer positive experiences regardless of the channel they used. This widespread dissatisfaction may be a reflection of the difficulties providers are having as they maintain existing channels while also adding new ones. The most significant difference between Gen Y and non-Gen Y customers came in their assessment of social media. More than 50% of Gen Yers cited social media as an important channel, compared to only 30% of older customers. CUSTOMER ADVOCACY LAGS IN EUROPE AND DEVELOPED ASIA-PACIFIC
For insurers interested in acquiring new customers and strengthening their market position, there is no better ally than the customer advocate. Our findings related to customer advocacy3 proved that positive customer experience is fundamental to increasing customer advocacy (see Figure 2.10 and Figure 2.11). Further, some regions have much higher advocacy levels than others.
Figure 2.9 Importance vs. Positive Experience with Channel for Gen Y Customers and Others, 2012–2014
Customers with positive experience with channel (%)
Ch an ne l Im p o rta nc e (% ) 2012 2014 Gen Y Others Agent Phone Bank Broker Internet-Mobile Internet-Mobile Internet-Mobile Internet-Mobile Agent Broker Bank Phone Internet-PC Internet-PC Internet-PC Internet-PC Social Media Agent Broker Bank Phone Agent Broker Bank Phone Social Media 30% 40% 50% 60% 70% 80% 10% 20% 30% 40% 50%
Source: Capgemini Financial Services Analysis, 2014; Capgemini Insurance Voice of Customer Survey, 2014
In developing Asia-Pacific, Latin America, and North America, customers with very positive and positive experiences displayed much higher advocacy levels than customers with neutral or negative experiences. In developing Asia-Pacific and Latin America, customers who had very positive experiences recorded the highest advocacy levels-53 and 45, respectively, for life customers, and 51 and 40, respectively, for non-life customers
Meanwhile, customer advocacy levels in developed Asia-Pacific and Europe were much lower than in other regions. Though delighted customers (i.e., those with very positive experiences) in developed Asia-Pacific and Europe had higher levels of customer advocacy, the levels did not reach nearly the same heights as in other regions. In effect, insurers must aim very high in providing a delightful experience.
3 “Customer advocacy rates were calculated by asking customers how likely they were to refer a friend, family member, or colleague, and
Figure 2.10 Customer Advocacy for Life Insurers with Very Positive, Positive, and Neutral or Negative Experience, by Region, 2014 (27) 9 53 1 45 30 (11) 36 (6) 33 27 10 (27) (3) (2)
Developed APAC Developing APAC Europe Latin America North America
Very Positive Experience Positive Experience Neutral or Negative Experience
Source: Capgemini Financial Services Analysis, 2014; Capgemini Insurance Voice of Customer Survey, 2014
Figure 2.11 Customer Advocacy for Non-Life Insurers with Very Positive, Positive, and Neutral or Negative Experience, by Region, 2014 (27) 4 51 1 40 24 (20) 33 (11) 23 17 4 (25) 0 (2)
Developed APAC Developing APAC Europe Latin America North America
Very Positive Experience Positive Experience Neutral or Negative Experience
Especially for customers in Europe and developed Asia-Pacific, the delivery of a very positive experience has become a bare minimum necessity.
An important point to note is that even for those customers who had a positive experience, the
advocacy levels were negative in the regions of Europe and developed Asia-Pacific (-6 and -11, respectively for life insurance and -11 and -20, respectively, for non-life customers).
CONCLUSION
Expectations are one of many factors that lead to positive customer experiences in the insurance industry. As customers have become increasingly exposed to advanced digital services from a wide range of providers, their expectations with respect to insurers have become heightened. Insurers have had a hard time meeting these higher expectations, particularly when it comes to the complicated matter of settling claims, or interacting with digitally demanding Gen Yers.
Insurers can take a number of steps to counteract the negative impact that heightened expectations have had on the level of positive customer experiences. Given the strong affinity that customers have toward traditional channels like agents, and the growing popularity of alternate channels, insurers should strive to blend the most beneficial qualities of each. Agents can be empowered with digital tools, while alternate channels can become more customized and personalized.
Hitting upon a winning formula for service delivery can help insurers move back up the scale in creating positive customer experiences. Such experiences are crucial to building customer advocacy, an all-important measure of customer loyalty, engagement, and profitability.
C
H
A
PT
E
R
1
Disruptive Change
Requires Insurers of the
Future to Sharpen
Strategic, Analytic Skills
C
H
A
PT
E
R
3
WIDE VARIETY OF DISRUPTORS LOOM
For decades, even centuries, the classic insurance sale has involved a warm handshake. Agents selling traditional products focused on delivering personalized service through face-to-face visits, often in a customer’s own home or office. The consultative selling process, which hinged on lengthy relationship building, could take weeks.
When the internet entered onto the scene in the late 1990s, communication that was once dependent on human interaction found a new outlet. Though
agents and brokers continued to be the preferred sales channel, the internet began to attract greater numbers of users, while the addition of other alternate channels fragmented distribution even more. Internet-PC has now become the second most preferred channel for insurance customers and is fast catching up with the traditional channel of agent.
Though the internet’s influence has been significant, it was only the first of several disruptors impacting the insurance industry in a significant manner (see Figure 3.1). Insurers are going to be impacted significantly
KEY FINDINGS
Big Data analytics is expected to have the biggest impact by far on the insurance industry, with 78% of executives citing it as a key disruptive force. Regulatory change was ranked second at 46% and economic uncertainty ranked third at 42%.
These top three disruptive forces represent only a small portion of the many factors expected to dramatically affect the insurance landscape. Other disruptive agents include demographic shifts, extreme weather events, new competition from non-insurers, and advanced technology.
Insurers globally are falling short of their desired maturity levels in every one of seven core capabilities identified in our Insurance Capability Maturity Model (see Figure 3.7). To better prepare for the many changes looming ahead, insurers must assess their current strengths and weaknesses, and develop a strategic plan for moving forward.
Insurers globally are performing at the lowest maturity levels when it comes to capabilities related to customer interactions. These include connecting elegantly with customers, engaging regularly with them, and having a complete view of customer data and relationships.
Regional differences are exhibited by insurers in their maturity levels related to various capabilities. Insurers in North America operated at much higher maturity levels across all core capabilities when compared to those in other regions.
To move from the current states of mostly basic and median competency to leading-edge and advanced practices, insurers must adopt a more customer-centric approach. The use of analytics to assimilate customer data, view relationships as a whole, and deliver personalized products through appropriate channels will be essential to succeeding as a customer-oriented insurer of the future.
in the very near future and in some cases they are already facing the impact. This series of rifts will affect the industry’s traditional products, processes, and channels, forcing insurers to innovate or lose out on new opportunities.
The disruptors on the horizon encompass a wide range of change.
Demographic Shifts
Globally, the population of people aged 65 years and older is expected to triple to 1.5 billion by mid-century4, presenting a host of economic and social burdens. For insurers, the aging population will likely trigger higher demand for products related to an older customer base, such as retirement income and long-term care insurance. Increasing rate of urban migration, especially in emerging markets, is also leading to change in the demand for different insurance products. The shifting population will also affect the processes insurers use to calculate vital rates, as well as assumptions about future ranges of uncertainty, which will influence product pricing and underwriting.
Aside from an aging population, the number of teen drivers and single-parent families are expected to rise in the future. The longevity of the world’s older population, combined with growing numbers of younger customers, will put pressure on insurers to offer a full suite of robust delivery channels that can meet the broad range of customer distribution preferences. In effect, from a demographic perspective, insurers have opportunities to offer new products for an aging population, as well as multi-faceted delivery channels for an increasingly diverse customer set. Increased Frequency of Extreme Weather Events Growing rates of natural calamities, combined with increasing urbanization of disaster-prone areas, is causing the economic costs of calamities to rise precipitously. Three times as many natural disasters occurred from 2000 through 2009, as did from 1980 through 1989, with growth in climate-related events accounting for nearly 80% of the increase.5 From 1980 to 2011, estimated damages caused by natural disasters rose from about $25 billion to about $350 billion.6
4 “Attitudes about Aging: A Global Perspective”, Pew Research Global Attitudes Project January 30, 2014.
5 “Natural Disasters, Armed Conflict and Public Health”,The New England Journal of Medicine, Jennifer Leaning, MD and Debarati Guha-Sapir,
PhD, November 13, 2013
6 EM-DAT, The International Disaster Database, www.emdat.be/natural-disasters-trends Figure 3.1 Key Disruptors for Insurers
Disruptors Where Are My New Customer Segments? Why Aren’t My Investment Returns Attractive? What’s the Reason for Rising Claims Expenses? Who’s Eating My Pie? Is Big Brother’s Supervision Increasing? How Is It All Connected? Demographic Changes Demographic changes influence product pricing, underwriting as life expectancy continues to increase across major markets along with increasing urbanization
Financial and Economic Conditions
Insurance industry continues to operate in an uncertain macroeconomic environment which might negatively impact investment returns
Regulatory Intervention and Scrutiny
Insurers now have to comply with higher number of regulations leading to increased data storage and reporting; regulators are pushing insurers toward improved transparency Extreme Environmental Conditions and Catastrophes Recently recurring catastrophic events in places without prior history such as tsunami, storm, floods, etc have resulted in increased costs for insurers
New Entrants (Non-Core Insurance Players)
New competition has emerged from non-core insurance players such as Walmart and Google, as they enter the insurance arena
Technology Advancements
The connectivity of devices has led to an age of Internet of Things making it necessary to invest in social media, mobile, analytics, and cloud computing
The rising cost of claims associated with disasters is changing the landscape of the insurance business. From a product perspective, insurers need to consider adding riders to their policies, as well as new products, to address co-insurance needs. In terms of processes, insurers have an immediate need to expand their use of advanced modeling tools to better predict catastrophes and expected losses. From a channel point of view, disasters offer insurers the opportunity to move more customers to alternate channels. In an emergency, more customers may be impelled to turn to alternate channels such as mobile and social media to receive faster turnarounds on claims. Insurers could also use these channels to warn customers about impending disasters, as a way of mitigating risk. Though extreme weather poses serious threats, insurers have tools at their disposal, such as analytics, to predict catastrophic events and the incidence of claims, which help them better manage the event and overcome risks, positioning the company with a competitive advantage.
New Entrants
Many companies with little or no background in insurance see opportunity to bring greater transparency and simplicity to the processes of researching and purchasing insurance. These
companies have inherent advantages that may position them as threats to existing insurers. The U.S. discount retailer Walmart, for example, plans to market health insurance plans online and through its stores to its massive existing loyal customer base7, an effort that could fracture existing ties insurers have with their customers and distributors. Insurers are also wary of high-tech firms like Google or Amazon, which could parlay their expertise in areas such as search engines and one-click shopping to the insurance arena. Google has in fact made some inroads in this direction with the acquisition of an aggregator website BeatThatQuote.com in the U.K. region. Other pursuits of Google such as driverless cars, Google Glass, and automated home technology are likely to have huge implications on the insurance industry.
The threat of competition from new, innovative entrants should propel insurers to aim higher in terms of developing more personalized products and delivering them through convenient, digital channels. Opportunities exist for insurers to take
advantage of in-house customer data to develop products that reflect improved risk profiling and the impact of customer life events. Insurers may also want to consider forming strategic alliances with non-traditional players to broaden their expertise in areas such as product distribution and development and gain access to better risk profiling.
Economic Uncertainty
Five years on from the financial crisis, the global economy still is not back to its pre-crisis form, raising the specter of an ongoing strain on insurance profit margins. In addition, the persistent global financial pressure may cause consumers to curtail their purchases of cars and homes, thus lessening demand for basic insurance products. Near-zero interest rates in several developed markets also have a significant impact on insurers’ investment returns.
Increasing uncertainty about profit margins could have a significant impact on product line-ups. Insurers may want to simplify their existing product lines so that it becomes easy for customers to understand these products better and thereby enable sales through direct channels or develop niche products for which they can charge higher premiums. In addition, consumer demand for various products may shift based on prevailing economic conditions, creating the need for insurers to flexibly respond with both safer fixed-income products and higher-return, equity-linked products. Finally, dampened buying behavior by consumers may lead insurers to develop new products built around evolving consumer models. An example of one such model is the car-sharing service, Zipcar.
With rising economic uncertainty, insurers will feel greater pressure to increase operational efficiencies and reduce the time to market for new products. They may also want to optimize their distribution channels by pushing simpler products toward alternate channels as a way of reducing costs, while utilizing the agency network to leverage the potential for cross-selling and up-cross-selling. All in all, financial pressures will likely encourage insurers to become bolder about choosing and executing upon a particular strategy-be it in product innovation, operational improvement, or channel distribution-to overcome the profit pressures of financial instability.
Regulatory Change
One outcome of the global financial crisis has been a comprehensive examination of supervisory practices, accompanied by a raft of new guidelines and requirements for insurance firms and their holding companies. New sets of complex regulatory and reporting standards are affecting all aspects of the business, including financial reporting, capital financing, consumer protection, risk management, exposure, transparency, and others. This regulatory change is occurring at the national, global, and regional levels.
In some cases, the regulatory burden could be onerous enough to cause insurers to alter existing products or even stop offering certain ones altogether. At the very least, many insurers expect to introduce changes in product design and pricing in response to impending regulatory requirements. Insurers will need to understand how regulatory changes will impact the business and long-held processes, and ensure they have the technical knowledge and expertise to properly implement the new rules, as well as put in place appropriate measures for ongoing control
and governance. They will need to have systems and distribution channels that are flexible enough to incorporate the regulatory changes and also adapt to future ones. For well-prepared insurers, the massive amount of regulatory change offers an opportunity to assess and upgrade current reporting functions and enterprise risk management, as well as evaluate whether new talent is needed.
Internet of Things
The internet, already a source of lasting impact on the insurance industry, will continue to act as a major disruptor as it evolves to incorporate the Internet of Things (IoT). Any type of natural or man-made object can become part of the IoT network and have the ability to transfer data over it. Under such a scenario, devices such as heart monitors, car engines, and stress gauges on bridges, will be able to transmit real-time status information to data stores where it can be analyzed.
Access to all this data could fundamentally alter the insurance business by providing a much more detailed view of an insurer’s exposures and risks. Insurers Figure 3.2 Disruptors with Maximum Impact on Insurance Industry (%), 2014
1% 1% 4% 2% 7% 8% 18% 14% 25% 20% 5% 6% 7% 7% 10% 7% 7% 7% 16% 27% 3% 3% 4% 12% 5% 8% 10% 21% 5% 31% 9% 10% 15% 21% 22% 23% 35% 42% 46% 78% 0% 20% 40% 60% 80%
New Risk Perceptions Social Media Extreme Weather Events Internet of Things New Entrants Mobile Applications Changing Demographics & Millennials Financial / Economic conditions Increased Regulatory Oversight Big Data Analytics
Rank 1 Rank 2 Disruptors with Maximum Impact on Insurance Industry (%), 2014
Rank 3
“Regulators aim to protect the consumer, which is laudable, but there are now multiple regulators with sometimes conflicting agendas. This creates much difficulty for us.”
- CIO of a Leading Insurance Firm in Europe.
“Statistics, better risk profiling and the huge amount of information that can be retrieved from users’ experience or obtained from the web and social networks will enable a change in the logic of the definition of pricing: from static conventional variables to dynamic behavioral variables” - Filippo Sirotti (CEO, Quixa) “Changing demographics
change the expectations of what is required from insurance cover. Newer generations and the impact of austerity have created a different attitude to risk and what customers may be happy to cover for them selves. Customers are more savvy and more willing to trade. New generations in particular have different values and priorities. Insurance is not as high a priority – but once they buy it then they expect to get more in return.”
- Matthew Thomas Director Strategy and Planning Ageas UK
could use this data to redesign or re-price products to make them less risky and more profitable. Further, by developing a robust, multi-channel feedback loop with customers, insurers will be able to act upon the data they receive and potentially reduce losses. The IoT will no doubt tax the ability of insurers to store, model, and analyze all the data it generates. Privacy issues will also likely arise, perhaps leading to more burdensome regulations. But for insurers who embrace these challenges, the IoT offers the potential to expand the level of detail related to every aspect of the business, from product design and pricing, to underwriting, service, and claims.
Largest Disruptor of All is Analytics
A common denominator in all of these forces is the powerful impact that data analytics can have on illuminating both the risks and opportunities relevant to each disruptor. In every case, analytics based on Big Data can be used to identify threats and minimize the incidence of loss. In fact, industry executives identified Big Data analytics as having the greatest impact on the insurance industry, with 78% ranking it as one of the top 3 disruptors, well above increased regulatory oversight, which was ranked by 46% of executives (see Figure 3.2). In North America, insurers believe analytics will have more impact on the insurance industry than any other disruptor. In Europe and Asia-Pacific, insurers ranked it as a close second. Because of its reach, analytics has the potential to change the very nature of the business. Several insurance executives
expect analytics to enable a change in their pricing models that are currently based on static conventional variables to more accurate and dynamic behavioral variables. Given its expected impact on pricing, underwriting, and the business in general, insurers must begin sharpening their expertise and skills in analytics in short order.
QUICKENING TRENDS POINT TO ADDITIONAL VULNERABILITIES
Insurers may be in the business of identifying and minimizing risks, but that does not make them immune to outside forces. The disruptors outlined in the previous section make insurers vulnerable to several trends in the near future, all of which have the potential to undermine the business, if no counterbalancing measures are taken.
Rising Consumer Expectations
Consumers have become accustomed to the idea of instant gratification through the web, as capabilities like one-click shopping, instant downloads, and immediate access to a person’s full social network become the norm. The rapid-response service consumers receive from other providers has heightened the expectations they have of their insurers, making it only natural that they should start to demand capabilities like personalized insurance products and location-based awareness. Among other demands, customers expect simpler procedures for choosing, paying for, and renewing policies, and
Figure 3.3 Importance of Seamless Channel Experience (%), 2014 2.0% - Not Important at all
4.2% - Somewhat Unimportant 1.3% - Unimportant 22.2% Important 14.7% Very Important 26.8% Neutral 28.8% Somewhat Important
quicker claims processing through improvements such as photo and video estimating, ease of uploading documents and proofs, mobile-based payments and receipts, automated assignment of claims to an adjuster, and straight-through processing.
Meeting the higher expectations of consumers will require insurers to place greater value on customer perceptions. Insurers will need to review, and potentially revamp, every angle of the insurance process from the customer perspective. Better visibility on pricing, quicker problem resolution, improved privacy protections, and greater product choice will be among the priorities of customers in this new environment. To better compete, insurers must be prepared to make the necessary investments to becoming fully customer centric.
Changing Channel Preferences
Non-traditional channels, not only the internet, but also mobile and social media have already had a large impact on insurance sales and distribution. Over time, growth in these alternate channels is expected to continue to expand, both organically and at the expense of traditional channels. And even though in-person agents will remain relevant to the sales process, alternate channels, such as video, e-mail, text, and social media, will increasingly be used to supplement their interactions.
Currently, social media accounts for a small portion of insurer transactions. Most insurers (85%) view it more as a vehicle for improving and building their brand image. But many other value-added focus areas exist, including connecting agents with customers and providing a feedback loop for customer opinions. Aside from supporting a wide range of channels, insurers need to ensure customers can move seamlessly between channels and receive consistent service across all of them. More than two-thirds of the customers noted that it is important for their insurer to offer a seamless channel experience (see Figure 3.3). Among the customers who received a seamless channel experience from their insurer, 51.3% of them were satisfied with the level of service being offered. The positive experience levels of customers who were satisfied with the seamless channel experience offered by their insurer are quite high at 72%. Offering high-quality, seamless channel service is a highly effective strategy that can enhance customer experience significantly.
Entry of Non-core Insurance Players Consumer companies that have built up large customer bases through their online or digital
platforms have the ability to enter the insurance space free from the burden of legacy platforms. Such companies could lure away potential new customers, presenting a considerable threat. The Japanese shopping site, Rakuten, for example, is leveraging its well-established customer connections and advanced digital servicing capabilities to offer insurance policies over the internet at very low premiums. Alternatively, insurers could band with new types of competitors, entering into strategic alliances that would draw upon the strengths of each firm. Already, such alliances have taken on multiple forms. American Family Insurance in the United States has teamed with Microsoft to support startups that specialize in advancements leading to safer and smarter homes. Allstate Canada has teamed with a provider of home monitoring and security to offer a 25% discount to customers who install the system.
Coles, one of the largest supermarket chains in Australia, which began offering car insurance in 2010, has recently entered the life insurance space as well. While its car insurance is issued by Wesfarmers insurance, the life insurance partnership is with MetLife. Due to its vast customer reach, Coles has been successful in increasing the number of insurance policies sold on a regular basis. As of May 2014, Coles has signed up more than 330,000 insurance customers while its rival supermarket, Woolworths, has close to 125,000 insurance customers. Such alliances illustrate the need of insurers to be open to the possibilities of the services that outside providers can offer. Emergence of Niche Insurance Products
New business models and markets are leading to the emergence of unknown risks. The advent of driverless cars, for example, raises questions around liability. In the event of driverless accidents, liability could shift to manufacturers and software providers, creating the need for a new type of insurance product. Similarly, growing cyber-security threats are increasing the need for new types of cyber insurance. Other factors, like rising air pollution and the expanding use of e-cigarettes, may potentially trigger liability claims in the future, though the exact level of risk related to these factors is still unknown. Insurance firms that can accurately assess and price these new types of risks will have a competitive advantage as these niche insurance products emerge.
Risk Mitigation Technologies
Industries including automotive, health care, and home security are exploring the use of various technologies to help them reduce consumer risks. Over the next several years, carmakers are expected to develop and make available a wide range of
risk-mitigating technologies, including telematics aimed at delivering safety services directly to cars, and collision avoidance systems aimed at reducing the severity of accidents (see Figure 3.4). These technologies have the multiple benefits of minimizing risks, while also providing insurers with information that can be used to sell more personalized products and increase customer intimacy. Our research found that 65% of customers would let insurers monitor their driving behavior in exchange for reduced premiums based on positive risk assessments.
Advancements in health care are similarly making it possible for insurers to monitor the health of their customers. For example, fitness bands and other types of wearable technology can be used to detect physical changes or unhealthy behaviors. Despite data privacy concerns, a majority of customers (56%) are willing to allow insurers to track their health conditions in return for reduced premiums in the case of a positive
risk assessment. The Vitality Group, a member of South Africa based Discovery Holdings Limited, is an early innovator in this field, granting customers premium discounts and other rewards for improving their health and fitness.
More than 50% of non-life customers are willing to allow insurers to monitor their driving habits in return for better risk assessment and personalized advice, while nearly two-thirds of them would allow insurers to do so in return for a reduced premium for a positive risk assessment (see Figure 3.5). Several insurers have already begun to leverage telematics for this purpose while others are likely to follow suit in the near future. Finally, technology in the form of smart home systems is also affecting insurers. Such systems detect the risks of floods, fires, gas leaks, and burglaries, triggering real-time alerts to customers and insurers. Ideally, such systems will work on a proactive basis to
Figure 3.4 Expected Timelines for Adoption of Risk Mitigation Technologies in Auto Industry
2012 2013–2017 Mandatorya Telematics Robot/Driverless Cars Robot/Driverless Cars Collision Avoidance Automated Traffic Law Enforcement Collision Avoidance Automated Traffic Law Enforcement Preferredb Voluntaryc Availabled 2018–2020 2023–2027 Telematics Collision Avoidance Automated Traffic Law Enforcement Robot/Driverless Cars
Automation of enforcement of traffic laws (obeying stoplights and stop signs, driving within posted speed limits or according to prevailing conditions, etc.) is being done by technologies such as automatic red light cameras and stoplight cameras Automated
Traffic Law Enforcement
With the introduction of robot or driverless cars, insurance industry is likely to experience a major shift in product designing as number of accidents could come down. This is likely to have a huge impact on motor insurance industry
Auto manufacturers have built several different collision avoidance systems and identified the ones that have had a significant impact on reducing the amount, and severity of accidents Usage based insurance for the wireless
technology that delivers safety services, route information, and entertainment to motor vehicles
Telematics AvoidanceCollision
System
Robot / Driverless
Cars
Note: a. Government requires new vehicles and retrofitted older vehicles to have telematics and/or various collision avoidance technologies, and installs the environmental hardware/systems to make automated traffic law enforcement work; b: Positive or negative incentives promote use; c: Decision based on individual vehicle owners; d: The technology exists