Study of Water Allocation for Existing and Future Demands
under Changing Climate Condition: Case of Upper Awash Sub
River Basin
Tajin Kerim1 Adane Abebe2 Behailu Hussen 3 1.Rift valley lakes basin authority Po.Box 2162, Hawassa,Ethiopia
2.Department of Water Resources and Irrigation Engineering, Arba Minch University, PO box 21, Arba Minch, Ethiopia
3.Water Resources Research Center, Arba Minch University, PO box 21, Arba Minch, Ethiopia Abstract
The main aim of this study is to study the existing and future water availability under climate change in upper awash sub-basin which contributes significant flow to Koka dam and also on water allocation of the existing and planned water resource projects (irrigation, hydropower, industries, livestock etc.) in the upper awash. HEC-HMS hydrologic model is used to assess the water availability of sub-basin. The future stream flow forecasted in the sub-basin were simulated by the dynamically downscaled A1B scenarios known as RCP 4.5 (Representative Concentration Pathways) has been adopted from CORDEX archive and bias correction were done by using power transformation equation before using in HEC-HMS model. The result of future water availability from 2006 to 2031 in sub-basin was found to be nearly 1001 MMC. The Water Evaluation and Planning System (WEAP) model is used for optimal water allocation for existing and proposed water resource projects using the monthly based data in both the demand side and supply sides and by priority setting situation for demand sites. The reference period used for the simulation ranges from 1981-2009 while the future scenario period ranges from 2006-2031.The monthly water requirement for each crop mainly sugarcane is estimated using Cropwat 8.0 software by adopting Penman Monteith approach and crop coefficient of the crop. The existing irrigation projects were around 95,155 ha while in the future scenario period the irrigable land expected to increase by 21,103 ha. According to reference scenario the downstream irrigation project shows the highest supplied volume about 479.4 MCM annually. According to future scenario period the UV1 and UV3 irrigation projects shows increasing water demand from the refinance period by about 203.5 and 357.5 MCM annually due to expansion of the irrigation projects. The annual water demand and supplied for the reference period found to be 1716.3 MCM while the demand increases to 1953.3 MCM for the future scenario with no unmet demand.
Keywords: Upper Awash, Climate Change, RCP, HEC-HMS; WEAP, Koka Dam, Scenario development,
Water requirement. Introduction
Climate is a key factor in water supply and water resource planning. Climate change affects the function and operation of existing water infrastructure including hydropower, structural flood defenses, drainage and irrigation systems as well as water management practices. Assessing the possible impact assessment is important to know climate change impact on water resources.
Precipitation is one of the most important hydrological variables of the basin. In particular, it greatly influences the amount of water flowing through the water cycle and water availability. In general, the higher the precipitation, the more water is available; low precipitation and drought generally reduce water supply. Similar to precipitation, temperature is another important parameter in assessing the climate change impact on water resource system. According to climate model predictors, using several scenarios of greenhouse gas emissions, global mean temperature probably will increase from 1.1 to 6.4ocin the next 100year (IPCC, 2007).
The Awash basin is the most developed area with more than 60% of the potential irrigable area has been developed. In the Upper Awash valley the sugar corporation (ESC) intensively utilizes most its developed land. The horticulture development corporation (HDC) farms in the upper valley suffer some shortfalls in developed land use and efficient water utilization, apparently constrained by shortage of labor, machinery and sometimes water. The ESC at Wonji-Shewa and Metehara are the dominant state farms pre-existed and holds the major portion of irrigable land.
An increasing developmental interest and of Awash River basin will consequence to near future water shortage in the existing demands. This opinion is supported by the hydrologic variability of the river flow due to climatic variations and the increasing sedimentation rate of Koka reservoir. Still now the water availability of the basin depends on Koka reservoir capacity. But after the accomplishment of Kesem and Tendaho dams the middle and lower awash valleys can get a considerable relief of water availability. According to previous water availability studies (Booker Tate and WWDSE) of Upper Awash sub-basin the water released from Koka reservoir cannot sustain the existing and future irrigation demands via current water management.
Water allocation studies are feasible for basins with multiple water demands and scarce water resource conditions under changing of climate to meet the existing demands. Multiple irrigation water users relatively in the country were found in upper awash sub basin.
In upper awash sub basin, due to the rapid economic and population growth; the demand of water is increasing time to time. As a result, in order to bring sustainable development and to achieve the development
goals it’s important to evaluate the existing water resource and to develop new operation scenarios for future use. The output of the study will help to maximize the economic, social and environmental benefits of the society. Study Area and Data Availability
Description of the study area
Ethiopia has 12 river basins, the total mean flow from the 12 river basin is estimated to be 122bcm (Awulachew
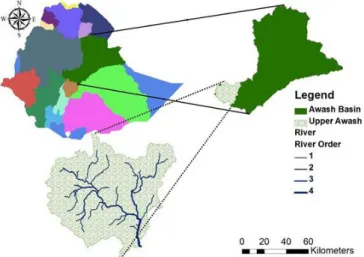
et al.., 2012). The Awash Basin is situated between latitudes 7°53′N and 12°N and longitudes of 37°57′E and 43°25′E in Ethiopia (Fig. 1).
Figure 1: Location Map of Upper Awash Sub-basin.
The study area covers a total land area of 110,000 km2of which 64,000 km2 is in western section of the basin. This section of the basin drains to the Awash River or its tributaries. The remaining 46,000 km2, most of which comprises the so-called Eastern Catchment drains into a desert area and does not contribute to the Awash River course. The Awash River has a length of 1200 km and begins at an elevation of about 3000 m in the central Ethiopian highlands, west of Addis Ababa and flows through Koka Reservoir, to north-eastwards along the Rift Valley until eventually discharging into the wilderness of the Danakil Depression at Lake Abe 250 m above sea level at the border of Ethiopia and Djibouti.
The landscape of the basin comprises highlands, escarpment and rift. The main physiographic features of the Awash Basin are the Ethiopian Plateau and the Rift Valley that widens to the north into the Afar Triangle. The topography of the Ethiopian Plateau is generally flat with elevations ranging from 2000 m to 2500 m (Azazh, 2008). However, there are deeply incised river valleys, and volcanic masses rising to 3000 m. In the Rift Valley, the alluvial plains adjacent are relatively wide, extending to over 25 km in some parts. The Rift Valley is seismically active and there is a history of earthquakes.]
The mean annual rainfall varies from about 1600 mm at Ankober, in the highlands north east of Addis Ababa to 160 mm at Asayita on the northern limit of the Basin. Addis Ababa receives 90% of its annual rainfall during the rainy period March to September. At Dubti the same overall proportion is received during the two rainy periods, distributed 30% and 60% respectively. The mean annual rainfall over the entire Western Catchment is 850 mm and over the headwaters of the Awash, as gauged at Melka Hombole it is 1216 mm. Over the Eastern Catchment the mean annual rainfall is estimated to be 456 mm. The annual and monthly rainfalls are characterized by high variability. Mean annual temperatures range from 20.8 0C at Koka to 29 0C at Dubti, with the highest mean monthly temperatures at these stations occurring in June, at 23.8 C and 33.6 C respectively.
The land use/cover (LULC) of Upper Awash Basin consists mainly of cultivated agricultural land, grass land and shrub land, which cover 93.2% of the total area; about 3.6% is covered by savanna and the remaining 3.2% comes from the other land cover types.( Mussa, 2011).
Figure 2: Land Use Land Cover Map of Upper Awash Sub-basin. Methodology
In this research, one of the objectives is to simulate the hydrologic process of the upper awash sub river basin to evaluate the trend of water availability under changing climate by simulating rainfall-runoff process. To achieve this objective the following procedures were used.
The Digital Elevation Model (DEM) is the very basic data that is required to start the of a watershed. A DEM can be defined as a database or a file that contains the elevation data in digital form that describe the topological surface of an area. The morphological characteristics of the upper awash sub basin were derived using the DEM data of the basin and those derived characteristics were used as input for the purpose investigating rainfall- runoff process. To achieve this objective ArcGIS watershed delineations tools were used.
The GCM precipitation data which is in larger scale was downscaled to finer resolution which means to sub-basin scale using bias correction. Using HEC-HMS simulation model the rainfall-runoff relationship will be investigated, meteorological, hydrological, GCM output and catchment characteristic data derived from DEM
were the data’s used.
Once the amount available water and the existing water demand of the study area was known using Water Evaluating and Planning (WEAP) model the optimal water use strategies can be set considering climate change & water allocation regulation scenarios. The water use evaluation model were used to assess the impact of climate change, current and planned likely water development projects in Upper Awash sub-basin and allocate future likely optimal water use policy for the projected amount of supply and demand for the sub basin.
Figure 3: General Conceptual Frame Work of the Study
Meteorological data Hydrological data DEM GCM output
Hydrological simulation (HEC-HMS) RCM data
RCM bias correction
Water use demand data Current and future water use
Set optimal water use strategies based on climate change and water allocation
Data collection
Data required for the project will be collected based on the availability of data and decisions need to be made. In general, meteorological, hydrological data, water demand data as well as demographic, topographic, economic, and ecological information were collected. After the collection of the required data quality control were performed on the available data mainly preliminary checking, plotting, and removal of errors by spatial and temporal consistency checks in order to ensure the quality of the data for further investigation.
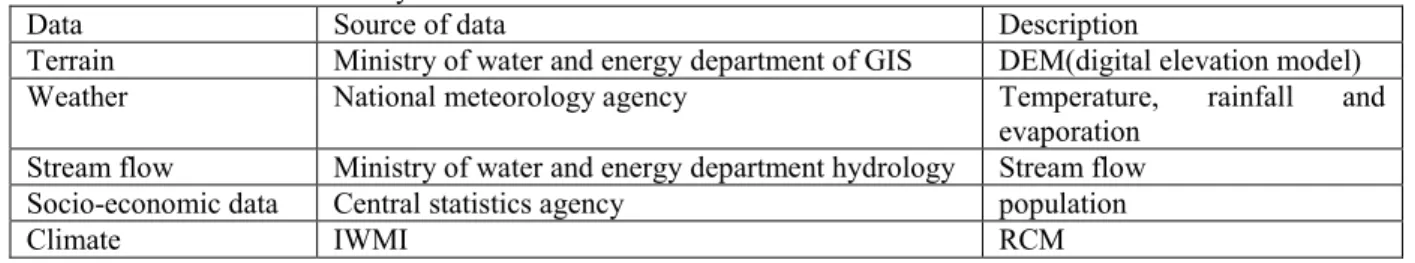
Table 1: Data used for the study
Data Source of data Description
Terrain Ministry of water and energy department of GIS DEM(digital elevation model) Weather National meteorology agency Temperature, rainfall and
evaporation Stream flow Ministry of water and energy department hydrology Stream flow Socio-economic data Central statistics agency population
Climate IWMI RCM
Data analysis Filling Missing Data:
The missing data is estimated by using the data of the neighboring stations. In this calculation the normal rainfall is used as a standard of comparison. The normal rainfall is the average value of rainfall at particular date, month or year over a specified 30 years period (K.Sabramanya, 1984). Considering the normal precipitations vary considerably, the missing precipitation Px is estimated by weighing the precipitations at various stations by the ratio of normal precipitation. The normal ratio method is as given equation 1;
(1) Where,
N1, N2, Nn =Normal annual rainfall,
P1, P2, Pn =Precipitations at particular years, M=Number of neighboring stations.
Test for consistency of precipitation (Double-mass analysis):
The trend of the rainfall records at a station may change through time due to a change in the physical environment which affects the catchment of the gauge due to change in the wind pattern or exposure .The consistency of records at the station in question is tested by a double mass curve by plotting the cumulative annual (or seasonal) rainfall at the station against the concurrent cumulative values of mean annual (or seasonal) rainfall for a group of surrounding stations, for the number of years of record . From the plot, if any change occurs, is indicated by the change in slope of the straight line plot, the rainfall records of the station are adjusted by multiplying the recorded values of rainfall by the ratio of slopes of the straight lines before and after change in environment. In the watershed each rainfall station annual records was tested against surrounding stations and are consistent temporally. All tests were undertaken after missed data were filled.
Determination of Areal Rainfall:
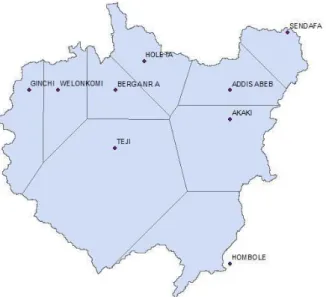
Areal is the average rainfall over an area, and is referred to as the areal rainfall distribution and is restricted to long-term average values. It is expressed as a mean depth (mm) over the catchment area (Elizabeth M., 1994).Thiessen polygons were used to derive the areal precipitation over the Sub-basin from rain gauge measurements. These were the standard methods of the arithmetic mean and the Thiessen polygon. Thiessen polygon method was used to estimate weighted precipitations both observed and future scenario dataset of the sub-basin. Figure 4shows Thiessen polygon areal proportion of each selected stations in the sub-basin.
Figure 4: Thiessen polygon of sub-basin: The areal rainfall R is given by equation:
(2) Where;
Ri = The rainfall measurements at n rain gauges Ai = Corresponding to the rain gauge stations and A = The total area of the catchment.
Preparation of Time Series Data:
Some data such as daily precipitation and gauged flow is prepared using HEC-DSSVue model in daily time step for HEC-HMS model use. These data was used for calibration and validation simulations. The WEAP model of rainfall-runoff method determines evapotranspiration for irrigated and rain fed crops using crop coefficients. The remainder of rainfall not consumed by evapotranspiration is simulated as runoff to a river, or can be proportioned among runoff to a river and flow to groundwater via catchment links.
Determination of Evapotranspiration: Potential evaporation was computed using the
Penman Monteith method, which has been applied successfully in different parts of the world, was compared with other methods and is accepted as the preferred method for computing potential evaporation from meteorological data. Evapotranspiration, one of the factors that may create a soil deficient, thus controls the run-off generation from the subsequent storms. The method of calculating potential evapotranspiration depends on the data available. Monthly time step, evapotranspiration was estimated since monthly values change little from year to year; mean monthly values will usually be adequate.
The reference evapotranspiration is assessed in the ETo calculator software from meteorological data by means of the FAO Penman-Monteith equation (Equation 4.4). This method has been selected by FAO as the reference because it closely approximates grass ETo at the location evaluated, is physically based, and explicitly incorporates both physiological and aerodynamic parameters (FAO, 2010).The FAO Penman-Monteith equation (Allen et al., 1998) is given by:
(3) Where;
ETo = reference evapotranspiration [mm day-1], Rn = net radiation at the crop surface [MJ m-2 day-1], G = soil heat flux density [MJ m-2 day- 1],
T = mean daily air temperature at 2 m height [°C], U2= wind speed at 2 m height [m s-1],
es= saturation vapour pressure [kPa], ea= actual vapour pressure [kPa],
es-ea= saturation vapour pressure deficit [kPa], ∆= slope vapour pressure curve [kPa °C- 1], γ= psychometric constant [kPa °C-1] Water Demands Estimations
Determination of Irrigation Requirement:
Irrigation water requirements were computed based on current irrigation uses practices and future climate scenarios. Cropwat 8.0 software was used to compute the total net crop irrigation requirements and demands from existing or new climatic and crop data. To compute the water requirement, the crops were selected based on field assessment, irrigation inventory data conducted by MoWR & WWDSE. These crops were used to estimate crop water requirement and to assess climate change impact on crop water requirement in quantitative change or variation of demands between baseline and future scenario periods of irrigation in the sub-basin. Irrigation requirements were computed for baseline scenario (1980-2009) and the future climate change driven requirements for (2006-2031) projected years of GCM climate dataset (A1B emission scenarios) were computed. Livestock Consumption:
It is the livestock consumption that uses directly the sub-basin water and was considered not changing to the future scenario .The data was collected from local agricultural offices adjacent to the sub-basin.
Instream flow requirement (E-flow through Awash River):
Instream flow requirements are used to represent established or new regulatory requirements of minimum flows in a river. These data objects are placed on the river and are assigned a priority and minimum flow value that must be maintained during a specified period. In-stream flow requirements can vary in time, so one can characterize a temporally changing regulatory environment, making it possible to make the in-stream flow requirements a higher priority and simultaneously raise the minimum standard of flow at any given time in the simulation (Yates et al, 2005).
Table2: Long period (1980-2009) monthly minimum flow of Awash River (m3/s).
Month Jan Feb Mar Apr May Jun Jul Aug Sep Oct Nov Des Flow 1.27 0.24 0.83 1.21 1.21 1.78 11.18 18.92 8.51 2.94 2.26 1.21 Modeling Analysis
Hydrologic Modeling Setup:
The hydrologic system was assumed to be lumped model, in the lumped model the system is spatially averaged such that all the characteristics of the system are given an average value disregarding their areal distribution in the system. Lumped systems cannot account for the spatial variability of the characteristics of the watershed like soil type and land use and tend to use the average value. For example in the lumped model, the watershed is assumed to receive a uniform precipitation overlooking the internal spatial variation of watershed precipitation (Chow et al., 1988).The sub-basin, which has a total drainage area of 7556.0 km2.
The hydrologic model for the sub-basin has been developed using HEC-HMS, a U.S. Army Corps of Engineers (USACE) Hydrologic Engineering Center model, to simulate the precipitation-runoff processes of dendritic watershed systems. Here it was been applied for translating climate change projections into flow generation and forecasting. The HEC-HMS model for the sub-basin was calibrated and validated using selected years of daily precipitation and observed flow of similar time in daily step. The calibrated model was then used to simulate the future inflow to the sub-basin using projected precipitations considering all losses.
Watershed Delineation:
For hydrologic model development, the sub-basin was delineated upstream of the Hombole River gauging station whose observed stream flow data were used during model calibration and validation. The delineation was done using HEC- GeoHMS, which is the geospatial hydrologic modeling extension. HEC-GeoHMS works in an ArcView Geographic Information System (GIS) platform and helps develop hydrologic modeling units and generate initial model parameters that can be derived from spatial data. It analyzes the digital terrain information and transforms drainage paths and watershed boundaries into a hydrologic data structure. The model capabilities include data processing to derive watershed and stream characteristics, developing an HEC-HMS basin model with a hydrologic schematic of the watersheds, and background map file for the model. The processed hydrologic information includes maps that can then be imported to HEC-HMS where the hydrologic model is developed.
Hydrologic Model Development:
Geo-HMS to create basin boundaries, a stream network, and extract basin physical properties from the digital elevation data (DEM) and imported to HMS 4.0 used to perform hydrologic model simulation. The HEC-HMS basin model includes hydrologic characteristics of the watershed derived from DEM. HEC-HEC-HMS incorporates various component models to simulate watershed response to precipitation. Selection of these component models depends on the type of application and data availability. In this particular application, Soil Moisture Accounting loss method and Snyder unit hydrograph model is used to simulate rainfall-runoff process. Losses in HEC-HMS collectively refer to interception, infiltration, storage, evaporation, and transpiration. The monthly constant method included in the HEC-HMS model was used to simulate base flow draining from natural storage in the watershed. An input data used to the model are monthly evapotranspiration computed by Montheth-Pennman method, monthly base flow and time series of climatic data from stations in the sub-basin.
Hydrologic Modeling System (HEC-HMS) developed by the Hydrologic Engineering Center from US Army Corps Engineers is used to simulate the precipitation and runoff processes in the watershed systems. HMS computes the runoff by calculating the water volume that is infiltrated, intercepted, stored, evaporated, or transpired and subtracting it from the precipitation (US Army Corps, 2000). HEC-HMS includes several mathematical models which are appropriated under different conditions and environments.Public domain software of HEC-family HEC-GeoHMS and HEC-HMS are used to model the hydrology of the sub-basin. The HEC-GeoHMS was used to create background map files, basin model files, meteorological model files and a grid cell parameter file which is used by HECHMS to develop the hydrologic model.
In this study, Hec-GeoHMS was used to delineate sub basin catchment and derive river and stream networks in the sub-basin.
Model Setup Model Structure:
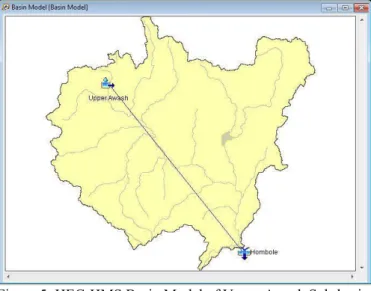
In the continuous model setup the Basin Model were treated since it is contributing to the sub-basin. They have gauges nearly at the inflows to the Awash River.
Figure 5: HEC-HMS Basin Model of Upper Awash Sub-basin.
Canopy method, Surface method and Rainfall Loss method were used to model the hydrologic process in the sub-basin. The Snyder unit hydrograph method was chosen for this model in order use time-series precipitation data in daily time. Constant Monthly Base flow is the simplest base flow model in HEC-HMS. It represents base flow as a constant flow; this may vary monthly. This user-specified flow is added to the direct runoff computed from rainfall for each time step of the simulation. The meteorology component was used spatially and temporally model precipitation and evaporation processes in the basins. Evaporation is one of the loss components included in the continuous model simulation. Thiessen polygon weighted precipitation of the nine sub-catchments method (Gauge weights) was used to weigh the rainfall distribution for the selected stations. Hydrological model Calibration and Validation
Calibration of hydrologic models is an integral part of model development because the reliability of model predictions depends on it. Calibrated models need to be tested with new data to determine their operational validity. Validation is to verify the capability of the model to produce accurate predictions for periods outside the calibration periodhence, helps refine the calibration process. Calibration of the model with appropriate data is a crucial step in the creation of a reliable basin representation. Watershed parameters such as infiltration coefficients, time of concentration, and base flow may need modification to produce a best fit between model
and observations. Discharge output from a rainfall–runoff model is generally calibrated with observed stream flow).
The basis for calibration problem is to identify or find the optimal values of model parameters by minimizing the deviation between the computed output variables(simulated flow) and the outputs measured in the physical system (observed flow). The input data are precipitation and measured flow. The output is total runoff.
Projected Climate Change Modeling
The emission scenario A1B of period of 1980–2031, downscaled was used in this research work. The RCM data of long time (1980-2031) is used to model the hydrology and water resources in order to assess the climate change impacts on the sub-basin water system. The general methodology followed to evaluate climate change impacts on the sub-basin water resource is as follows.
The GCM downscaled to the watershed level precipitation was extracted at the grid nodes for the required period. Using observed meteorological data, precipitation and stream flows, the hydrological model is calibrated and validated, and was forced with downscaled GCM scenario of period of( 2006-2031) to produce stream flows for the used GCM scenario precipitation.
The future simulation (2006-2031) was carried out with the downscaled and bias corrected RCM precipitation data to generate the future flows of the river and overland flows from the adjacent catchment. WEAP Upper Awash Sub-basin Schematic Setup
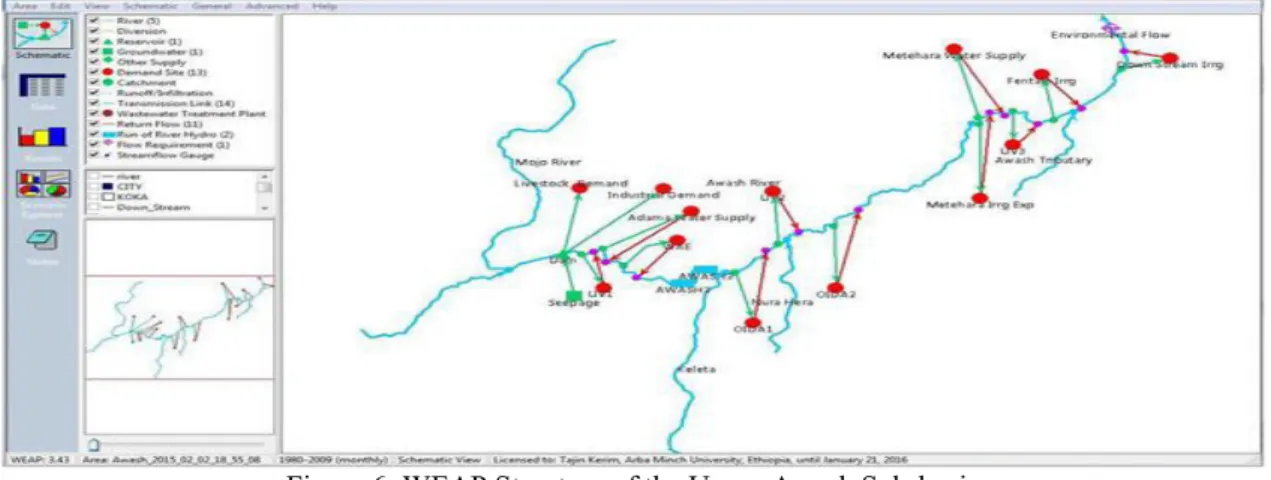
Water Evaluation and Planning (WEAP) model was developed as a water resources system model and provides a seamless integration of both the physical hydrology of the region and water management infrastructure that governs the allocation of available water resources to meet the different water needs. It is a priority driven software, employs priority based optimization algorithm as an alternative to hierarchal rule based logic that uses a concept of equity group to allocate water in time of inefficient supply. The WEAP structure for entire water system of the Sub-basin is shown Figure below.
Figure 6: WEAP Structure of the Upper Awash Sub-basin
The supplies of the system are the major perennial Rivers Awash, runoff from catchment adjacent to the Sub-basin and precipitation on the Sub-basin itself. Monthly discharge data have been implemented in WEAP. The supplies are historical conditions from the recent past (i.e.,1980-2009) observed data of flows at gauging site of the river at Hombole and precipitation of on the Sub-basin and runoff estimation from adjacent catchment, at the same period (1980-2009) assuming or considering they are available to allocations after satisfying demands in the sub-basin . These historical data were used to construct a baseline scenario that represents current water use conditions.
As stated previously HEC-HMS hydrologic model was used to simulate and generate the future flows from the Awash River. WEAP model was used to estimate and simulate adjacent catchment which is recorded. The supplies from the river were provided as head flow (m3/s), monthly constant, and the overland flow from the adjacent catchment directly to the sub-basin.
Baseline Scenario
It goes from the base year 1981 up to 2009.This scenario simulated the current water resource developments and abstractions till 2031. In this scenario, the ones that are currently in demand such as irrigation (the major demand), urban water supply, local uses and the environmental balance on the outflow Awash River were used to establish assess to assess the optimality of the water current uses and used reference for others and future scenarios. Yearly supply and demand balance were performed until 2009 considering the reliability of water
resource availability and balance on the current development water demands. Future Scenarios
All these demand-supply simulation scenario targets future expansion and developments of irrigated that would likely to be implemented in the future. The developments of new irrigation schemes increase the water demand abstraction from the Sub-basin. The increased irrigation will be the main water demand than other consumptives because of its economic potential in the area.
Result and discussion
Performance of HEC-HMS Model
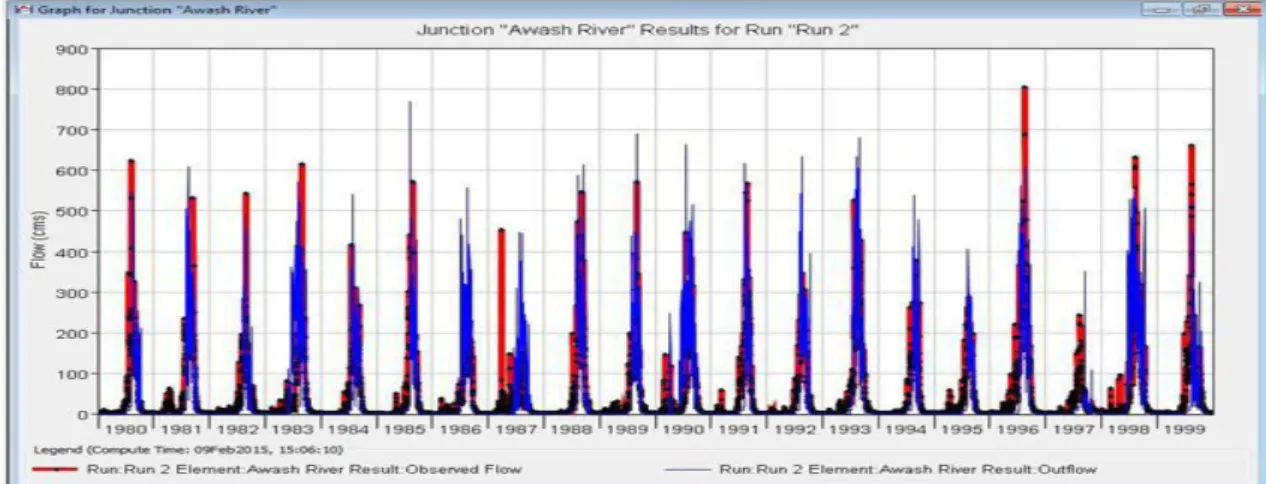
HMS has the capabilities to process automated calibration in order to minimize a specific objective function, such as sum of the absolute error, sum of the squared error, percent error in peak, and peak-weighted root mean square error. However, in many cases, the resulted automated parameters are not reasonable and practical. In this study, manual calibrated method was adopted to determine a practical range of the parameter values preserving the hydrograph shape, minimum error in peak discharges and volumes. For Awash River, historical time series data of 1980-1999 used for calibration and data of a period of 2000-2009 is used for validation. Validation for this study was used to determine the effectiveness of the calibrated parameters in predicting the flow discharges at Upper Awash Sub-basin. The Awash River element calibration and validation graphs of simulations are presented on Figures below.
Figure 7: Awash River calibration graph. Trend of Forecasted Flow
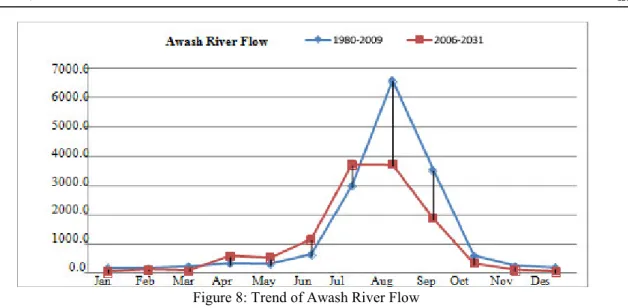
The HEC-HMS flow generation of future GCM scenario emission of RCP 4.5data underestimates the generated discharge relative to control period or historical flow (1980- 2009) that might be due to decrease in precipitation. The mean generated flow was decreased by 288.8 for the Sub-basin in the period of 2006-2031. This decrease could be due to uncertainties of GCM (single chosen RCP 4.5 emission scenario) carried over to the future runoff such as decrease in intensity and variability.
The ECHAM5 driven GCM model shows a trend towards wetter annual conditions over most parts of Ethiopia and Kenya that shows a large increase in discharge during the first months of the year (especially January to March), and a further large increase during the peak of the high discharge season (August-September) .But specific to Sub-basin, the increase is July to September.
Figure 8: Trend of Awash River Flow Trends of Rainfall and Temperature For Past And Future
In the upper Awash sub river basin precipitation increases in the period of 1971-2000 and decreases in the period of 2011-2040 for the selected RCP4.5.
Figure 9: Mean Monthly Rainfall 1971-2000 and 2011-2040 Current Water use Evaluation
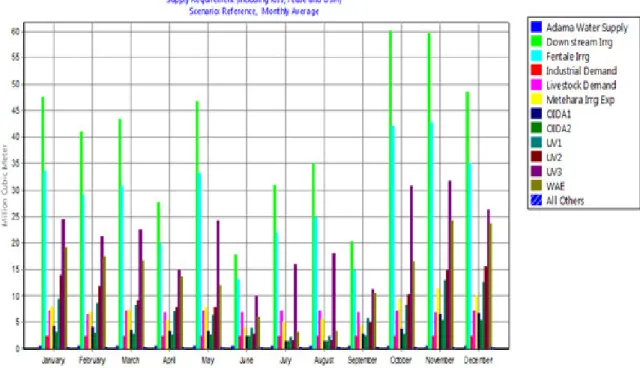
The WEAP analysis was made for the years of 1981-2009.Estimated demands monthly varying average demand of all users in the Sub-basin was used for demanding sited. All irrigation demands are computed based on current conditions. Irrigations direct from the Sub-basin outstrips all other demands such as urban water supply, industrial demand, irrigations on the rivers and livestock consumption.
The total net amount of water required to meet the irrigation demands of all the sites up to 2009 is 1716.3mm3.October and November months with maximum demand requirements than other months.
Figure 11: Monthly average demands (without including losses) of Future Scenario.
From the above simulated results the total water demand for future scenario in nearly twice of the current scenario. UV3 irrigation project is the future demand site with maximum water demand next to downstream irrigations. The above computed water demand did not include the over losses of the particular systems.
The entire supply requirements including losses for the current and future scenarios will be described in the tables below with their respective figures below.
Figure 13: Supply Requirement for future scenario Allocation of Delivered Supplies
As stated in the previous topic there is no high risk of water shortage if the demand condition continues with the current abstraction rate. According to this analysis there is full required supply coverage for both the current and future scenarios. The delivered amount of water is allocated for each demand site as per to the required quantity and the priority set in the model, with no unmet rate. The delivered quantity of water with demand site allocations for both the current and future scenarios are described in tables below with their respective figures.
Figure 14: Monthly average supplies delivered for all demand sites in current scenario
From the analysis high quantity of water is delivered from months January to May and October to December with pick delivery at June, whereas the less quantity of water is delivered at Feb.
Figure 15: Monthly average supplies delivered at all demand sites for the future scenario Conclusion and Recommendation
Conclusion
According to the results obtained from HEC-HMS model the flow at Hombole gage station shows a significant change between the future scenario (2006 – 2031) and base period (1980 – 2009). In the base period the annual volume of water is about 1347.9 MCM while in the future period the value significantly decreased to1001 MMC mainly due to the selected RCP 4.5 emission scenario. As a result the water availability in upper awash sub basin shows substantial reduction for future scenario.
The water demand for irrigation sites are determined by using Cropwat 8.0 and Penman- Monteith approach is adopted. Most of the irrigation sites grow sugarcane and vegetables. The monthly demands shows increase in dry seasons while the demands decrease in rainy seasons due to abundant water from rainfall. The demand for industry, livestock and water supply were adopted from 2005 Ministry of water resource report.
In this research, WEAP model is used for optimal allocation of water to demand sites after assessing all current uses and future plans considering the impact of climate change on demands sites particularly on irrigation projects. The annual water demand for the reference period is about1716.3 MCM while the demand increases to 1953.3 MCM in the future scenario this is mainly due to expansion of the existing irrigation projects which intern increase the water demand of the projects. The minimum environmental flow is also considered in both reference and future period to keep the ecology of the whole river course.
Prior the allocation of the water available, different priority is given to different sector based on the primacy of the sector. In this study the highest priority of one is given for water supply projects, livestock and minimum environmental flow and priority of two and three were given for irrigation projects and industrial demand respectively. Lastly, the available water allocated for each sector in both reference period and future scenario based on the priority given with no unmet demand and 100% reliability.
Recommendation
This research investigates the effect of climate change on water availability and optimal allocation for different sectors and the result from WEAP model shows, the impact of climate change has significant effect on water availability for future scenario up to 2031 since climate change induced irrigation demands to increase and water loss through evapotranspiration. Based on the results obtained in this research the following options are recommended for future study:
· Climate change impact on water resources availability should be studied with number of climate scenarios to overcome the uncertainty of using a single climate scenario.
· The irrigation technique used in the study area should be changed to better or efficient methods to minimize the water lost in the system.
· To minimize the future water requirement of the irrigation projects it’s advisable to use crops which
have low water requirement.
· Other supply options such as utilization of ground water, rain water harvesting for waters supply projects or irrigation purpose should be studied in detail in order to use in conjunction with the surface water.
will affect the quantity of water that can be used from the river. References
1. Azazh. B., 2008. Waters Allocation Study of Upper Awash Valley for Existing and Future Demands (From Koka Reservoir to Metehara Area). Addis Ababa University (M.Sc. Thesis).
2. Chow, V.T Maidment, D.R and Mays, L.W (1988). Applied hydrology, McGraw-Hill book company, USA
3. FAO. (Food and Agriculture Organization of the United Nations). (2010.)Global Forest Resources Assessment Main report, FAO Forestry Paper 163, Food and Agriculture Organization of the United Nations, Rome,
4. IPCC, 2007: Climate Change 2007. Synthesis Report. Contribution of Working Groups I, II and III to the Fourth Assessment Report of the Intergovernmental Panel on Climate Change [Core Writing Team, Pachauri, R.K and Reisinger, A. (eds.)]. IPCC, Geneva, Switzerland, 104 pp.
5. K. Subramanya., 1984. solution manual to engineering hydrology 3rd edition.
6. Mussa Kurkura, June 2011. Water balance of upper awash basin based on satellite derived data (remote sensing).
7. Seleshi B. Awulachew, Vladimir Smakhtin, David Molden and Don Peden, 2012. The Nile River basin: water, agriculture, governance and livelihoods, International Water Management Institute (IWMI), Colombo, Sri Lanka.
8. Yates. D., Sieber. J., Purkey. D., 2005. WEAP 21- a demand-, priority-, and preference driven water planning model. Part 1: model characteristics. Water Int 30, 487–500.