Review
Estimating Kinetic Parameters From Dynamic
Contrast-Enhanced T
1
-Weighted MRI of a Diffusable
Tracer: Standardized Quantities and Symbols
Paul S. Tofts, DPhil,
1*
Gunnar Brix, PhD,
2David L. Buckley, PhD,
3Jeffrey L. Evelhoch, PhD,
4Elizabeth Henderson,
5Michael V. Knopp, MD,
6Henrik B.W. Larsson, MD,
7Ting-Yim Lee, PhD,
5Nina A. Mayr, MD,
8Geoffrey J.M. Parker, PhD,
1Ruediger E. Port, MD,
6June Taylor, PhD,
9and Robert M. Weisskoff, PhD
10 We describe a standard set of quantity names and symbolsrelated to the estimation of kinetic parameters from dy-namic contrast-enhanced T1-weighted magnetic resonance imaging data, using diffusable agents such as gadopen-tetate dimeglumine (Gd-DTPA). These include a) the vol-ume transfer constant Ktrans (minⴚ1); b) the volume of extravascular extracellular space (EES) per unit volume of tissue ve (0FveF1); and c) the flux rate constant between EES and plasmakep(minⴚ1). The rate constant is the ratio of the transfer constant to the EES (kepⴝKtrans/
ve). Under flow-limited conditionsKtrans equals the blood plasma flow per unit volume of tissue; under perme-ability-limited conditions Ktrans equals the permeability surface area product per unit volume of tissue. We relate these quantities to previously published work from our groups; our future publications will refer to these stan-dardized terms, and we propose that these be adopted as international standards. J. Magn. Reson. Imaging 10: 223–232, 1999.r1999 Wiley-Liss, Inc.
Index terms:Gd-DTPA; permeability; perfusion; transfer con-stant; rate concon-stant; extravascular extracellular space
MANY WORKERS have modeled the dynamic enhance-ment data that can be generated by repeated (dy-namic)T1-weighted imaging of tissue after injection of gadopentetate dimeglumine [previously known as Gd-DTPA (1)] or other Gd-labeled tracers of similar size and pharmacokinetics (2). A set of T1-weighted images is acquired, (· late phase imaging (50)) starting before a short (bolus) injection, and continued as uptake by the tissue and usually washout from the tissue are ob-served. The signal in a region of interest (ROI) or pixel can give information about blood flow, capillary leak-age, and related physiological parameters. A variety of quantities (some of them physiologic) have been esti-mated; often the same quantity appears with a different name or symbol in different reports, so that comparison of work from different groups is almost impossible. There is increasing interest in making measurements that are reproducible between different MR centers, and it is now accepted that parameters such as relaxation times, diffusion coefficient, and volume can be mea-sured with good absolute accuracy in different centers. We propose this standardization of quantities associ-ated with analysis of dynamic contrast-enhanced MRI as part of building up a common language for the estimation and description of the physiologic quantities that determine the dynamic behavior of contrast agents. We are specifically concerned with agents that are diffusable (ie, can pass out of the capillaries), and that remain extracellular (ie, are non-lipophilic) ie type 2 agents (50). Our goal in this is to clarify the parameters that can be useful in describing the uptake of Gd(III)-based contrast agents, because imaging this uptake has been shown to be clinically feasible and useful in predicting or measuring response to therapy in human tumors. Thus we exclude from the present discussion both very large molecules that remain intravascular, and also freely diffusable tracers such as labeled water and most gaseous tracers, which penetrate cells.
We gathered a group of authors who are experts in the basic science and/or clinical application of the MR tracer kinetic models. There has been a new surge of 1Department of Clinical Neurology, Institute of Neurology, University
College London, London WC1N 3BG, United Kingdom.
2Department of Medical Radiation Hygiene, Federal Office of Radiation
Protection, 85764 Neuherberg, Germany.
3University of Florida, Department of Neuroscience, Gainesville, Florida
32610-0245.
4Wayne State University School of Medicine, Harper Hospital MR
Center, Detroit, Michigan 48201.
5Imaging Research Laboratories, Robarts Research Institute, London,
Ontario, N6A 5K8, Canada.
6German Cancer Research Center, D-69120 Heidelberg, Germany. 7Danish Research Center of MR, Hvidovre University Hospital, Dk-2650
Hvidovre, Denmark.
8Division of Radiation Oncology, Department of Radiology, University of
Iowa College of Medicine, Iowa City, Iowa, 52242.
9Department of Diagnostic Imaging, St. Jude Children’s Research
Hospital, Memphis, Tennessee 38105.
10MGH-NMR Center, Harvard University, Charlestown, Massachusetts
02129.
Contract grant sponsor: Multiple Sclerosis Society of Great Britain and Northern Ireland.
*Address reprint requests to: P.S.T., Institute of Neurology, Queen Square, London WC1N 3BG, UK. E-mail: [email protected] Received July 12, 1999; Accepted July 13, 1999.
interest in the quantification and the assessment of efficacy and clinical utility due to the improvement of spatial and temporal resolution of the MR equipment. There is an urgent need to have a standardized nomen-clature and quantification. Many publications, includ-ing those by the authors, report their results usinclud-ing different tracer kinetic models and terminology. With the rapid proliferation of research in this new and exciting field, a standardized nomenclature and quanti-fication will facilitate understanding and development in this field.
With better quantification methodology and MR in-strumentation, the estimation of each parameter is now approaching the ‘‘true’’ (absolute) values underlying the pathophysiologic processes that are being measured. Although we can continue to improve the calculations of the ‘‘true’’ values, they will ultimately be limited by the complexity of the underlying pathophysiology and the variations of techniques. However, even with very primi-tive methodologies and quantification, there is prelimi-nary evidence that tracer kinetic modeling can be a potentially powerful tool in the management of cancer, stroke, and heart attack. That means that with continu-ing improvement of the tracer kinetic models, there will be significant improvement and expansion of its clinical utility. Therefore, a unified nomenclature and quantita-tion will be essential to facilitate these processes.
Here we propose a standard set of quantities, names, and symbols, with a view to achieving a global consen-sus on terminology. We have given alternative terms where these are in use. We show the relationship between these quantities and previously published work from our groups. We have moved to be consistent with long-standing work from the areas of flow measurement using non-NMR tracers (3–9) and pharmacokinetics (10,11) where possible, although these bodies of work contain some terminologic incompatibilities that can-not be resolved. We have aimed to be as model indepen-dent as we can (although many of the quantities have an implicit simple model of tissue behavior built into the definition of the quantity). In future publications we will adhere to these standardized terms (or their alterna-tives) in reporting our results, and where we use the alternatives, we will define them with respect to the standards.
STANDARDIZED QUANTITIES
We give proposals for standardized terms here (Table 1) a detailed discussion of the reasons for our choices is given in Appendix A.
Most methods of analyzing dynamic contrast-en-hanced T1-weighted data have used a compartmental analysis to obtain some combination of the three prin-ciple parameters: the transfer constant (Ktrans), the extravascular extracellular space (EES) fractional vol-ume (ve), and the rate constant (kep). The transfer constant and the EES relate to the fundamental physiol-ogy, whereas the rate constant is the ratio of the transfer constant to the EES:
kep⫽Ktrans/ve. (1) The rate constant can be derived from theshapeof the tracer concentration vs time data, whereas the transfer constant and EES require access toabsolute valuesof tracer concentration.
The transfer constant Ktrans has several physiologic interpretations, depending on the balance between cap-illary permeability and blood flow in the tissue of inter-est. In high-permeability situations (where flux across the endothelium is flow limited), the transfer constant is equal to the blood plasma flow per unit volume of tissue:
Ktrans⫽F(1⫺Hct) (PS:F) (2) (see Mixed Flow . . . section below; F and Hct are defined in Table 2). In the other limiting case of low permeability, where tracer flux is permeability limited, the transfer constant is equal to the permeability sur-face area product between blood plasma and the EES, per unit volume of tissue (2):
Ktrans⫽PS (PS9F) (3) (see Mixed Flow . . . section below).
Tracer flows passively from the blood plasma in a permeable capillary into the EES, through microscopic pores or defects in the capillary walls. This has also been called the ‘‘interstitial water’’ or ‘‘interstitial space.’’
Table 1
Three Standard Kinetic Parameters (See Also Appendix A)
Symbol Preferred short name Units Full name Alternatives Discontinued terms
Ktrans Transfer constanta min⫺1 Volume transfer constant between
blood plasma and EES
EF, FE, CLd/Vtb k,kPS
kep Rate constant min⫺1 Rate constant between EES and
blood plasma
k21, k2, 1/c
ve EESd None Volume of extravascular extracellular
space per unit volume of tissuee
Interstitial space, leakage space
aIf permeability is high (PS:F, ie, Kety model), this is the blood plasma flow per unit volume of tissue (Ktrans⬇F(1⫺Hct)). If permeability is
low (PS9F), this is the permeability surface area product per unit volume of tissue, for transendothelial transport between plasma and EES (Ktrans⬇PS).
bEF is the extraction flow product;CL
d⫽clearance. ck
21: see ref. 23;k2see refs. 17 and 22; 1/see ref. 26. dEES⫽extravascular extracellular space.
Note that ‘‘extravascular’’ is included in the term, to exclude specifically the blood plasma space (which is technically part of the whole extracellular space).
Therate constant kepis formally the flux rate constant between the EES and blood plasma (2). Both the trans-fer constant and the rate constant have the same units (min⫺1) and can easily be confused. The rate constant
kepis always greater than the transfer constantKtrans. For a range of typical EES fractional volumes seen in tumors and multiple sclerosis (ve⫽20%–50%), kep is two to five times higher thanKtrans(see Eq. [1]).
Other working quantities are shown in Table 2, and MRI quantities in Table 3. We suggest that these be used whenever possible to describe models and to report results, in order to facilitate communication and sim-plify the problem of comparing work between groups. MODELING TISSUE UPTAKE
OF A DIFFUSABLE TRACER
We summarize the principal approaches to physiologic and pharmacokinetic modeling that have been used, in enough detail to support the tables of parameters. More details, including the MRI aspects, are summarized elsewhere (2,9,12–15). We start with the simple, stereo-typical cases of endothelial tracer flux being limited
purely by flow or purely by permeability, before consid-ering the more complex case of being limited by both flow and permeability. All the models we consider are simple two-compartment ones (ie, blood plasma and EES); they ignore both the contribution of intravascular tracer to the total tissue concentration and the possibil-ity of further compartmentation within the voxel. How-ever, they do enable common ground between diverse approaches to be identified.
Flow-Limited (Kety) Model (High Permeability)
Kety (3,9,13) produced a model of flow-limited tracer uptake in tissue that has been used extensively. It was developed for the case of breathing an inert gas, which distributes into the whole tissue, including the intracel-lular spaces. Its first assumption is that arterial and venous blood have well-defined concentrations, supply-ing and drainsupply-ing the tissue under study. Second, be-cause permeability is high, venous blood leaves the tissue with a tracer concentration that is at all times in equilibrium with the tissue. Thus, soon after injection of the tracer, the arterial concentration is high, the venous concentration is low, and most of the tracer is being removed from the blood as it passes through the tissue. For an extracellular tracer, the Kety model can be extended by setting the venous concentration equal to that of the EES. The effect of intravascular tracer on the MR signal is ignored (ie, the vascular signal is small compared with the tissue signal). In this case the following differential equation relating tissue concentra-tionCtto arterial plasma concentrationCpis obtained (see Appendix B, Flow-Limited Kety model):
dCt
dt ⫽F(1⫺Hct) (Cp⫺Ct/ve). (4)
Note that the other quantities in this equation (F,,H, andve) are constants for the tissue (Tables 1 and 2).
PS-Limited Model (Low Permeability)
If flow is high, the blood plasma can be considered as a single pool, with equal arterial and venous concentra-tions. The transport of tracer out of the vasculature is slow enough not to deplete the intravascular concentra-tion. The rate of uptake is then determined by the permeability surface area product of the capillary wall and the difference between the blood plasma concentra-Table 2
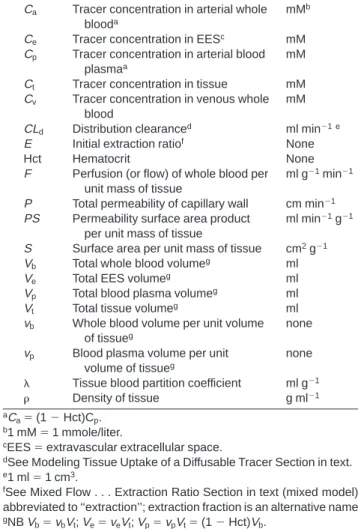
Working Quantities (See Appendix A)
Quantity Definition Unit
Ca Tracer concentration in arterial whole
blooda
mMb
Ce Tracer concentration in EESc mM
Cp Tracer concentration in arterial blood
plasmaa
mM
Ct Tracer concentration in tissue mM
Cv Tracer concentration in venous whole
blood
mM
CLd Distribution clearanced ml min⫺1 e
E Initial extraction ratiof None
Hct Hematocrit None
F Perfusion (or flow) of whole blood per unit mass of tissue
ml g⫺1min⫺1
P Total permeability of capillary wall cm min⫺1
PS Permeability surface area product per unit mass of tissue
ml min⫺1g⫺1
S Surface area per unit mass of tissue cm2g⫺1
Vb Total whole blood volumeg ml
Ve Total EES volumeg ml
Vp Total blood plasma volumeg ml
Vt Total tissue volumeg ml
vb Whole blood volume per unit volume
of tissueg
none
vp Blood plasma volume per unit
volume of tissueg
none
Tissue blood partition coefficient ml g⫺1
Density of tissue g ml⫺1
aC
a⫽(1⫺Hct)Cp. b1 mM⫽1 mmole/liter.
cEES⫽extravascular extracellular space.
dSee Modeling Tissue Uptake of a Diffusable Tracer Section in text. e1 ml⫽1 cm3.
fSee Mixed Flow . . . Extraction Ratio Section in text (mixed model);
abbreviated to ‘‘extraction’’; extraction fraction is an alternative name.
gNBV
b⫽vbVt;Ve⫽veVt;Vp⫽vpVt⫽(1⫺Hct)Vb.
Table 3 MRI Quantities
Quantity Definition Unit
R1 Relaxation rate (⬅1/T1) sec⫺1
R10 Native relaxation rate (⬅1/T10) sec⫺1
r1 T1relaxivitya sec⫺1mM⫺1
T10 Native T1b sec
⌬R1 Change in relaxation rate caused
by tracera
sec⫺1 aThe realaxtivity is the increase in relaxation rate per unit
concentra-tion of tracer; thus ⌬R1 ⫽ r1Ct; R1⫽ R10 ⫹ ⌬R1 ⫽ R10 ⫹ r1Ct
(assuming all the tracer is in fast exchange with the tissue water).
bThe native T
tion and the EES concentration. If the contribution of tracer in the intravascular space is ignored, the trans-port equation is then (2,16) (see Appendix B, Permeabil-ity-Limited model):
dCt
dt ⫽PS(Cp⫺Ct/ve) (5) Mixed Flow- and PS-Limited Model:
Extraction Ratio
Tracer uptake may be limited by both blood flow and permeability. The extraction ratio E (11) was first de-fined by Renkin (4); it is the fractional reduction in capillary blood concentration as it passes through tis-sue [E⫽(Ca⫺Cv)/C a]. The initial extraction, when there is no backflow from EES to blood plasma, is a constant that characterizes a particular tissue and tracer combination. However, as the tissue concentra-tion builds up after injecconcentra-tion, backflow increases, and the extraction ratio decreases (4,17). Larsson et al (17) have called thisE(t). In factE(t) becomes negative when there is a net tracer flow back into the blood. Although theE(t) is thus not a constant for a particular tissue and tracer, the initial extraction Eis an appropriate index that does characterize the tissue. The transport equa-tion is (see Appendix B, Mixed Flow . . . secequa-tion):
dCt
dt ⫽EF(1⫺Hct)(Cp⫺Ct/ve). (6)
Kety (in ref. 3, p. 19) modeled the absorption of an inert gas from alveoli into capillaries; Renkin (4) clarified leakage of a blood-borne tracer into the interstitium. Modifying his approach to take account of the tracer being extracellular (Appendix B, Mixed Flow . . . Sec-tion), we find that the initial extraction ratio isE⫽1⫺ exp [⫺PS/F(1⫺Hct)] (see Eq. [21]). Previous workers have omitted the (1⫺Hct) factor, which is required
because F is the flow of whole blood. Thus, in the
flow-limited case (PS:F), the extraction is complete (E⫽1) and the transport equation reduces to the Kety equation (Eq. [4]). In thePS-limited case (PS9F),E⫽ PS/F(1⫺Hct), and the equation reduces to Eq. [5].
St. Lawrence and Lee (13) have made a more complete analysis using a distributed parameter model, based on the approach of the Johnson and Wilson model (18); this includes capillary flow, permeability, and transit time.CaandCtmust both be measured with sufficient temporal resolution (about 2 seconds) to detect tracer entering and passing through the capillary bed. (Thus intravascular tracer has to be completely visible). The four independent parametersF,vb,E, andvecan then all be estimated (withEuncoupled fromF), and hence
PSbecomes available.
Clearance Model
Clearance (CL) is defined in pharmacokinetics as the constant of proportionality that relates the rate of elimi-nation of a drug from a compartment to the current drug concentration (11). The clearance can be
under-stood as the volume that is completely cleared of the drug in unit time. Distribution clearance CLd can be defined in a similar way, for two connected compart-ments (see Appendix B, Clearance Model section); with the further assumption that intravascular tracer can be ignored, we obtain (Appendix B):
dCt
dt ⫽ CLd
Vt
(Cp⫺Ct/ve). (7)
The clearance per unit volume of tissue CLd/Vt and the EESvedetermine the pharmacokinetic behavior.
Generalized Kinetic Model
Equations [4–7] are all of the same form:
dCt
dt ⫽K
trans(C
p⫺Ct/ve)⫽KtransCp⫺kepCt. (8) Thus, for a variety of models (all of which ignore the contribution of intravascular tracer to tissue concentra-tion), we expect tissue tracer to behave in the same way. This is behavior is determined by only the blood plasma concentration and two additional parameters, the trans-fer constantKtransand the EES fractional volumev
e[or, alternatively,Ktransand the rate constantk
ep(⫽Ktrans/
ve]. The transfer constant can be physically interpreted as follows. From Eqs. [4–7] we see that the transfer constantKtrans⫽F(1⫺Hct) under flow-limited condi-tions,Ktrans⫽PSunder PS-limited conditions,Ktrans⫽
EF(1⫺Hct) under mixed conditions, and in the drug clearance paradigmKtrans⫽ CL
d/Vt. The general solu-tion to Eq. [8] is given in Appendix B, Generalized Kinetic Model section, along with the response to bolus and step arterial inputs, and the residence time. We show that the rate constantkepis the exponential decay constant for tissue concentration that would result if the arterial concentration could be instantaneously raised from zero to a constant value, or dropped to zero (Eqs. [27 and 28]). It is also the mean residence time for tracer in the EES after a bolus arterial input.
MRI TECHNIQUES TO CHARACTERIZE TRANSCAPILLARY TRANSPORT
OF CONTRAST AGENTS
A number of groups have characterized capillary leak-age from MRI signal changes after injection of low molecular weight Gd(III) contrast agents. This work has been reviewed in detail elsewhere (2,9,13,15). It is difficult to compare the work of various investigators because the techniques vary in the injection procedure, in the MRI sequences and protocols, in the modeling of the MRI signal from a given tissue tracer concentration, whether pharmacokinetic modeling has been attempted, and the treatment given to intravascular tracer. How-ever, we have shown that there are a limited number of fundamental parameters that characterize the tissue and that are MRI accessible. These are the three defined in Table 1 (ie,Ktrans,v
e,kep) and possiblyF,PS, andvb(or
close they come to measuring these quantities accu-rately.
We now define how published estimates of parameters are related to the standard physiologic parameters used here. In London Tofts and Kermode (16), studying multiple sclerosis lesions, estimated the transfer con-stantKtrans(calling itk) and the EES (calling it leakage spacev1). Data from breast tumors were also analyzed (19). In a more recent review (2), Tofts called the transfer constant kPS. In Copenhagen Larsson and coworkers
(20), also studying multiple sclerosis, estimated the rate constantkep(calling itEF/v). Measurements of transfer constant were also reported briefly (21). More recently, myocardial perfusion has been measured (17,22). In Heidelberg Brix and coworkers (23), studying a brain tumor, estimated the rate constant kep (calling it k21) and a constantA, which is proportional to the transfer constant and other factors (2). Hoffman, Brix, Knopp, and coworkers, studying breast tumors (24), estimated the rate constant and a redefined constantA, which is proportional to the EES and other factors (2).kep was estimated for Gd-DTPA in malignant and benign mam-mary tumors by Port and coworkers (25); kinetic hetero-geneity, ie, two or more differentkepvalues acting in the same ROI, was discovered in most of the malignant tumors. In Nottingham, Gowland (26) studied brain tumors and estimated a time constant for transfer across the blood-brain barrier ; from her transport equations we find ⫽1/kep.
Shames and coworkers, in San Francisco, have em-ployed a two-compartment tissue model (plasma and interstitial fluid) fitted to blood and tissue signal inten-sity to estimate PS and the fractional plasma volume in several rat tumors using Gd-DTPA and macromolecular Gd tracers (27,28). Hulka and coworkers, in Boston, estimated the extraction-flow product EF for Gd-DTPA in malignant and benign mammary tumors (29,30). Buckley and coworkers have measured pharmacoki-netic parameters in the breast (31) and prostate (32). Henderson and coworkers measuredF,PS, andvbin
canine mammary tumors using Gd-DTPA and
gadomer-17 (33).
DISCUSSION AND CONCLUSIONS
We could not obtain complete agreement among all the authors of this paper on using a single set of terms for the quantities in Table 1; many of the terms have shortcomings, and different terms may be appropriate depending on the context of the study. Thus alterna-tives have been given. However, we did obtain agree-ment on the meanings of the terms, and their equiva-lences.
The measured transfer constant or rate constant is a potentially intractable combination of flow, permeabil-ity, and surface area. An independent estimate of flow (using spin tagging or bolus tracking) might give infor-mation on whether the tracer flux is flow limited or PS limited (F:Ktransimplies PS limited and Ktrans⫽PS;
F9Ktransimplies flow limited andKtrans⫽F). An inde-pendent estimate of blood volume (using bolus tracking) may give on information on whetherSis changing. In
the PS-limited case, for relatively small molecules such as gadopentetate dimeglumine, alterations in the trans-fer constant may reflect increases in capillary surface area rather than permeability.
Permeability is generally high for such small mol-ecules, with the exception of hydrophilic molecules in healthy brain capillaries. The permeability to larger agents (such as Gd-DTPA albumin) is considerably lower, and these are probably better suited to detecting changes in the leakiness of the capillary endothelium. In tumors we are probably in the mixed flow- and PS-limited case; however, in the brain most cases are PS limited. We have assumed that the transfer constant between blood plasma and the EES is the same in both directions. There is no evidence of unequal transfer constants in the case of low molecular weight Gd(III) contrast agents; if required, equations to deal with this have been given (2).
The contribution of intravascular tracer to the MRI signal remains a problem for the modeling. Data collec-tion is challenging if the first passage is to be temporally resolved. Neglecting it may be appropriate for a diffus-able tracer, as Kety and others have done, since its distribution volume is large compared with the blood volume (34) (ie, we have assumedvb91); however, the approximation is less appropriate for an extracellular tracer, where the distribution volume is smaller (ie, we are assumingvp9ve). Intravascular tracer could then contribute a large proportion of the observed tissue signal and give significant errors in estimates ofKtransif not accounted for in the modeling. In other imaging modalities [eg, x-ray CT (34,45)], an accurate modeling is possible, since all tracer in a voxel contributes to the signal, and moving tracer has the same effect as station-ary tracer.
However, in MRI, intravascular tracer is likely to be in slow or intermediate exchange with tissue water (35,36), making it partially invisible to the tissue water. This reduces its influence on the T1of tissue water, depend-ing on the particular T1-weighted sequence that is used (35). At this point, proton exchange rates in tissues other than the myocardium, particularly in pathologies, are unknown, and so the degree to which tracer in the intravascular space will affect the contrast enhance-ment behavior is also unknown. Tumors and vascular organs such as the liver and the kidney often have high capillary permeability; this may be enough to make the intravascular tracer completely visible and more easily modeled for the flow-limited (Kety) situation. In con-trast, high intravascular concentrations of tracer can dephase signal in the vessel and surrounding tissue, making it safe to neglect. The generalized kinetic model (Eq. [8]) refers to total tissue tracer. In the presence of intravascular tracer this equation should be recast to define the transfer and rate constants explicitly in terms of plasma and EES tracer:
vedCe/dt⫽Ktrans(Cp⫺Ce);dCe/dt⫽kep(Cp⫺Ce). The contribution of intravascular tracer can then be added to form C ⫽ vpCp ⫹ veCe if this is appropriate
(2,17,29,30), or a more complex model such as that described by St. Lawrence and Lee (13) may be used.
Several potential pitfalls in understanding the model-ing literature have been identified here (mostly in Appen-dix A). These include confusion between quantities measured per mass and per volume of tissue (this may include assuming the density of tissue ⫽1 g ml⫺1), confusion between whole blood and blood plasma con-centrations, and confusion between physiologic and pharmacokinetic concepts of extraction. In addition, the extraction ratio expression of Renkin (4) is inappro-priate for an extracellular tracer and has been reformu-lated to include a hematocrit factor (Mixed Flow section, above, and Eq. [21]).
Heuristic enhancement parameters (such as the rate of enhancement, the time to peak, and the peak en-hancement) may have some relation to physiologic parameters (2) although they also depend on the particu-lar MRI sequence parameters (TR etc.). Among these, the dynamic enhancement pattern using the first-pass method with a bolus injection and T1-weighted fast spin echo imaging have been extensively studied by Mayr et al (37–39). This method is easy to implement clinically with a scanning time of only 5 minutes and provides the following parameters: relative signal intensity (RSI) aver-aged over the plateau phase of the dynamic enhance-ment curve, and increenhance-mental rate of enhanceenhance-ment (rep-resenting the slope of the dynamic enhancement curve). Equilibrium distribution of contrast agent between tis-sue and blood pool may not play as an important a role in the first-pass method because the parameters are obtained during the early part of the dynamic contrast study. It is thought that the signal intensity observed early during the first pass (the slope) represents predomi-nantly the concentration of contrast agent in the intra-vascular space, while the peak of the time intensity curve reflects the concentration of contrast agent in both the intravascular and extravascular interstitial space (40,41). Although parameters derived from the first-pass method remain semi-quantitative and do not allow for pharmacokinetic modeling, a significant corre-lation of these parameters and treatment outcome of cancer patients has been established (37–39).
Nonetheless the dependence of such empiric param-eters on experimental and physiologic variables is not completely understood, and their lack of clear physi-ologic significance can make their interpretation diffi-cult. In contrast, estimates of transfer constant, rate constant, and EES are, in principle, independent of the particular MR imager, sequence, and dose procedure used to make the measurements. In practice there will be some variations, depending on how good the method-ology is. For example, insufficient temporal sampling of tissue and blood concentrations can have a large effect on the accuracy and precision of parameter estimates (42). However, the existence of globally agreed standard quantities will encourage research to improve the meth-odology with the aim of producing absolutely accurate measurements. It will also greatly simplify comparison of results from different groups. In the future we antici-pate that absolute measurements of the standard physi-ological parameters defined here will be available and
will form the basis of multi-center intercomparisons and trials (43).
ACKNOWLEDGMENTS
G.J.M.P. is supported by the Multiple Sclerosis Society of Great Britain and Northern Ireland. David Shames gave helpful discussion.
APPENDIX A: REASONING BEHIND CHOICE OF PARAMETER NAMES AND SYMBOLS
We now consider the parameters in Tables 1–3, giving detailed comments on our choice of symbols, terms, and units. We have tried to use parameters that follow on from previous work, that can be clearly distinguished from each other, and that will not lead to typographical ambiguities.
Three Standard Kinetic Parameters (Table 1) Transfer Constant
This term was first used by Patlak (6) and has since been used by various groups employing other imaging modalities (12,44,45). We have formally calledKtransthe ‘‘volume transfer constant’’ to distinguish it from a constant used by earlier workers, which refers to flux per unitmass.The symbolKiwas generally used, since it referred to influx (efflux, or backflow, was often ignored, to simplify the computations). We here use upper case and the superscript to distinguish it from the rate constant (see, eg, ref. 45), both when written and spoken. We retain the subscript to refer to the compartments between which tracer is flowing (eg,kep). We use ‘‘trans’’ rather than ‘‘t’’ to distinguish it from ‘‘tissue.’’ In previous MRI work this parameter has been referred to ask(16) andkPS(2). Larsson and co-workers
have measured the unidirectional influx constant Ki (17,22,46), which is related byKi(1⫺Hct)⫽ Ktrans, a volume of distribution ⫽ve/, and a parameterk2⫽
kep. The transfer constant has also been called ‘‘EF’’ or the extraction-flow product (see below). Some of us prefer not to use this term since we feel that Ktrans is more general, and since EF can be confused with cardiac ejection fraction or MRI enhancement factor. The concept of extraction has to be carefully defined, since it has been used differently in the physiologic and pharmacokinetic literature (see below).
EES ve
The term ‘‘extravascular extracellular space’’ (2,45) re-fers to the space into which tracer can leak from a capillary and has the benefit of specifically excluding the vascular space. ‘‘Interstitial space’’ (or ‘‘interstium’’) has been used for a long time. However, Vehas been used for many years, by Patlak and others (6,7) to denote the volume of this space, and to use a subscript ‘‘i’’ (for ‘‘interstium’’) risks confusion with ‘‘i’’ denoting intracellular space. There may be regions (such as fibrous tissue) that are in the EES yet are inaccessible to tracer. Alternatives would be ‘‘leakage space’’ (16) or
‘‘distribution space.’’ These latter are more technically correct, although they are less well understood by the radiologic and clinical community. We have therefore compromised on usingveto denote the volume of the EES per unit volume of tissue. It is, strictly speaking, a ‘‘volume fraction’’ rather than a volume; it has no units, although expressing it as a percentage may be helpful.
Rate Constant kep
Yeung (45) called this the ‘‘rate constant of backflux from the EES to the plasma.’’ We have used lower case and the subscript to avoid confusion withKtrans. In the Kety approachk21⫽EF/(usingKtrans⫽EF(1⫺Hct) and ve from Eq. [14]). Since it is the ratio of two physiologically more fundamental parameters, there is a case for dispensing withkepand calling itKtrans/ve.
Working Parameters (Table 2)
Tracer concentrationsCa,Ce,Cp,Ct,Cvare all expressed as volume concentrations (mM⫽mmole liter⫺1), not mass concentrations (eg, mmole/100 g) as some
previ-ous workers have used. The alteration in T1 is then
simply related to these volume concentrations (Table 3). We have used whole blood tracer concentrations (Ca,Cv) and blood plasma concentration (Cp). Some workers (6) have usedCato denote the concentration in the arterial blood plasma, which has the advantage of avoiding the (1⫺Hct) term (Hct is the hematocrit; see Table 2), and thus simplifying some expressions. However, flowFis generally measured for whole blood (not plasma), and arterial concentrations determined using MRI are for whole blood, not blood plasma. The subscripts are in lower case, according to widespread previous use (3,6), although some pharmacokinetic work has used upper
case (11). Some workers have used Cb for the mass
concentration in brain tissue (Ct⫽ Cb); its use is dis-couraged since it could be confused with the concentra-tion in the blood. The concentraconcentra-tions are all funcconcentra-tions of time, and can be writtenCa(t), etc.
The extraction ratio E (4,11) has also been called
‘‘extractionfraction’’ (17,28); however, this can lead to confusion with ‘‘EF.’’ Although its physiologic definition (as used in Appendix B, Mixed Flow . . . section) refers to the first pass, in pharmacokinetics it is defined as (Ca⫺Cv)/Cvat any time after injection, and thus de-creases with time (see Mixed Flow . . . section above).
We have retained the convention of F and S being
specified per gram, to follow widespread physiologic and MRI practice. (This arose because the quantity of tissue could most easily be measured by weighing it.) Conse-quently the densityappears in most equations involv-ing these quantities; the flow andPSper volume areF
and PS, respectively. Note that Kety (3) used F to denotetotalflow of blood (ml min⫺1); some workers have usedFto denote plasma flow per unit volume of tissue (this is F(1⫺Hct) in our nomenclature). Absolute volumes (Ve, etc.) are denoted by upper case and frac-tional volumes (ve, etc.) by lower case. The hematocrit Hct is the volume fraction of whole blood taken up by cells. We have already used this term (17). Thus the plasma
fraction is 1 ⫺ Hct. In major vessels Hct ⬇ 0.45;
however, in small vessels it can be as low as 0.21 (34). The partition coefficienthas units of ml g⫺1, because Kety expressed tissue concentration per mass of tissue (see Appendix B, Flow-Limited . . . section). Larsson et al (17,22) used a quantity(⫽ve/), which differs from this by a factor (1⫺Hct) (see Eq. [14]).
Note thatkep,Ktrans,ve, etc. areintensivequantities, which are independent of voxel size (in homogenous tissue), and are suitable for MRI mapping. In contrast,
CLd, Ve, areextensive quantities, which increase with the amount of tissue being considered, and cannot meaningfully be mapped with MRI. Intensive quantities that are per unit mass (such asF) cannot be mapped with MRI, unless the densityis known (or assumed).
APPENDIX B: MODEL DETAILS
Flow-Limited Kety Model (3) (High Permeability)
The rate of tracer uptake in tissue per unit volume of tissue is the difference between arterial influx and venous efflux:
dCt
dt ⫽F(Ca⫺Cv). (9)
(The tissue densityis required because flowF is per unit gram of tissue.) Tissue and venous whole blood are assumed to always be in equilibrium (since permeabil-ity is high); the ratio of mass tissue concentration (Ct/) to arterial whole blood concentration is the partition coefficient:
Ct
⫽ Cv. (10) We have used the mass tissue concentration (Ct/), instead of volume tissue concentration (Ct) for consis-tency with the original treatment of Kety. Then
dCt
dt ⫽ ⫺ F
(Ct⫺ Ca). (11) The original equation published by Kety (3) looks slightly different because mass tissue concentration (Ct/) was used instead of volume concentration (Ct), and because he used total blood flow, not flow per unit mass of tissue. Since venous plasma and tissue EES are in equilibrium, we can derivein terms of veas follows. Ignoring the contribution of intravascular tracer to the tissue concentration (which in any case is unknown sinceCa⫽Cv):
Ct⫽veCe. (12) The venous plasma concentrationCv/(1⫺Hct) equals that in the EES (Ce), ie,
and using Eq. [10], we have
⫽ ve
(1⫺Hct). (14) UsingCa⫽(1⫺Hct)Cp, the Kety equation (Eq. [11]) then becomes:
dCt
dt ⫽F(1⫺Hct) (Cp⫺Ct/ve). (15)
Permeability-Limited Model (High Flow)
Tracer flow into the EES in unit volume of tissue is (16)
ve
dCe
dt ⫽PS(Cp⫺Ce). (16)
We have assumed that permeability is the same for flux into and out of the EES. Again ignoring intravascular tracer,
Ct⫽veCe and
dCt
dt ⫽PS(Cp⫺Ct/ve). (17)
Mixed Flow- and Permeability-Limited Model: Extraction Ratio
Following the approach of Kety (3), we assume tracer flux into the EES is proportional to the difference between plasma and EES concentrations:
dCt
dt ⫽ ␣(Cp⫺Ce) (18)
where␣is a constant to be determined. Initially we can
ignore backflow (Ce⫽0); using Eq. [9], we have
F(Ca⫺Cv) ⫽ ␣Cp⫽ ␣Ca/(1⫺Hct). The initial extrac-tionE⫽(Ca⫺Cv)/Ca; hence␣ ⫽EF(1⫺Hct). Ignoring intravascular tracer,Ce⫽Ct/veand
dCt
dt ⫽EF(1⫺Hct) (Cp⫺Ct/ve). (19)
The original derivation of extraction ratio by Renkin was for a freely diffusable tracer (radioactive K43), which can pass into blood cells (see ref. 4, p. 1208). His equation relating flow and diffusion in a single capillary must be modified for an extracellular tracer:
Q Ca(x)⫽P2r⌬x Cp(x)⫹Q Ca(x⫹ ⌬x) (20) whereQis the blood flow into a single capillary of radius
r and length l, as it passes through a slab of tissue
betweenxandx⫹ ⌬x. SettingCp⫽Ca/(1⫺Hct), and
following his treatment, we find Ca(l) ⫽ Ca(0)
exp [⫺P.2rl/Q(1⫺Hct)],P.2rl/Q⫽PS/F, and
E⫽1⫺e⫺PS/F(1⫺Hct). (21) Since leakage of an extracellular tracer is from blood
plasma,it is appropriate that the arterial blood plasma flowF(1⫺Hct) should be in the expression.
Clearance Model
The distribution clearance,CLd, (47) between two com-partments A and B may be thought of as that volume that, along with its drug content, is transferred from compartment A to compartment B per unit time, while an equal volume, carrying the drug concentration of compartment B, is transferred from compartment B to compartment A. With the further assumption that intra-vascular tracer can be ignored, we obtain:
dAt
dt ⫽CLdCp⫺CLdCe (22)
whereAtis the amount of drug in the tissue. Clearance is related to our previous work (23) using the constants
k12 and k21 as follows: CLd ⫽ Vpk12 ⫽ Vek21. Ignoring intravascular tracer, Ce ⫽ Ct/ve. Since At ⫽ Ct Vt, we have: dCt dt ⫽ CLd Vt (Cp⫺Ct/ve). (23)
Generalized Kinetic Model
The solution to Eq. [8], with the initial conditions that
Cp⫽Ct⫽0 att⫽0, is
Ct(t)⫽Ktrans
兰
Cp()e⫺kep(t⫺)d. (24) (45,48,49). The tissue response to a short arterial pulse of concentration⫽1/(pulse duration), ie, a delta func-tion, ish(t)⫽Ktranse⫺kept. (25)
Thus Ktrans determines the amplitude of the initial response (the amount of tracer that enters the EES), andkepdetermines the washout rate from the EES back into the blood plasma (controlling the time for the impulse to die away). The mean residence time (26) is then:
⫽
兰
0⬁t h(t)dt⁄
兰
0
⬁
h(t)dt⫽1/kep. (26) The response to a step change in arterial plasma concen-tration, from 0 toCp0, at timet⫽0, is
Ct(t)⫽ KtransC p0 kep (1 ⫺e⫺kept)⫽v eCp0(1⫺e⫺kept). (27)
The response to a step change fromCp0to zero is Ct(t)⫽ KtransC p0 kep e⫺kept⫽v eCp0e⫺kept. (28) REFERENCES
1. Mitchell DG. MR imaging contrast agents—what’s in a name? J Magn Reson Imaging 1997;7:1–4.
2. Tofts PS. Modeling tracer kinetics in dynamic Gd-DTPA MR imag-ing. J Magn Reson Imaging 1997;7:91–101.
3. Kety SS. The theory and applications of the exchange of inert gas at the lungs and tissues. Pharmacol Rev 1951;3:1–41.
4. Renkin EM. Transport of potassium-42 from blood to tissue in isolated mammalian skeletal muscles. Am J Physiol 1959;197:1205– 1210.
5. Crone C. The permeability of capillaries in various organs as determined by use of the ‘indicator diffusion’ method. Acta Physiol Scand 1963;58:292–305.
6. Patlak CS, Fenstermacher JD. Measurements of dog blood-brain transfer constants by ventriculocisternal perfusion. Am J Physiol 1975;229:877–884.
7. Ohno K, Pettigrew KD, Rapoport SI. Lower limits of cerebrovascular permeability to nonelectrolytes in the conscious rat. Am J Physiol 1978;235:H299–H307.
8. Herscovitch P, Raichle ME. Positron emission tomographic measure-ment of cerebral blood flow and poermeability-surface area product of water using [15O] water and [11C] butanol. J Cereb Blood Flow
Metab 1987;7:527–542.
9. Evelhoch JL. Tracer measurements of blood flow. In Gillies R, editor. NMR in physiology and biomedicine. San Diego: Academic Press; 1994. p 209–220.
10. Notari RE. Biopharmaceutics and clinical pharmaceutics, 4th ed. New York: Marcel Dekker; 1987.
11. Rowland M, Tozer TN. Clinical pharmacokinetics: concepts and applications, 2nd ed. Philadelphia; Williams & Wilkins; 1994. 12. Fenstermacher JD, Blasberg RG, Patlak CS. Methods for
quantify-ing the transport of drugs across brain barrier systems. Pharmacol Ther 1981;14:217–248.
13. St. Lawrence KS, Lee T-Y. An adiabatic approximation to the tissue homogeneity model for water exchange in the brain: I. Theoretical derivation. J Cereb Blood Flow Metab 1998;18:1365–1377. 14. He ZQ, Eveloch JL. Analysis of dynamic contrast-enhanced MRI in
tumors: relationship of derived parameters with physiologic factors. ISMRM Sydney 1998;3:1652.
15. Parker GJM, Tofts PS. Pharmacokinetic analysis of neoplasms using contrast-enhanced dynamic MR imaging. Top Magn Reson Imaging 1999 (in press).
16. Tofts PS, Kermode AG. Measurement of the blood-brain barrier permeability and leakage space using dynamic MR imaging—1. Fundamental concepts. Magn Reson Med 1991;17:357–367. 17. Larsson HBW, Fritz-Hansen T, Rostrup E, et al. Myocardial
perfu-sion modelling using MRI. Magn Reson Med 1996;35:716–726. 18. Johnson JA, Wilson TA. A model for capillary exchange. Am J
Physiol 1966;210:1299–1303.
19. Tofts PS, Berkowitz B, Schnall M. Quantitative analysis of dynamic Gd-DTPA enhancement in breast tumours using a permeability model. Magn Reson Med 1995;33:564–568.
20. Larsson HBW, Stubgaard M, Frederiksen JL, et al. Quantitation of blood-brain barrier defect by magnetic resonance imaging and gadolinium-DTPA in patients with multiple sclerosis and brain tumors. Magn Reson Med 1990;16:117–131.
21. Larsson HBW, Christiansen P, Stubgaard M, et al. In-vivo calcula-tion of the unidireccalcula-tional influx constant across the blood-brain barrier using MRI. In: Proceedings of the SMRM 9th Annual Meeting, New York, 1990;2:752.
22. Fritz-Hansen T, Rostrup E, Sondergaard L, et al. Capillary transfer constant of Gd-DTPA in the myocardium at rest and during vasodilation assessed by MRI. Magn Reson Med 1998;40:922– 929.
23. Brix G, Semmler W, Port R, et al. Pharmacokinetic parameters in CNS Gd-DTPA enhanced MR imaging. J Comput Assist Tomogr 1991;15:621–628.
24. Hoffmann U, Brix G, Knopp MV, Hess T, Lorenz WJ. Pharmacoki-netic mapping of the breast: a new method for dynamic MR mammography. Magn Reson Med 1995;33:506–514.
25. Port RE, Knopp MV, Hoffmann U, Milker-Zabel S, Brix G. Multicom-partment analysis of gadolinium chelate kinetics: blood-tissue exchange in mammary tumors as monitored by dynamic MR imaging. J Magn Reson Imaging 1999;10:233–242.
26. Gowland P, Mansfield P, Bullock P, et al. Dynamic studies of gadolinium uptake in brain tumors using inversion-recovery echo-planar imaging. Magn Reson Med 1992;26:2412–258.
27. Daldrup H, Shames DM, Wendland M, et al. Correlation of dynamic contrast-enhanced MR imaging with histologic tumor grade: corre-lation of macromolecular and small-molecular contrast media. AJR 1998;171:941–949.
28. Daldrup H, Shames DM, Husseini W, et al. Quantification of the extraction fraction of gadopentetate across breast tumor capillar-ies. Magn Reson Med 1998;40:537–543.
29. Hulka CA, Smith BL, Sgroi DC, et al. Benign and malignant breast lesions: differentiation with echo-planar MR imaging. Radiology 1995;197:33–38.
30. Hulka CA, Edmister WB, Smith BL, et al. Dynamic echo-planar imaging of the breast: experience in diagnosing breast carcinoma and correlation with tumor angiogenesis. Radiology 1997;205:837– 842.
31. Mussurakis S, Buckley DL, Drew PJ, et al. Dynamic MR imaging of the breast combined with analysis of contrast agent kinetics in the differentiation of primary breast tumors. Clin Radiol 1997;52:516– 526.
32. Turnbull LW, Buckley DL, Turnbull LS, Liney GP, Knowles AJ. Differentiation of prostatic carcinoma and benign prostatic hyper-plasia: correlation between dynamic Gd-DTPA enhanced MR imag-ing and histopathology. J Magn Reson Imagimag-ing 1999;9:311–316. 33. Henderson E, Sykes J, Drost D, et al. Measurement of blood flow,
blood volume and capillary permeability in a canine spontane-ous breast tumour model using two different contrast agents. In: Proceedings of the ISMRM 7th Annual Meeting, Philadelphia, 1999;1:148.
34. Brix G, Bahner ML, Hoffmann U, Horvath A, Schreiber W. Regional blood flow, capillary permeability, and compartmental volumes: measurement with dynamic CT—initial experience. Radiology 1999; 210:269–276.
35. Donahue KM, Weisskoff RM, Burnstein D. Water diffusion and exchange as they influence contrast enhancement. J Magn Reson Imaging 1997;7:102–110.
36. Judd RM, Reeder SB, May-Newman K. Effects of water exchange on the measurement of myocardial perfusion using paramagnetic contrast agents. Magn Reson Med 1999;41:334–342.
37. Mayr NA, Yuh WTC, Magnotta VA, et al. Tumor perfusion studies using fast magnetic resonance imaging technique in advanced cervical cancer: a new non-invasive predictive assay. Int J Radiat Oncol Biol Phys 1996;36:623–633.
38. Mayr NA, Yuh WTC, Arnholt JC, et al. Pixel analysis of dynamic contrast MR and [O-15]water PET studies in cervical cancer— significance for tumor heterogeneity and therapy outcome. Radiol-ogy 1997;205(P):525.
39. Mayr NA, Yuh WTC, Zheng J, et al. Prediction of tumor control in patients with cervical cancer: analysis of combined volume and dynamic enhancement pattern by MR imaging. Am J Roentgenol 1998;170:177–182.
40. Fujii K, Fujita N, Hirabuki H, et al. Neuromas and meningiomas: evaluation of early enhancement with dynamic MR imaging. AJNR 1992;13:1215–1220.
41. Maeda M, Itoh S, Kimura H, et al. Tumor vascularity in the brain: evaluation with dynamic susceptibility contrast MR imaging. Radi-ology 1993;189:233–238.
42. Henderson E, Rutt BK, Lee T-Y. Temporal sampling requirements for the tracer kinetics modelling breast disease. J Magn Reson Imaging 1998;16:1057–1073.
43. Tofts PS. Standardisation and optimisation of magnetic resonance techniques for multicentre studies. J Neurol Neurosurg Psychiatry 1998;64 (suppl 1):S37–43.
44. Ianotti F, Fieschi C, Alfano B, et al. Simplified, noninvasive PET measurement of blood-brain barrier permeability. J Comput Assist Tomogr 1987;11:390–397.
45. Yeung WTI, Lee TY, del Maestro RF, Kozak R, Brown T.In vivo
CT measurement of blood-brain transfer constant of iopamidol in human brain tumors. J Neuro-Oncol 1992;14:177–187. 46. Larsson HBW, Stubgaard M, Sondergaard L, Henriksen O. In vivo
quantification of the unidirectional influx constant for Gd-DTPA diffusion across the myocardial capillaries with MR imaging. J Magn Reson Imaging 1994;4:433–440.
47. Port RE, Bachert P, Semmler W. Kinetic modeling of in
vivo-nuclearmagnetic resonance spectroscopy data: 5-Fluorouracil in liver and liver tumors. Clin Pharmacol Ther 1991;49:497–505. 48. Kety SS. Peripheral blood flow measurement, In: Year Book Medical
Publishers; Potter VR, editor. Methods in medical research, vol. 8. 1960. p 223–227.
49. Hawkins RA, Phelps ME, Huang S-C, et al. A kinetic evaluation of blood-brain barrier permeability in human brain tumors with [68Ga]EDTA and positron computed tomography. J Cereb Blood
Flow Metab 1984;4:507–515.
50. Yuh WTC. An exciting and challenging role for the advanced contrast MR imaging. J Magn Reson Imaging 1999;10:221–222.