Cyclic polymer liquid crystal structures.
EVERITT, David R. R.
Available from Sheffield Hallam University Research Archive (SHURA) at:
http://shura.shu.ac.uk/19634/
This document is the author deposited version. You are advised to consult the
publisher's version if you wish to cite from it.
Published version
EVERITT, David R. R. (1990). Cyclic polymer liquid crystal structures. Doctoral,
Sheffield Hallam University (United Kingdom)..
Copyright and re-use policy
POND STREET j
SHEt-FlELD S1 1WB*
100311419 9
lllillllllli
TELEPENSheffield City Polytechnic Library
ProQuest Number: 10694515
All rights reserved
INFORMATION TO ALL USERS
The quality of this reproduction is dependent upon the quality of the copy submitted.
In the unlikely event that the author did not send a com plete manuscript and there are missing pages, these will be noted. Also, if material had to be removed,
a note will indicate the deletion.
uest
ProQuest 10694515
Published by ProQuest LLC(2017). Copyright of the Dissertation is held by the Author.
All rights reserved.
This work is protected against unauthorized copying under Title 17, United States C ode Microform Edition © ProQuest LLC.
ProQuest LLC.
789 East Eisenhower Parkway P.O. Box 1346
CYCLIC POLYMER LIQUID CRYSTAL STRUCTURES
DAVID R R EVERITT, BSc
A thesis submitted in partial fulfilment of the requirements of the Council for National Academic Awards
for the degree of Doctor of Philosophy
October 1990
Department of Applied Physics, Sheffield City Polytechnic in collaboration with the Royal Signals and Radar
550
-LpSI
ABSTRACT
Recent advances in liquid crystal research have included the synthesis of polymeric materials which contain liquid crystalline moieties. The work presented here concerns the study of the structure-property relationships of a particular group of liquid crystalline polymers in which the polymer backbone is cyclic, with the mesogenic moieties attached as side-chains.
We have observed mesogenic phases above room temperature for materials comprising cyclic poly(dimethylsiloxane) backbones with mesogenic moieties attached by alkyl spacer units. Dielectric relaxations have been observed in the mesophases of these materials and the activation energies and extent of broadening of the relaxations have been related to the physical structure of the molecules
Theoretical studies have been undertaken by the use of the Metropolis Monte Carlo technique and a mean field calculation. Two models have been studied by the Monte Carlo technique in the NVT ensemble. In the first, each complete molecule was represented by a disc-like interactions potential and a tendency for the molecules to align in columns was revealed at low temperature and high density. In the second model, each mesogenic unit was represented separately, with the cyclic polymer represented as a constraint on the relative motions of the attached mesogens. A variety of liquid crystalline phases, from discotic nematic to calamitic nematic, were observed at low temperature as the coupling between the side-chains and the backbones was adjusted. In the mean field model energy terms were included for ring-ring interactions, mesogen-mesogen interactions and the coupling between the mesogenic moieties and the backbones. The uniaxial solution of this model also showed a shift from calamitic nematic to discotic nematic phases as the strength of the coupling was increased.
ACKNOWLEDGEMENTS
I would like to thank my supervisors at the polytechnic, Dr. R.M. Wood and Dr. C.M. Care, and my contact at the Royal Signals and Radar Establishment, Dr. D. Me Donnell, for helpful discussions throughout the period of study. I should also like to thank Dr. D.A. Dunmur of the Department of Chemistry at the University of Sheffield for the helpful liquid crystal research seminars which he organised.
I should like also to thank the Royal Signals and Radar Establishment for the use of their laboratories for the physical measurements and Dr. D.Mc Donnell and staff for their assistance. I should also like to thank the Chemistry Department of the polytechnic and the Consortium fur Elekrochemische Industrie GMBH for the provision of the physical samples.
ADVANCED STUDIES
As part of the course of study I attended the undergraduate course on Polymer Industry in the Chemistry Department of the polytechnic. In addition a course on vector programming for the CRAY computer was attended. A review of the literature relevant to the studies is included in the first chapter of this thesis.
The following conferences were attended:
CCP5 Annual Meeting, UMIST, Manchester
January 1987.
International Conference on Liquid Crystal Polymers, Bordeaux, France
July 1987.
CONTENTS
page
CHAPTER 1 INTRODUCTION 1
- Liquid Crystal Phases 2
- Monte Carlo Simulations 14
- The Mean Field Approximation 26
CHAPTER 2 MEASUREMENTS
- Introduction 35
- Molecular Dimensions 37
- Thermal and Optical Measurements 42
- Dielectric Permittivities 45
- Conclusions 56
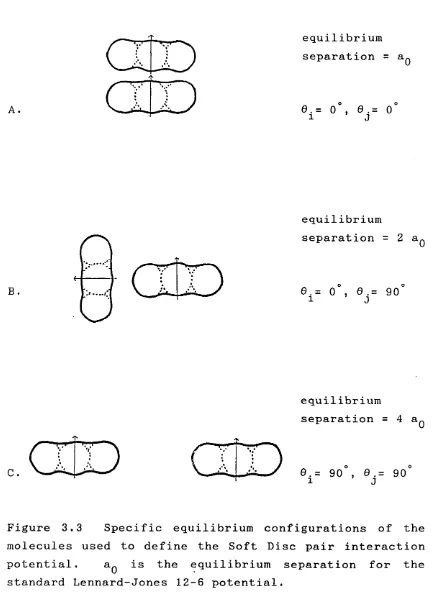
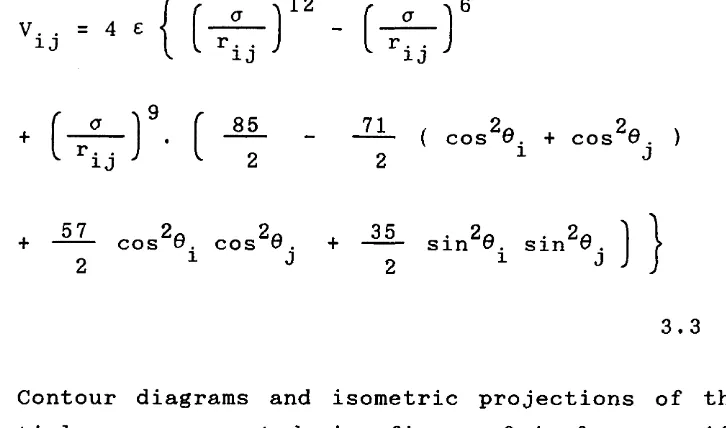
CHAPTER 3 SOFT-DISC MODEL
- The Molecular Interaction Potential 58
- Computing Details 62
- Results 66
CHAPTER 4 THE MULTI-MESOGEN RING MODEL 70 - The Molecular Interaction Potential 70
- Computing Details 76
- Results
i. Simulations of Lone
Mesogens 87
ii. Simulations of the M.M.R.
Model 91
CHAPTER 5 A MEAN FIELD THEORY
- Introduction 141
- The Model 142
- Results 147
- Conclusions 153
CHAPTER 6 DISCUSSION
- Summary and Conclusions 154
- Future Work 162
CHAPTER 1 INTRODUCTION
The scientific study of liquid crystalline behaviour started in the middle of the last century [1]. As early as 1837, the author Edgar Allen Poe remarked on a liquid with anisotropic properties [2], while in 1888 Reinitzer [3] and Lehmann [4] were the first to observe liquid crystalline behaviour in a pure substance. The study and classification of liquid crystalline materials continued through the twentieth century, often with just a handful of devoted workers in the field. However, in the 1960s and 1970s, there was a large expansion in interest in these materials resulting in the development of liquid crystal display devices, such as those which are commonly used in digital watches and electronic calculators. More recently, there has been much interest in the synthesis of polymers which contain liquid crystalline moieties, with particular interest in the development of high tensile strength polymers and optical data storage materials. The move towards polymerisation has resulted in a wide variety of molecular structures being synthesised and studied [5],
LIQUID CRYSTAL PHASES
Liquid crystalline phases may be observed for certain substances between the crystalline solid and isotropic liquid phases on a phase diagram [6,7]. These phases are characterised by a strong anisotropy in some of the properties of the liquid, which remains fluid. It is because the liquid crystalline phase occupies a position intermediate between solid and liquid phases that it has acquired the name ’mesophase’, and a material which can exhibit such a phase is known as a ’mesogen’ . A typical mesogen would have elongate rod-like molecules or flattened disc-like molecules [8], and it is the strongly anisotropic nature of the interaction between these molecules which gives rise to the macroscopic anisotropy of the fluid. A mesophase may be obtained by the melting of a pure solid mesogen, which produces a thermotropic mesophase, or by solution in a suitable solvent which produces a lyotropic mesophase. The materials studied in this project form thermotropic mesophases.
There are several distinct thermotropic mesophases, characterised by different types of anisotropic property, and it is possible for a single substance to exhibit more than one of these phases [9]. The commonly accepted classification of thermotropic liquid crystals was first proposed by Friedel [10] in 1922. Three classes of mesophase were defined according to their symmetry properties. These have been named the ’nematic’,
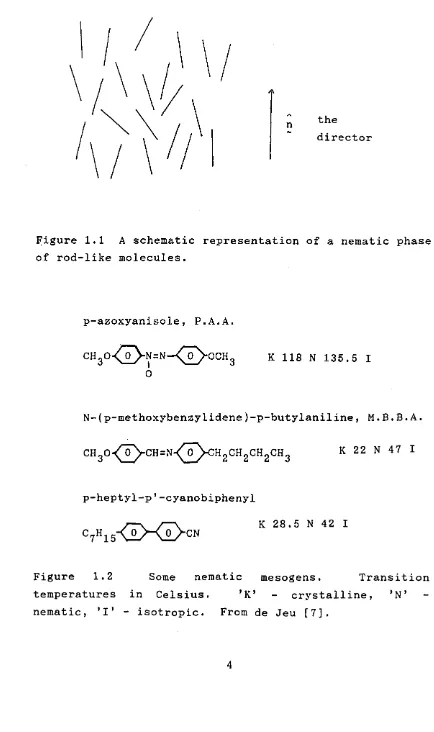
The nematic mesophase is characterised by a high degree of long range orientational order of the molecules combined with the absence of long range translational order, as shown schematically in figure 1.1. The molecules of a nematic mesogen are often approximately rod-shaped and contain a rigid core section, and although the molecules may be polar the resulting macroscopic phase does not exhibit any polarity, unlike a ferro-magnetic structure, for example [7]. In the nematic phase there is spontaneous ordering of the molecules into approximate parallelism and the mean orientational direction is described by a unit vector,A* the director (n). This director often varies within the material, but a uniformly aligned sample may be produced by the application of an electric or magnetic field, or by surface treatment of the container walls. For a material with low viscosity, uniform alignment may occur without the application of an external influence if the material is left for a time at a suitable temperature above the melting point and below the clearing point, T , above which the material is isotropic. It is conventional to reserve the use of the word ’homogeneous’ to refer to a uniformly aligned sample, the director of which is parallel to the plane of the microscope slide or cell in which it is held for observation. The word ’homeotropic* is used when the alignment is such that the director is normal to the plane of the slide or cell.
n the
director
Figure 1.1 A schematic representation of a nematic phase of rod-like molecules.
p-azoxyanisole, P.A.A.
CH3 ° \ £ ^ - N = N - ^ £ ^ - ° C h 3 K 118 N 135,5 I
N-(p-methoxybenzylidene)-p-butylaniline, M .B .B .A
K 22 N 47 I
p-heptyl-p *-cyanobiphenyl
C7H 15 CN K 28.5 N 42 I
Figure 1.2 Some nematic mesogens. Transition temperatures in Celsius. *K’ - crystalline,
[image:14.621.88.522.67.799.2] [image:14.621.134.472.74.280.2]\
which the director varies within the material. Some textures are characteristic of a specific mesophase and so optical observations may be used as a first stage in the classification of a mesogenic material [9,12].
The rigid core of a nematic molecule is often provided by a closely coupled pair of benzene rings, as can be seen in the structures of the molecules of typical nematogens as shown in figure 1.2.
To enable a comparison between the extent of alignment in different mesogenic systems, a quantitative measure is needed to describe the degree of ordering. In the nematic phase, it is usual to take the average of the second order Legendre Polynomial function as such an order parameter [13,14]:
S = <Po (cos0.)> = < - (3cos^0.- 1)> 2 l 2 l 1.1
where, 0^ is the angle between the axis of the i-th molecule and the system director, and the angled brackets, *<..>*, represent the thermal average over all molecules. In the nematic phase, the molecules are as likely to align anti-parallel as parallel to the director, and so the order parameter needs to reflect this by the choice of a function which has the following symmetry:
f(0.) = f(jr-e.) 1.2
2
Hence, cos 0. is used in preference to cos0. or 0..
1 2 1 1
The order parameter may often be estimated from the measured anisotropy of some physical property of the liquid crystalline material [15-17]. The calculations often require further measurements of the same physical property in the isotropic liquid or single crystal states, and some assumption about the symmetry of the molecules is usual.
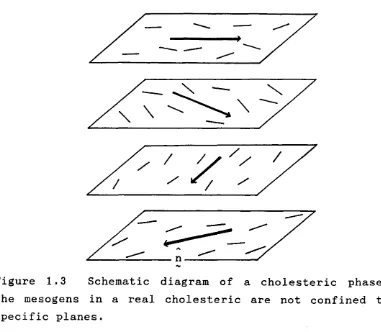
A schematic representation of the cholesteric phase is given in figure 1.3. The phase is similar to the nematic, but with a twist axis perpendicular to the director. The molecules are optically active and the pitch of the twist is temperature dependent, which has led to the use of cholesteric mesogens in digital thermometers. The name of the phase comes from the fact that many derivatives of cholesterol exhibit this phase. The chemical structures of two cholesteric mesogens are given in figure 1.4.
It is found that a nematic phase may result from a mixture of two cholesteric mesogens with opposite twist, and it is also found that a nematic material may exhibit a cholesteric phase on the addition of a little optically active material. Hence, some workers prefer to think of the cholesteric phase as simply a twisted form of the nematic phase, referring to it as ’chiral nematic’. In this case, the true nematic phase is considered to be a chiral nematic phase with infinite pitch.
Figure 1.3 Schematic diagram of a cholesteric phase. The mesogens in a real cholesteric are not confined to specific planes.
N-(p-ethoxybenzylidene)-p’-(£-methylbutyl)aniline
C2H5o < o >
N < 0
cholesteryl chloride Cl
[image:17.616.123.504.94.426.2]and the orientational ordering. Two examples are the smectic A phase, in which the molecules align with the director normal to the planes, and the smectic C phase, in which there is a tilt angle between the director and the normal to the planes. These are shown schematically in figure 1.5.
Using geometrical arguments, Herrmann [18] concluded that there should be 18 distinct mesomorphic groups. However, until the recent discovery of discotic and other exotic phases, the limited classification according to Friedel had been considered satisfactory.
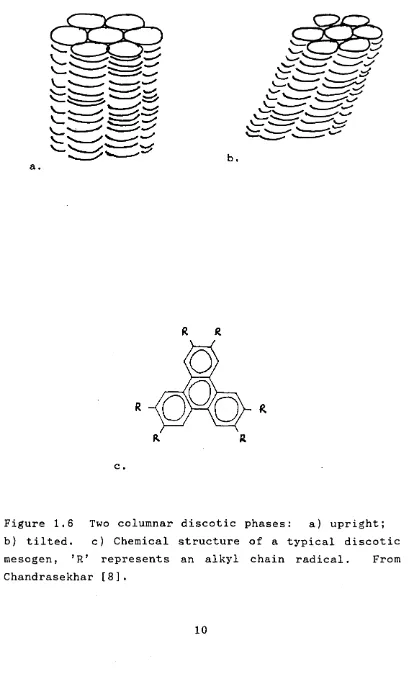
The hexagonal stacking of disc-like mesogens was first observed by Chandrasekhar et a l . [19]. Disc shaped mesogens have since been observed to pack in a variety of hexagonal columnar phases, known as discotic phases, as well as adopting nematic ordering [8,20,21]. Examples of these phases are given in figure 1.6. In the hexagonal discotic phase there is positional ordering in the plane perpendicular to the columns, but within the columns the discs are irregularly spaced.
Other liquid crystal phases have been suggested, including the possibility of cubic symmetry [11].
//////////////
////#////////
/////////////////
R
c
.
[image:20.622.113.527.108.794.2]backbone
spacer unit
b.
mesogenic moiety
c
.
d.
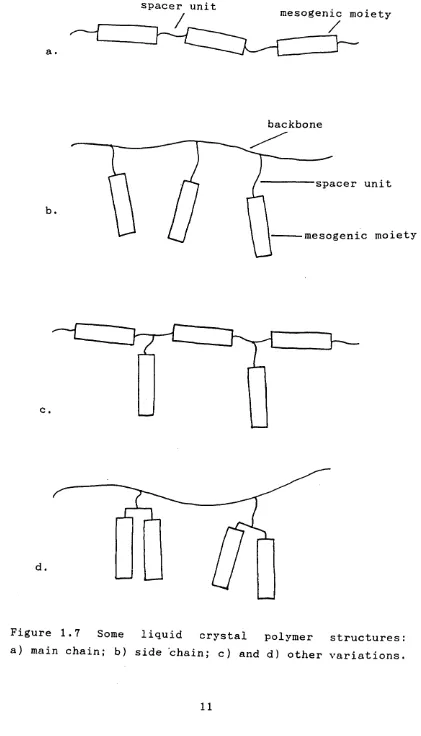
[image:21.618.102.523.23.759.2]The effect of including mesogenic units in the main chain of a polymer is to force the alignment of the polymer chains and so produce extremely strong polymers
[27-29].
In the side-chain polymer system there is a conflict between the aligning tendency of the mesogenic units and the random coiling of the backbone polymer [22,30,31]. The mesogenic units are connected to the backbone by a spacer unit which, if sufficiently flexible, may decouple the ordering of the mesogens from the backbone polymer conformations. In general, the conflict of properties leads to the mesogenic units in a side-chain polymer liquid crystal exhibiting a lower order parameter than their monomeric counterparts. However, the high viscosity of these materials leads to the mesogenic phases of the polymer being more stable than those of the monomer. Not only does the polymer exhibit mesogenic behaviour over a wider range of temperatures, but also a field induced alignment will persist after the field is removed, and this property has led to the investigation into the suitability of side-chain liquid crystal polymers as long-term optical data storage materials
[32,33].
mesogenic moiety
cyclic polysiloxane a
.
alkyl spacer unit
Samples were available with the following combinations of repeat units:
X = 4, y = 4; X = 4, y = 6; X = 5, y - 4; X = 6, y = 4; X = 7, y - 4.
degree of coupling between the backbone and the mesogenic moieties. Compounds have only been synthesised with a small number of repeat units in the backbone and so these low molecular weight polymers may be referred to as
’oligomers *.
Two theoretical techniques, the mean field approximation [13,36] and a Monte Carlo method [37-42] have been used in addition to experimental measurements in order to explore features of these molecules significant in the generation of liquid crystalline structures. The behaviour of these materials would be expected to be strongly dependent upon the nature of the coupling between the mesogenic moieties and the polymer ring backbone. A weak coupling should result in the formation of a conventional, calamitic (rod-like) nematic ordering of the mesogenic units. However, if the coupling is strong, the ring backbone will dominate the behaviour of the material. For example, if the mesogens are rigidly attached to the rings in a radial splay conformation, a discotic phase may be expected.
MONTE CARLO SIMULATIONS
A Monte Carlo technique [37-39,41] may be used to calculate the thermal average, or expectation value, of some thermodynamic property, A. In the canonical ensemble, the expectation value would be:
<A>
f A e x p f - E W / k ^ T ) dB
Q
1.3
where E (0) is the total system energy and Q represents
the full system coordinates, chosen as appropriate for the system being modelled. For example, for a system of N mobile, non-spherical molecules, 0 would comprise three momentum coordinates, three positional coordinates, three orientational momentum coordinates and three orientational position coordinates for each molecule, making a 12N-fold phase space in total. For particles which interact via pair-wise potentials which are independent of velocity we may separate the kinetic and static contributions to the system energy and write:
N N
E,Q) =
I
T i +I
V.. 1.4i i i J (j<i)
where is the kinetic energy of the i-th particle and V. . is the pair interaction between J- J the i-th and j-th particles.
The kinetic terms will cancel in the integrals in equation 1.3 if the thermodynamic property, A, is independent of the momenta of the particles:
J
A exp(-U(T)/kgT)d
0
<A> = — --- 1.5 J exp(-U(T)/kfiT ) dfi
where
N
U(F) - I
vij
i
-6
i i j ( J < i )
Owing to the large number of coordinates contained in T , it would be impossible to calculate the integrals for all but the simplest of systems. In a Monte Carlo method, this problem is overcome by the generation of configurations of the system of N particles. The expectation values of the configurational thermodynamic variables of the system may then be obtained by the weighted summation of the values of those same properties measured in the individual configurations.
A crude method of solution would be to generate configurations completely at random and weight them according to the Boltzmann probability factor, exp(-E(Q)/kgT). However, the Boltzmann probability factor varies over many orders of magnitude and is sharply peaked in the region of the equilibrium configurations. Hence, most of the randomly generated configurations would possess an infinitesimally small weighting, making this summation method extremely
inefficient.
The algorithm derived by Metropolis et a l . [40] uses a technique known as ’importance sampling’, where configurations are generated with a bias towards those near the maximum in the exponential terms in the integrals in equation 1.5.
be obtained as a simple average of the property over the configurations generated.
Several rules have been developed which generate configurations with the required distributions. We adopt the following method which is commonly used. A particle is chosen at random and its coordinates altered in some way. For example, it could be displaced by a small distance in some randomly chosen direction or rotated through a randomly determined angle. This attempted alteration (known as a ’move*) is either accepted or rejected according to the following criteria:
i) the move is accepted if the resulting change in the system energy, Au, is negative.
ii) if the change in energy is positive, then the probability of the move being accepted is given by the Boltzmann factor, exp(-AU/k^T), D and a comparison with a random number on the interval 0,1 determines whether the move is accepted.
of computing time.
The starting configuration for a run must be chosen carefully in order to minimise the likelihood of the system locking in such a non-equilibrium state. To ensure that the system reaches true thermal equilibrium, it is often necessary to allow the simulation to continue well after equilibrium appears to have been reached. Also, different starting configurations may be used in order to test whether the final equilibrium state is independent of the initial configuration.
The Monte Carlo technique is especially computationally intensive at very low temperatures, as few moves are accepted and consequently new configurations are generated inefficiently.
In many cases, including liquid crystal systems, the amount of change involved in a Monte Carlo move is an adjustable property and is often set so that the ratio of accepted to rejected moves is approximate unity as it is thought that this may allow the simulations to run most efficiently [38].
Monte Carlo simulations are invariably performed on systems of small numbers of molecules from a few tens to a few thousands. Hence comparison with macroscopic systems is not necessarily straightforward as there are
23
attempt twice as many moves in order to reach thermal equilibrium, giving a four-fold increase in computing time altogether.
The usual way of mimicking a macroscopic system is to perform the simulation on a box of molecules with periodic boundary conditions such that the box is surrounded by identical boxes of molecules on each side. Interactions are then considered between one particle, i, and the closest replica of particle j. This technique is suitable for short range forces, where interactions with the next closest j-th molecule would be negligible. For molecules with longer range interactions, some adjustment may need to be made to the simulation or to its results in order to account for the omission of interactions beyond the closest of a pair of molecules. Also, it should be noted that these periodic boundary conditions introduce an unrealistic repetitiveness into the system.
and the enthalpy etc.
The Metropolis Monte Carlo technique has been used to simulate a variety of physical systems [38,39], including classical fluids, many-body quantum systems and magnetic systems, as well as some simulations of simplified liquid crystal systems.
Various workers have undertaken Monte Carlo simulations of liquid crystalline systems in which the centres of mass of the molecules are constrained to a lattice [43,44,48-64]. This restriction results in a substantial saving in computing time for several reasons: moves involving the translation of a molecule are avoided; repulsive interactions, which would be necessary to prevent a translationally mobile system from collapsing, are no longer required; interactions can easily be limited to nearest neighbours only, simplifying the calculation of the change in energy involved in a move. Also, further savings in computing time may be made by restricting the orientations of the molecules to a limited number of discrete orientations. Of course, the restriction of the molecules to a lattice does place substantial limitations on the interpretation of the results. In particular, the fluid nature of any possible phases has been removed, prohibiting the formation of genuinely l i q u i d phases. However, lattice models still
validity of an analytic theory, such as a mean field approximation, in which no information is given concerning the spatial packing of the molecules.
predicted by the Maier-Saupe theory.
Luckhurst and co-workers have employed lattice Monte Carlo techniques in the systematic investigation of many liquid crystalline properties [49-61]. They have made comparisons with mean field calculations and extended the Lebwohl-Lasher model to include longer range interactions [49,50]. Other investigations include the simulation of systems of non-cylindrically symmetric molecules molecules [51], mixtures of rod-like and plate-like molecules [52], the effect of an external field on the alignment of phases [53], and pretransitional effects [54] (ie. the short-ranged ordering of nematogens in the isotropic phase just above the transition temperature). The transition from one smectic phase to another has also been modelled [55]. In this case the fixed spatial ordering of the lattice was an essential feature of the phases formed.
Another form of lattice liquid crystal model solved by Monte Carlo technique is that in which long semi-flexible molecules are represented by strings of adjacent squares or cubes on a simple grid in 2- or 3-dimensions. Attempted Monte Carlo moves are performed on individual segments of the molecules, with the rejection of moves that would involve the disintegration of an individual molecule. Such simulations have been used in the study of lyotropic mesogens in solution [65].
infinite when any part of the two molecules overlaps, and which is zero otherwise. Hence, in the Monte Carlo simulation, any configuration generated in which any two or more molecules overlap is always rejected, and any configuration in which no molecules overlap is accepted. Consequently, the Boltzmann probability factor takes only values of one or zero, the result of which is that the state of the system is independent of the temperature. Phase transitions are, therefore, observed as a function of the density, rather than as a function of the temperature.
Simulations of hard particles can be relatively inexpensive in terms of computing time, provided a suitably simple shape is chosen for the molecules. In a large box of molecules most will not overlap and it is a straight-forward task to eliminate most pairs of molecules from the list of those which might possibly be overlapping. Efficient computing routines can be devised which are able to determine whether any of the remaining pairs of molecules overlap. However, performing Monte Carlo simulations on a system of anisometric molecules which have translational as well as orientational freedom is generally more expensive in terms of computing time than the simulation of molecules on a lattice. Consequently, simulations have been performed on systems of a few hundreds of translationally mobile molecules in comparison with the simulation of systems of several thousands of molecules confined to a lattice.
ellipses in 2-dimensions [66]. However, the extension of this work to hard spherocylinders (cylinders with hemi-spherical ends) in 3-dimensions did not yield an ordered liquid phase [67], Since then other workers have employed a variety of hard shapes [68-75]: thin discs, oblate and prolate ellipsoids, cylinders and spherocylinders; and ordered phases have been located in 3-dimensional simulations. Nematic ordering has been observed for disc-like objects and studies on systems of uniaxial ellipsoids have shown an approximate equivalence in the phase behaviour of prolate and oblate ellipsoids which share the same axial ratio [72].
The study of hard-core particles has contributed to the debate as to the essential nature of the interaction between molecules which form liquid crystalline phases [74,77]. Short-range repulsive interactions have been shown to be sufficient to produce various smectic and nematic liquid crystalline phases [75]. However, the formation of a variety mesophases has also been successfully predicted by models which include only longer-ranged anisotropic forces, such as the various lattice Monte Carlo models and the Maier-Saupe mean field approximation. The debate as to whether the steric packing of hard-core particles dominates the behaviour of liquid crystalline materials is still active.
itself will also be somewhat involved, comprising separation and orientational terms. However, the benefits of these simulations is in the use of more realistic interaction potentials and the retention of both spatial and temperature dependent effects.
One simulation of this type was that of Luckhurst and Romano [78] in which 256 translationally and orientationally free molecules interacted via a simple anisotropic pair potential based on the Lennard-Jones 12-6 potential. The system exhibited a weak first order transition from a nematic to an isotropic phase on increasing the system temperature.
Our application of the Monte Carlo method to the study of low molecular weight polymeric liquid crystal systems forms a natural progression from the study of monomeric liquid crystal systems, in parallel with the increased experimental interest in polymeric mesogens in recent years [5].
Another simulation technique which may be used in the study of fluids is that of ’molecular dynamics’ [41]. The concept is very simple: the classical equations of motion for a box of N particles are repeatedly solved until the system reaches equilibrium. The real time path of the system is followed, unlike the artificial Markov process used in the Monte Carlo technique. Although the molecular dynamics approach has been applied to the study of some liquid crystal situations [81], the breadth of the application of this method has not been as wide as that of the application of the Monte Carlo technique to the study of liquid crystals [41]. Consequently, the Monte Carlo method seemed the more appropriate choice for our studies, providing us with a variety of documented applications of the technique from which to draw our inspiration and with which to make comparison. In particular, we have been able to compare our results with those of Luckhurst et.al. [78].
THE MEAN FIELD APPROXIMATION
Carlo method, the aim is the calculation of the expectation values of various properties of a system of particles interacting via a pair-wise potential, as given by equation 1.5, in which the kinetic energy dependence has been removed. Unlike the Monte Carlo method, an exact solution is not obtained, but rather the equation is reduced to a soluble form by the applications of successive averages and approximations.
Following the method outlined by P.J. Wojtowicz [13] we note that the pair interaction between axially symmetric molecules can be written as an expansion in spherical harmonic functions:
4tc ) UT T ( r . .) Yt (6 . , <p. ) Y* ( 6 ., <f>. )
Z_j L . L .m ij' L . m i* i' L.mv j* j '
J J
L . L . mi
J
1.7
where Y^m are the standard spherical harmonic functions and the angles are as defined in figure 1.9. For molecules with a mirror symmetry plane perpendicular to the rotational symmetry axis, the spherical harmonic terms with odd values of L drop from the series.
This pair-potential can be reduced to a single particle potential by the calculation of the potential experienced by particle i under the influence of the mean potential field created by the presence of all the other particles. Three averaging processes are involved. Firstly, the pair potential is averaged over all of the orientations of the relative position vector, r. . = r. -— i J — i r., with respect to the unique rotational symmetry axis
J
o f molecule i. Some assumption as to the distribution of
these orientations is required, and that chosen here is that the orientations of the r . . are evenly distributed
axis of molecule j
axis of molecule i
ij
on the surface of a sphere. This is a simplification of the real distribution present in a nematic fluid, which we might expect to possess cylindrical rather than spherical symmetry. This averaging process removes all terms in the interaction potential for which L. ^ L..i J
The second average of V. . is over all of theij orientations of the unique symmetry axes of the molecules j with respect to the unique axis of molecule i. The potential resulting from these two orientational averages is:
<<Vi(cos0)>> = ^ ULLm*r * <PL > PL <COS0) x *8 L
where 0 is the angle between the unique axis of the i-th molecule and the director of the system, n, and are the usual Legendre polynomial functions.
Finally, an average is made over all values of the separation of the two particles, |r. .| to give the1 J following single particle potential:
V i (cos0) = X UL <PL> PL (COS0) 1.9
where the are given by
U, = X < UL L m (r) > 1.10
and
where n is the number density of the molecules and n 2 (r) is the distribution function for the separation of pairs of molecules.
From equation 1.5 the expectation values of the PL can be expressed in terms of the single particle potential in equation 1.9:
J
P^(cos6) exp(-V^(cos©)/kgT) dcosO<pl > - ---
---J exp(-V^(cos6)/kgT) dcosO
1.12
If N values of L are used in the original expansion of V . . in equation 1.7 then there will be N equations ofA J the form of equation 1.12 which will be self-consistent in the P^ and each of which will contain all the <Pjj>
within V\(cos0) in the integrals on the right hand side. The simultaneous solution of these N equations at a given temperature yields the values of <PT > at that temperature. Hence the temperature dependence of the <P^> can be obtained, the solution for <?2> the usual nematic order parameter. At some temperatures several solutions for the <PT > are possible and in theseLi cases it is necessary to calculate the free energies associated with these solutions to determine which one corresponds to the equilibrium state.
J
PgCcosG) exp( (cos© ) <Pg>/kgT) dcos0< P o > =
---exp(PP2(cos0)<P2>/kBT) dcos©
1.13
where v is a measure of the strength of the
pair-interaction.
The numerical solution of this equation yields three solutions for temperatures below T = 0.22284 P/k-, and just one solution, <?2> = above this temperature. These solutions are shown in figure 1.10. The solid lines represent the equilibrium solutions and the dashed lines the other solutions. The solution at low temperature is that of an ordered nematic, the order parameter of which, drops discontinuously from a value of 0.4289 to 0 at a critical temperature of Tc = 0.22019 P/kg.
The success of the Maier-Saupe theory lies in its prediction of a first-order transition from the nematic phase to the isotropic. However, quantitative comparisons with experimental measurements and Monte Carlo calculations have shown some discrepancies. For example, a comparison with a lattice model solved by the Monte Carlo technique [36] suggests that the transition temperature is too high in the Maier-Saupe theory by 17% and the spontaneous order parameter, at the transition too large by 25%. The entropy change at the transition was also found to be about a factor of four too large.
0.0
--r T
*--- '--- '--- 1--- r " 1 1 1 I 1--- I--- ---- 1--- 1--- 1--- I---1
0.00 0.0S 0.10 0.15 0.20 0.25 kBT/i>
approximation in the solution of the Maier-Saupe model [82]. Others, however, have extended the theory by the retention of the higher order, , terms in the expansion of the pair potential and very good agreements with experimental data has been achieved in some cases [83].
In brief, the major limitations of the mean field approach in its application to the study of nematic liquid crystals lies in the neglect of short-range ordering and fluctuation effects. The loss of short-range ordering places too much emphasis on the longer range interactions, leading to an enhancement of the nematic ordering and the stability of the ordered phase. Pretransitional behaviour in the isotropic phase just above the critical temperature is precluded by these limitations of the mean field approximation.
Mean field calculations have been applied to a variety of liquid crystal systems more complex than that of rod-like nematogens. These have included the study of binary mixtures of rods and plates [85,86] and several polymer liquid crystal systems [28,29,31]. Of particular interest to us has been the work of Wang and Warner in which the uniaxial phases of comb-like liquid crystal polymers have been explored [31]. Various nematic phases were found in which either the polymer backbones or the rod-like side groups or both together exhibited positive ordering.
CHAPTER 2 MEASUREMENTS
INTRODUCTION
We have studied a series of oligomers which are the cyclic homologues of the linear side-chain liquid crystal polymers synthesized by Finkelmann et al. [88,89]. The chemical structure of these cyclic oligomers has been given in figure 1.8 in chapter 1. These comprise cyclic dimethylsiloxane backbones with biphenyl mesogenic units attached as side chains via alkyl spacer units. Samples of five liquid crystalline oligomers were available for investigation which allowed us to study the effects of altering the number of repeat units in the ring or the length of the alkyl spacer. An estimate of the relative sizes of the constituent parts of these oligomers has been made by the use of molecular graphics software. The over all phase behaviour of the materials was studied by optical microscopy and D.S.C. techniques, and the dielectric behaviour of the samples was studied in the temperature region of the mesogenic to isotropic phase transition.
D4C4 D4C6
D4C4 D5C4 D6C4 D7C4
spacer variation
ring size variation
Table 2.1 The available cyclic liquid crystal oligomers, separated into two homologous series.
BOND LENGTHS: C-C 1.
54 A
C-C (benzene ring) 1.38
A
C=0 1.34
A
C-0 1.51
A
C-Si 1.87
A
Si-0 1.61
A
C-H 1.09
A
C-H (benzene ring) 1.02
A
BOND ANGLES: all Si, O, C 109°
except:
O
C — O - 120 coplanar
- < £ > 120 coplanar
MOLECULAR DIMENSIONS
A molecular graphics package [90] has been employed in the construction of a model of a possible molecular structure of one of our oligomeric compounds, D4C4. Estimates of the dimensions of the major elements of the structure have been obtained from measurements made on this graphical model.
The bond-lengths used in the construction of the molecule were obtained from mean covalent bond radii [90,91] and are listed in table 2.2 together with the bond angles employed. In the construction of the mesogenic moieties, the benzene rings and the carboxyl group were constrained to be coplanar, with the 1-4 axes of the benzene rings parallel [92-94]. Other torsion angles about the bonds were chosen arbitrarily. The resultant mesogen and four membered alkyl spacer are shown in figure 2.1. A four membered ring of cyclic poly(dimethylsiloxane) was constructed in which the silicon atoms were fixed in one plane and the oxygen atoms fixed in a second plane parallel to the first, thus making a regular structure as shown in figure 2.2. Note that for the four membered ring oligomer, four of the Si-CHg bonds radiate from the ring structure in the plane of the Si atoms. The attachment of the alkyl spacers to the siloxane ring via these splay bonds results in the structure for the complete molecule given in figure 2.3.
Figure 2.1 Molecular graphics model of the mesogen and four membered spacer: CHg-(CH2 )3-OCgH4COOHC6H4 )CH3 .
compounds and no minimum energy calculations have been involved in the construction. We expect the physical samples provided to contain a mixture of molecular conformations with only a proportion of the alkyl spacers attached to the siloxane rings in approximate splay conformations. The actual molecules will exhibit some flexibility, particularly in the alkyl spacer units and in the polymer ring backbone, dependent upon the number of repeat units in each [34]. We would expect the benzene ring pair, coupled by the carboxyl group, to provide an essentially rigid structure within the mesogenic moieties [92-94].
However, the molecular graphic model as constructed gives us insight into the interplay between the constituent parts of the molecules and their relative dimensions. If we consider as our simplified picture of the molecules a planar ring, with rod-like mesogenic units attached equidistant around the ring via spacer units, then we can make measurements on our graphical model to estimate the dimensions of the constituent parts of our idealised molecule. The relevant dimensions are the diameter of the central ring, the length of the spacer units and the length and diameter of the rod-like mesogens. The actual measurements made in three dimensions on the molecular structure are shown in figure 2.4. Owing to the possibility of other molecular conformations, these measurements should be treated as approximate.
Figure 2.4 The distances measured from the model of D4C4.
MESOGEN ROD LENGTH 13.2
A
ROD DIAMETER
4.2 A
SPACER UNIT 4-MEMBERED 5.0
A
(length) 6-MEMBERED 7.5
A
RING DIAMETER 4-MEMBERED 5.6
A
5-MEMBERED
6.4 A
6-MEMBERED
7.1 A
7-MEMBERED
7.9 A
of a cylinder. Such a cylindrical shape may be obtained by the rotation of the lath-like mesogen about its long axis. The length of the (CHg)^ spacer is 5
A,
somewhat larger than one third of the length of the mesogenic unit. It is less clear how to define the diameter of the oligomer ring, and two measurements have been made: one the diameter of the circle of Si atoms and the other the diameter of the larger circle which includes the first C atoms of the flexible spacer when attached in a planar radial conformation. However, it is known that in the samples provided the spacer units will not all be attached to the backbone via radial bonds and so the mean of these two measurements, 5.6A,
is adopted as the diameter of the idealised ring backbone.Table 2.3 lists the approximate sizes the constituents of the idealised molecules for all of the compounds available. More involved calculations of the radii of gyration of cyclic dimethylsiloxane polymers have been undertaken [95,96], but these were for larger rings than in our oligomers. However, comparison the radius of gyration of an eight membered poly(dimethylsiloxane) ring is quoted as 4.5
A,
which compares well with the value of 4.4A
as calculated by our method. It would be expected that our calculations would provide a reasonable estimate of the ring diameters for the smaller rings in which the number of available conformations is limited.THERMAL AND OPTICAL MEASUREMENTS
scanner. These measurements were supported by optical observations using a polarising microscope with a
o
hot-stage which had a temperature resolution of 0.1 Celsius.
The glass transition temperatures, T , and the clearing temperatures, T , are given in table 2.4 for the available materials. These were measured by D.S.C.
o
calibration, cooling at a rate of 10 C/min from the isotropic phase. The clearing temperatures were confirmed by optical observation and for all of the materials the optical characteristics below Tc suggested possible nematic behaviour. In general the glass
o
transition temperatures are about 10 C and the clearing
o
temperatures about 90 C. In the case of D4C4, crystallites were seen to persist at temperatures above the clearing of the bulk of the fluid and to undergo a
o
monotropic transition into the isotropic phase at 107 C. The density of the crystallites was increased when the
O
sample was annealed for several hours at 50 C before heating beyond Tc on the optical stage. On cooling, a birefringent phase was not produced until the temperature
o
dropped below 84 C. Repeated D.S.C. scans of D4C6 at
o
5 C/min indicated the formation of possibly crystalline
o
compound
D4C4
Tg <’C >
8
Tc (°C)
84, 107 (see text)
D4C6 5 93
D5C4 6 83
D6C4 8 93
D7C4 13 92
Table 2.4 Glass transition temperature, T , and clearing8 temperature, T , of the cyclic oligomers,c
compound activation energy (eV)
D4C4 1.818
D4C6 1.572
D5C4 1.677
D6C4 1.740
D7C4 1.673
DIELECTRIC PERMITTIVITIES
Dielectric measurements were made using glass capacitance cells in a parallel plate configuration with a grounded guard-ring. The plates were kept 50 Hm apart
using mylar spacers and had an active area of one square centimetre. Electrical connections to the sample were achieved by an indium tin oxide coating and the plates were surface treated with Cr-complex to favour homeotropic alignment of the liquid crystals in the absence of an external aligning field. The cells were calibrated with air before filling with the oligomers by capillary action at a temperature a few degrees above the transition to the isotropic phase.
The capacitances of the filled cells were measured over the frequency range of 50Hz to 1MHz using a Hewlett Packard self balancing bridge HP4129A. The cells were held in a shielded holder and heated by a hot air temperature controller system. Homeotropic and homogeneous alignment were induced by a magnetic field of 1.5 T provided by a Newport electro-magnet with 7" diameter poles.
The method of measurement involved heating the filled cell into the isotropic phase and then applying the magnetic field to induce homeotropic alignment as the cell was cooled in stages into the liquid crystalline phase. Capacitances were measured over the full frequency range at each temperature. It was not generally possible to make repeatable measurements below
o
After measurements had been taken at the lowest temperature the cell was heated again into the isotropic
o
phase, turned through 90 to give homogeneous alignment, and measurements were again made as the cell was cooled in stages. Good alignment in the liquid crystalline phases was confirmed by the fact that the relaxations observed in the dielectric permittivities for homeotropic
(parallel) alignment were not observed in the permittivities for homogeneous (perpendicular) alignment.
The measurements obtained from the bridge were the capacitance, C, and the quality factor, Q, of the equivalent parallel resistor-capacitor circuit. The real component of the complex dielectric permittivity, e*, was obtained from:
e
* = 2.1where Cq was the capacitance of the cell when filled with
air.
The resistive part of the circuit is related to the imaginary component of the complex dielectric permittivity, known as the dielectric loss, e", which was calculated from:
e *
e" = ---- 2.2
Q
6.5
90 C
5.5
80 C
70 C 80 C
4.5
40*C '■o 60 C.
3.5
f(kHz)
b
c"
II0.8
90*C
0.6
80*C
0.4
70*C
0.2 60 C
40*C
0.0 I0‘
f(kHz)
also observed and are shown separately in the same figure. The perpendicular dielectric permittivities of D4C4 shown in figure 2.6 do not exhibit relaxations over the same range of frequency and temperature as those for the parallel permittivities, and neither are there any peaks in the perpendicular dielectric loss. However, there is some fall off of the perpendicular permittivity at high frequency which may be the result of another relaxation process or possibly due to the finite resistance of the tin oxide conductor. This high frequency fall off is also observed in the parallel permittivity. The material is clearly dielectrically negative (ie. ej - e^< 0), resulting from the large transverse component of the dipole in the mesogenic side chains [97]. The lack of a dominant longitudinal dipole in the mesogenic units prevented the simple estimation of the nematic order parameter from these dielectric measurements [17].
The existence of the relaxations only in the parallel permittivities confirms that good alignment was achieved for both orientations and suggests the 6-relaxation due to end to end motions of the mesogens.
The dielectric permittivities for the other materials showed qualitatively similar behaviour to that of D4C4.
6.5
5.5
4.5
70 c
60 C
80 C
90 C
60 C
40 C
3.5
10' 10“ 10' 10* 105 10“
f(kHz)
0.6
90*C 0.6
0.4
80*C
40*C 0.2
70 C
".0
b
.
f(kHz)
Figure 2.6 Perpendicular components of a) dielectric permittivity, c* and b) dielectric loss, , plotted
a s :
1
1 + iuT0 2.3
i
where £^ is the dielectric permittivity at infinitely high frequency and £^ is the static dielectric permittivity. is the relaxation time of the material and w is the angular frequency of the measurement.
From equation 2.3 it can be shown that the plot of the dielectric loss against the real part of the complex dielectric permittivity is that of a semi-circle. The Debye theory has been extend by Cole and Cole to allow for a spread of relaxation times, in which case the equation for the dielectric permittivity becomes:
where is here the mean relaxation time. The plot of £" against £’ is now part of a semi-circle, the centre of which is depressed below the e"=0 axis. The parameter a is related to the amount by which the semi-circle is depressed below the axis and is a measure of the broadening of the relaxation. The minimum value of a is zero, which corresponds to a single relaxation time, and the maximum value is unity.
The Cole-Cole plots for the parallel permittivities of all of the materials were nearly semi-circular with the centre depressed below the £*- axis, corresponding to broadened Debye-like relaxations. As an example, the Cole-Cole plot of D4C4 for 70 C is given in figure 2.7.
1
0.8
0.6
400 kHz
0.4
0.?
4.0 4.5 5.0 5.5 6.0
Figure 2.7 Cole-Cole plot for D4C4 at 70 C in parallel conf iguration.
0.30 n
0.25
-o
o 0 CJ
1
oo 0.20
0.15-0.10
X D7C4 0 06 C4
• D5C4
■ D4C6
▼ D4C4 --- ,--- !--- 1---
p-5 10 50 100
mean relaxation frequency (kHz)
Cole-Cole plots were constructed for all suitable relaxations of the materials and the broadening parameter, a, calculated from the depression of the semi-circle. These Cole-Cole parameters are plotted as a function of relaxation frequency in figure 2.8. The broadening is largest for D4C4, the molecule with the smallest ring and the shortest spacer, averaging a * 0.26. For this material there is an apparent trend in which a diminishes as the relaxation frequency is increased. However, for the other materials, the a are scattered and show no clear trends. For D4C6 the average broadening parameter is a » 0,21, 0.05 lower than that for D4C4. It would appear that the effect of lengthening the spacer by two -(CHg)- units is to increase the decoupling of the mesogenic units from the broadening effect of the ring backbone. The reduction in the a is even more pronounced as the number of repeat units in the ring is increased. The average of a for D5C4, D6C4 and D7C4 is about 0.18.
Another method of estimating the broadening of relaxation times was developed by Fuoss and Kirkwood, whose relation is [99b]:
cosh“1(eM ' max /£") = £ ln(f/fn ) 0 2.5
cosh 1(e" /€")max
o.o
75 deg C 70 deg C 60 deg C
-1.0
f(kHz)
Figure 2.9 cosh ^(e" max/e" ) against frequency for D4C4.
0.75
0.70
-^ 0.65 H
0.60
-0.55
0.50
X D7C4 o D6C4
• D5C4 ■ D4C6 ▼ D4C4
5 10 50 100
mean relaxation frequency (kHz^
for D4C4, for which
P
* .60 is typical. The addition of two alkyl units to the spacers results in an increase inP
to about 0.61 for D4C6. A more marked increase inP
of approximately 0.12 is observed to correspond to an increase in the number of repeat units in the ring backbone. The average value for D5C4, D6C4 and D7C4 isP
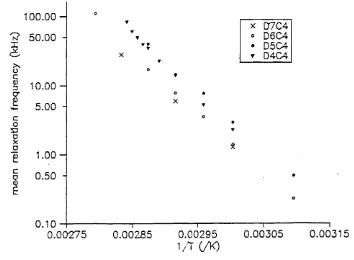
« 0.72.Relaxation processes may also be modelled by a system with two energy states [99a] in which the mean relaxation frequency, f q , is related to the potential
energy barrier, AW, separating the two states:
fQ = A exp(-AW/kgT) 2.6
100.0
-c
co
53 0
1
50.0
-10.0
5.0
-1.0 -J
0.5 0.00275
■ D4C6 ▼
D4C4-0.00285 0.00295
1/T (/K) 0.00305
Figure 2.11 Arrhenius plot for D4C4 and D4C6.
100.00 7? 50.00
10.00 5.00 >»
o
co
53
1.00
0.50
▼ X D7C4
▼▼ 0 D6C4
• D5C4
X
▼ T D4C4
0.10 — l--- 1--- 1--- 1--- 1
0.00275 0.00285 0.00295 0.00305 0.00315