Procedia Engineering 99 ( 2015 ) 5 – 20
1877-7058 © 2015 The Authors. Published by Elsevier Ltd. This is an open access article under the CC BY-NC-ND license (http://creativecommons.org/licenses/by-nc-nd/4.0/).
Peer-review under responsibility of Chinese Society of Aeronautics and Astronautics (CSAA) doi: 10.1016/j.proeng.2014.12.502
ScienceDirect
“APISAT2014”, 2014 Asia
-Pacific International Symposium on Aerospace Technology,
APISAT2014
A Combined Shape and Liner Optimization of a General
Aero-engine Intake for Tone Noise Reduction
S Qiu*, J Y Ying
Dept. of Discipline Engineering, AVIC Commercial Aircraft Engine CO.LTD, No.3998 South Lianhua Road, Shanghai, 201108,China
Abstract
A novel acoustic design methodology for turbofan engine inlets is presented. A fan intake tonal noise propagation model is enhanced with its continuous adjoint formulation, having been first applied to design the intake. This is followed by the implement of a liner optimization study on the obtained optimal intake in which far-field noise attenuation due to the presence of a liner is maximized by adjusting the liner impedance. The dependence of optimal liner impedance on frequency is examined. The present paper aims at describing the potential of the combined shape optimization and liner optimization for low noise turbofan duct design. Prior to the optimization process, the implementation of the unsteady aeroacoustic adjoint method in shape optimization is validated by comparing the sensitivity derivative with that obtained by finite differences. The NASA flow impedance tube configuration is selected for benchmarking the time domain impedance condition (TDIBC) used in liner optimization. The examples presented demonstrate that significant noise reduction is achieved for most of the sound field by selecting the optimal shape and liner impedance. The result obtained confirms the effectiveness and efficiency of the proposed combined shape and liner optimization framework.
© 2014 The Authors. Published by Elsevier Ltd.
Peer-review under responsibility of Chinese Society of Aeronautics and Astronautics (CSAA). Keywords: shape optimization; liner optimization; turbofan inlet; tone noise reduction
1.Introduction
Noise generated by the fan in a modern high bypass ratio aero-engine is one of the major sources of aircraft noise emanating both at take-off and landing. The capability to attenuate the noise level of the fan noise through the
* Corresponding author. Tel.: +86-021-33367195; fax: +86-21-33366688.
E-mail address: [email protected]
© 2015 The Authors. Published by Elsevier Ltd. This is an open access article under the CC BY-NC-ND license (http://creativecommons.org/licenses/by-nc-nd/4.0/).
nacelle inlet has recently become critical for managing the noise level due to the increasing use of the high by-pass-ratio engine.
In the past, there have been ongoing research activities for the development of noise optimization systems. It has been shown that these shape optimization tools can be effectively used to design the inlet duct to reduce the radiated sound in the far field. The basic idea of the shape optimization is to minimize the far field acoustic radiation by controlling the geometry of an engine duct. A noise prediction and optimization system for turbofan inlet duct designs is developed by Zheng et al. [1].With the integration of an in-house software suite of CFD codes, HYDRA[2], and a commercial software suite of CAA codes, ACTRAN[3], into an in-house optimizer, SOFT[4], liner and geometry optimizations of an axi-symmetric intake are performed by Pan et al.[5] Parametric studies on the effect of duct curvature on noise propagation carried out by Sugimoto et al.[6] have already shown that the effect of scattering and reflection caused by a hardwall geometry increases with duct curvature. McAleer et al. examines the acoustic benefits of a highly curved duct that is incorporated into an engine [7]. Some researchers have also made use of the acoustic liner optimization technique to solve the fan noise problems. Rice has pioneered the acoustic liner optimization technique using numerical approaches[8]. Robinson and Watson study checkerboard liner optimization for a rectangular duct[9]. Motsinger et al. use the optimization technique that is based on the acoustic wave solution in terms of series of characteristic duct modes to design an optimized single element liner in a case without mean flow, and optimized single and dual element liners in cases with mean flow[10]. Hamilton and astley use ACTRAN to optimize a lip liner in the mid frequency range[11]. Lafronza et al. present an optimization procedure based on a response surface model to investigate a uniform and an axially segmented acoustic liner[12].However, a direct linkage between the variables such as impedance properties, mean flow conditions, and the inlet duct geometry to the result such as the far field directivity patterns is still lacking.
This paper represents a natural extension of the work by Qiu et al. [13] and the main objective of the current work is to develop a tool that can successfully search for optimum impedance properties of the duct liners and optimum duct geometry, all under the constraints of practical considerations, so that a desired sound field is achieved.
The layout of this paper is as follows. In Section 2, the numerical simulation methods are presented. Section 3 gives an overview of optimization design framework based on a adjoint-based shape optimization method and a Kriging-based liner optimization method and Section 4 presents the computational results using the optimization algorithm. Finally, Section 5 concludes this paper.
2.Numerical simulation methods
2.1 Governing equations
This research focused on the prediction of propagation and radiation of spinning modes generated by the engine fan and fan/stator flow interactions. The sound wave propagation inside the duct and the radiated sound field in the far field are calculated using a hybrid method. That is, the governing equations are numerically solved using LEE method inside of the duct and its near field while a FW-H[14] method is applied in the far field. The complete governing equations for a single frequency k and a single circumferential mode m are[15,16]:
' ' ' ' ' ' ' ' 0 0 0 0 0 0 0 ' ' ' ' ' ' ' 0 ' 0 0 0 0 0 0 0 ' ' ' ' ' ' ' 0 ' 0 0 0 0 0 0 0 ' ' 0 ( ) ( ) 0 ( ) ( ) 0 ( ) ( ) 0 t o o t t u u v v m w v v t x r kr r u u u u u p u v u u v v t x r x r x v v v v v p u v u u v v t x r x r r w w u t U U U U U U U U U U U U U U U U U U w w w w w w w w w w w w w w w w w w w w w w w w w w w w w w w w w ' ' ' 0 0 0 0 t t w mk w v v p x r Ur r ° ° ° ° ° ® ° ° ° w ° ° w w ¯ (1)
where superscript (
'
) and subscript (0) are perturbation and mean properties respectively.U
is the density, p is the pressure, u the axial velocity, v the radial velocity, w the azimuthal velocity, x and r are axial and radialcoordinates, and θ is the azimuthal angle. ' '/
t
w ww wt.The fluid is modeled as a perfect gas with the homentropic
assumption, ' 2 '
0
p C
U
, whereC
0 is the sound speed. All variables are nondimensionalized using a referencelength
L
*, a reference speedC
0*, and a reference densityU
*. For the numerical examples presented next, these have been taken as 1 m, 340 m s/ , and 1.225 kg m/ 3.2.2 Time-Domian Impedance Boundary Condition
For the right moving wave perpendicular to the rigid wall with velocity u, we defined an incident wave and a
reflection wave in the frequency domain, which are expressed as
u
ˆ
andu
ˆ
in terms ofZ
respecively:ˆ
ˆ ˆ
(1
)
ˆ
u
u p
Z u
(2)ˆ
ˆ ˆ
(1
)
ˆ
u
u p
Z u
(3) A reflection coefficient is defined asW u
ˆ
ˆ
/
u
ˆ
in the frequency domain, which is a complex function and can get a direct measure of the magnitude of the reflection. It can also show us a phase relation between the incident wave and the reflection wave. In time domain,u
ˆ
Wu
ˆ
ˆ
is equivalent to the following convolution formula:( )
(
) ( )
u t
fW t
W
u
W W
d
f
³
(4)Actually, for each discrete frequency
Z
j, there is a corresponding impedanceZ jj( 1,..., )N . Then we candefine a softness coefficient:
2 2
2(1
)
2
ˆ
( )
ˆ
( ) 1
1
(1
)
j j j j j j jR
iX
W
W
Z
R
X
Z
Z
(5)
where
R
j andX
j are the resistance and the reactance at thejth
frequency and they are real.W
ˆ
j( )
Z
consists of a group of rational functions, which have known roots[17], as shown in the following expression:2 1 2 2 2 2 1 0 0
ˆ
( )
(
)
(1
)
N k j k j k j k kA
i
A
W
i
Z
Z
Z DZ
Z
D
¦
(6)where
Z
0k is the inherent frequency,D
0.35
is a smoothing factor. Then the time-domain impedanceboundary condition can be expressed in a recursive formulation[17]:
>
2 1 2@
1 0( )
( )
( ) (
)
( )
N k( )
k( )
ku t
u t
W
W
u t
W W
d
u t
I
t
I
t
f³
|
¦
(7) where: 2 1 2 1 2 1( )
2 12
( )
k(
)
k 2 1(
)
i t i t k k kt
I
t
P
u t
e
Z 'u t
t
e
Z 'I
t
t
' ª
¬
'
º
¼
'
(8) 2 2 2( )
2( )
(
)
2(
)
2
k k i t i t k k kt
I
t
P
' ª
¬
u t
e
Z 'u t
'
t
º
¼
e
Z 'I
t
'
t
(9)The coefficients
P
2k1,P
2k,Z
2k1,Z
2k can be solved as Fung and Ju[17] proposed.2.3 Validation of TDIBC
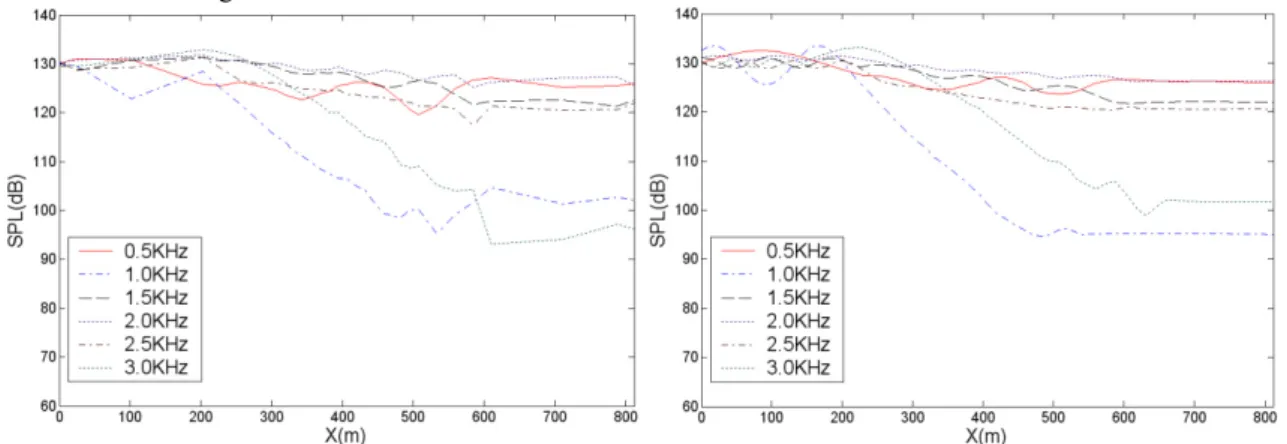
The NASA Langley grazing impedance tube (GIT) test data were used to validate the TDIBC[18]. The inputs of the test tube were plane waves with a range of frequencies between 500Hz and 3000Hz. The CT57 liner with a length of 390 mm was located on the upper wall. The test section side-walls from which the SPL data were acquired were rigid and the termination of the duct was anechoic.
The impedance data of 2D-FEM[18] is used for constructing the effective TDIBC. According to Chen and Zhang[19], numerical tests are performed at six discrete frequencies: 0.5; 1.0; 1.5; 2.0; 2.5; 3.0 (KHz) at
Mach=0.335. The comparison between measured data and CAA results are given in figure 1. It can be seen that the numerical results agree well with the measured data.
Fig. 1. (a) Measured SPL distribution; (b) SPL prediction of the liner at six discrete frequencies 3.The optimization framework
3.1 Adjoint-based shape optimization procedure
In this section, the unsteady continuous adjoint-based shape design optimization is first performed. The proposed novel continuous adjoint-based acoustic propagation method is highly efficient for inlet noise design problem. In practical implementations of the adjoint method, a design code can be modularized into several components such as the flow solver, acoustic solver, adjoint solver, geometry and mesh modification algorithms, and the optimization algorithm. The details of derivation of the gradient are given in Appendix 1. The details of derivation of the corresponding adjoint equation and its adjoint boundary condition for this situation are also given in Appendix 1. The shape optimization procedure is described in Fig.2.
1) The configuration of the inlet is parameterized by the Hicks-Henne method [20] and a cost function is defined. 2) The sound propagation and radiation computations are evaluated. First, the mean flow is evaluated by using FLUENT. Second, the noise propagation and radiation is calculated using our CAA code.
3) Then the acoustic continuous adjoint equations are solved for the adjoint variables subject to the adjoint boundary conditions.
4) Next the gradients of the design variables are evaluated and the aerodynamic shape is updated based on the direction of steepest descent. Then the mesh deformation strategy introduced by Jameson[21] and Burgreen et al. [22] is used and the grid points are modified along each grid index line projecting from the surface.
5) Repeat steps 2-4 until the solution converges or the optimum geometry is achieved.
3.2 Kriging-based liner optimization method
In this work, liner design problems are formulated based on the optimum inlet. The design parameters are the design parameters of the liner, and the objective functions are overall sound pressure level (OASPL) at a far-field position of 30.5m. The whole liner optimization algorithm in this approach is as follows, as also shown in Fig. 2.
1) Sample points should be selected from the search region. In this study, the Latin hypercube method is used for the space-filling. A total of 50 sample points (liners) are selected from the initial search region.
2) The sample points are evaluated. The CAA computation of 50 sample liners were evaluated using a CAA code, respectively.
3) With 50 OASPL of the sample data obtained, the Kriging parameter[23] is determined.
4) Once a Kriging model for OASPL is constructed, the model should be validated. And predictions from the Kriging model are validated by comparing the results obtained by CAA calculations.
5) To obtain a more complete picture regarding the OASPL, a genetic algorithm is used to obtain the Pareto front for the objective based on estimated objectives from the Kriging model.
6) Predictions from the pareto points are validated by comparing the results obtained by CAA results (OASPL). 7) If the convergence is not achieved, add the newly available OASPL to the data set and rebuild the kriging model.
8) The whole process is repeated until some form of convergence is achieved, or an acceptable liner design has been obtained. Baseline Mean flow computation Sound field computation Adjoint equation computation Compute objective function and gradient Objective and adjoint
boundary condition Design variables Mesh deformation optimum shape optimizer New inlet geometry
Liner design space sampling using Latin hypercube method CAA solution for obtaining OASPL Construct a kriging model for OASPL
Validation of the kriging model Search on the response surface using GA algorithm
Optimum liner Database augmentation using CAA results end Shape optimization Liner optimization Fig. 2 Procedure of the optimization process
4.Results and discussions
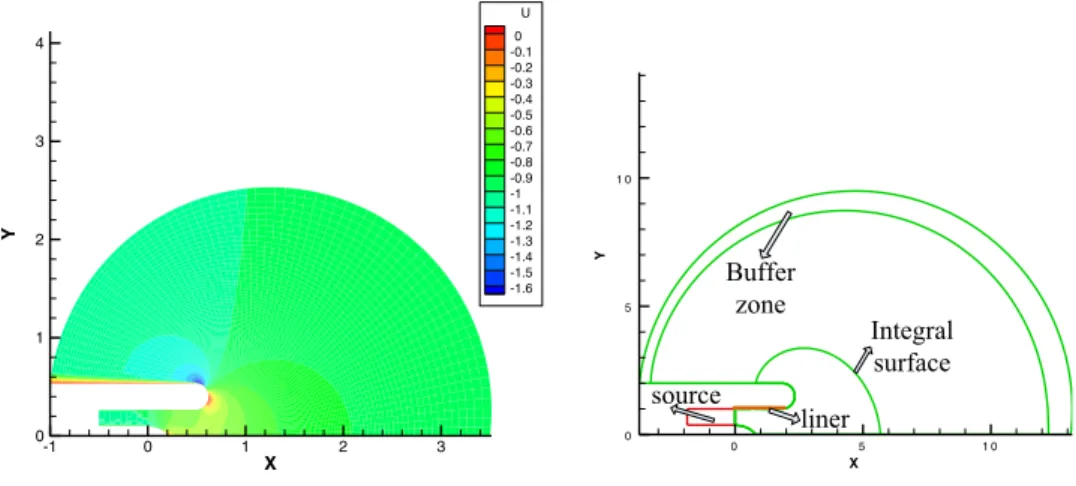
In this section, the proposed shape and liner optimization algorithm are applied to the design of a 2D inlet in an attempt to minimize the sound generation at the far-field. The background mean flows for an axi-symmetric generic inlet case are solved first. The aerodynamic conditions are issued from a NASA JT15D static engine test. This experiment is used to test the acoustic propagation in non-uniform mean flow and complicated curved geometry. A more detailed description of the JT15D inlet configuration can be found in Ref. 24. A circumferentially uniform array of 41 rods was placed in front of the 28 fan blades in order to generate a dominant spinning mode (m= -13) at the blade passage frequency (BPF). The far-field acoustic data consisted of 1/3rd octave band levels at BPF which was adjusted to free-field and a 30.5m (100ft) radius. The mode was computed at a blade passing frequency (BPF)
of 3150 Hz, a free-stream mach number of 0.175. A buffer zone is used to absorb the reflective spurious waves, as well as to accommodate incoming modal waves inside the duct. Other buffer zones were placed around the outer boundaries of the computational domain. The numerical simulations of flow fields are performed by solving the steady compressible Reynolds averaged NS equation using ANSYS FLUENT 12.0. The desired convergent target of each CFD simulation is to make the root mean square residuals of the momentum and mass equations, energy equation, and turbulence equations reach or even lower than 1e-6. The mean velocity of the mean flow can be observed around the baseline from fig.3(a). Figure 3(b) shows the computational domain of the inlet for noise solution. X Y -1 0 1 2 3 0 1 2 3 4 U 0 -0.1 -0.2 -0.3 -0.4 -0.5 -0.6 -0.7 -0.8 -0.9 -1 -1.1 -1.2 -1.3 -1.4 -1.5 -1.6 X Y 0 5 1 0 0 5 1 0 source Integral surface Buffer zone liner
Fig. 3. (a) Mean velocity of NASA JT15D inlet; (b) Computational domain of the inlet for noise solution
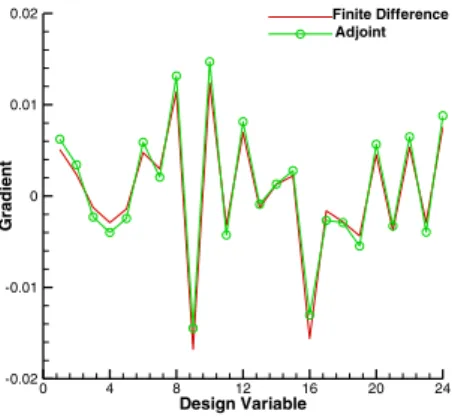
For this optimization there is now geometry change with the varying design space and so the adjoint-based shape optimization method has to be employed at each design iteration. Figs. 4 show the components of the gradients of the 24 design variables. The 24 design variables span from the leading edge to the trailing edge along the lower surface. In Fig. 4, the sensitivity derivatives computed through the numerical solution of the adjoint equations, on the starting geometry, are compared with the same quantities approximated using finite-diơerence schemes. This gradient accuracy is definitely good enough for an optimization procedure. In this case, the steepest descent method, driven by the derivatives computed by the adjoint method, converged about three orders of magnitude of gradient norms with 20 cycles in Fig. 5(a). The procedure searches further around the local optimum after achieving a minimum but finds no additional improvement. The convergence histories of the noise minimizations in Fig. 5(b) show that this objective function is mainly reduced in the first ten iterations and that the scaled objective function value are reduced significantly. The sum amplitude of the sound pressure for the optimized shape is reduced to 75.3% of the initial value of the original geometry I= 8.15e-7, which is used to scale the objective function values to ease comparisons.
Figure 6(a) shows the geometry of the baseline and optimum inlet. The acoustic pressure is solved for the (m,n)=(-13,0) mode and comparisons of the predicted far field directivity between the baseline and the optimum geometry are shown in Fig. 6(b), where far-field Sound Pressure Level(SPL) are on a 30.5 m circular arc, referenced
to 20μPa. It can be seen from Fig. 6(b) that the overall directivity pattern in far-field is dominated about 60 degrees, which is the main radiation peak of the n=0 mode. The differences in the peak radiation level between the baseline results and the optimized results are about 1.1 dB, whereas the peak radiation angles differ from each other by about 1.2 deg. In other parts of the directivity, the patterns are also similar.
Design Variable Gr a d ie nt 0 4 8 12 16 20 24 -0.02 -0.01 0 0.01 0.02 Finite Difference Adjoint
Fig. 4 Objective functional gradient components computed using the adjoint method and the finite-difference scheme.
Cycle Gr a d ie n t n o rm 5 10 15 20 0 0.005 0.01 0.015 0.02 Cycle s c a le d obj e c ti v e func ti o n v a lue 0 5 10 15 20 0.5 0.6 0.7 0.8 0.9 1
Fig. 5. (a) convergence histories of the gradient norm; (b) Convergence histories of the scaled objective function value.
X Y 0 20 40 60 25 26 27 28 29 30 31 32 33 34 35 optimum,upper surface baseline,upper surface baseline,lip
Fig.6. (a) the enlarge picture of the baseline and optimum inlet geometry; (b) far-field directivity patterns of the baseline and optimized geometry using a FWH integral.
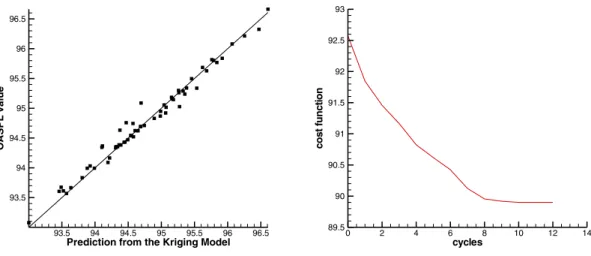
After the novel continuous adjoint-based shape optimization method has been applied to design the intake, the optimization of liner is then carried out on the obtained optimal intake. The effect of an acoustically treated inlet is investigated by the inclusion of an acoustic liner. The liner is modeled using the time domain impedance boundary condition described earlier. The effect of acoustic treatment within the inlet is simulated by an acoustic liner on the lower duct wall extending from x=0.0 to x=2.0 and labeled “liner” in Fig. 3(b). The cost function of the liner optimization is the OASPL at a far-field position of 30.5m. The constraint range of resistance R is 0.3 to 5.5 while that of reactance X is -1.5 to 1.5. An assumption of equal amplitude distribution was proposed and constant changes of the resistance R and the reactance X were also assumed at all discrete frequencies. The lower the cost function value, the better the optimization would be. The objectives are estimated using the RSM surrogate models. The surrogate model built from 50 CAA calculations using the best set of hyper-parameters is searched using a genetic algorithm (GA) with population size and number of generations set as 60 and 100, respectively. Figure 7(a) illustrates the ability of the Kriging model to predict function values at new data points. As shown in figure 7(b), the liner optimization converged within 12 cycles. The procedure searches further around the local optimum after achieving a minimum but finds no additional improvement. The optimized impedance is listed in table 1. Figure 8 shows pressure contours of hard wall case of the optimized geometry, which is compared with the result of liner optimization. And figure 9 shows comparisons of the predicted far field directivity between the optimum geometry and the optimum liner. It also shows that the liner optimization provides about a 2.2 dB reduction in the peak radiation angles.
Prediction from the Kriging Model
OA S P L v a lue 93.5 94 94.5 95 95.5 96 96.5 93.5 94 94.5 95 95.5 96 96.5 cycles co st fu n c ti o n 0 2 4 6 8 10 12 14 89.5 90 90.5 91 91.5 92 92.5 93
Fig. 7. (a) comparison of OASPL values and predictions from the Kriging model on new points of the configuration; (b) The history of the objective function during the liner optimization using Kriging surrogate model.
Table 1 Optimized impedance values
Frequency(KHz) R X 0.5 1.52 -1.78 1.0 1.33 -0.56 1.5 2.31 0.61 2.0 7.56 0.88 2.5 2.07 -2.11 3.0 1.78 -0.83
X Y -2 0 2 4 6 0 2 4 6 8 P 2E-05 1.2E-05 4E-06 -4E-06 -1.2E-05 -2E-05 X Y -2 0 2 4 6 0 2 4 6 8 P 2E-05 1.2E-05 4E-06 -4E-06 -1.2E-05 -2E-05
Fig. 8 (a) acoustic pressure contours of the baseline;(b) acoustic pressure contours of the optimized geometry.
Fig. 9 Far-field directivity patterns of the optimized geometry and optimized liner
The obtained results show that the combined shape and liner optimization can effectively change the SPL and directivity pattern in the far field, namely the optimum geometry with the optimized liner has a low noise performance.
5.Conclusion
This paper explores the use of a combined shape and liner optimization method to minimize the far-field sound from an inlet. To obtain improved designs, we first use the novel adjoint-based shape optimization method to design the inlet. The numerical tools developed here reflect an effective and direct approach, efficiently improve inlet aeroacoustics design. A typical inlet has been used to demonstrate the feasibility of the continuous adjoint method. With the optimization system based on Gaussian process-based Kriging and a genetic algorithm, the acoustic liner on the lower duct wall is optimized successfully and effectively. The obtained innovative low noise geometry with optimized liner indicate that the combined optimization algorithm proposed, which uses a adjoint-based shape optimization approach in combination with a kriging-based liner optimization method, is effective and efficient used to optimize 2D inlet within a reasonable number of cycles to minimize the noise at a given far-field position.
Acknowledgements
The funding of the “973 Program” (Grant No. 2012CB720201) is gratefully acknowledged. The authors also
wish to thank the anonymous reviewers for their valuable comments in the reviewing process. Appendix A.
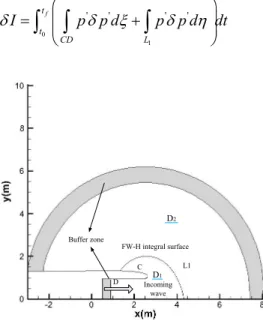
The general formulation of the acoustic design problem using remote continuous adjoint method has been thoroughly documented in previous work [21]. To obtain improved designs, we define objective function as the line integral of the amplitude of sound from an inlet on the wall and integral line. The cost function for noise minimization is 0 1 ' 2 ' 2 1 1 ( ) ( ) 2 2 f t t L CD I §¨ p d
[
p d dtK
·¸ © ¹³ ³
³
(10) where line CD is the upper surface and the lower surface of the inlet (Fig. 10). And line L1 composes the integral surface. The variation in the cost function is0 1 ' ' ' ' f t t CD L
I
p p d
p p d dt
G
§
¨
¨
G
[
G
K
·
¸
¸
©
¹
³ ³
³
(11) L1 C D FW-H integral surface Incoming wave Buffer zone D1 D2Fig. 10 The sketch of thecomputational domain of an inlet For convenience, the 2.5D LEE equation is linearized, after which it takes the form
'
0
t
[
K
w
w
w
w
w
w
W
F
G C W
(12) where' ' ' '
/
u
J
v
wt
U
ª
º
«
»
«
»
«
»
«
»
¬
¼
W
' ' ' ' 0 0 0 0 ' ' ' 0 0 0 ' ' ' 0 0 0 ' 0 0 ( ) ( ) 1 ( ) / 1 ( ) ( ) x r x r r x x r u u v v u u u v J v v v u wt u v U U [ U U [ U [ [ U U [ [ U [ [ ª º « » « » « » « » « » « » « » « » ¬ ¼ F ' ' ' ' 0 0 0 0 ' ' ' 0 0 0 ' ' ' 0 0 0 ' 0 0 ( ) ( ) 1 ( ) / 1 ( ) ( ) x r x r r x x r u u v v u u u v J v v v u wt u v U U K U U K U K K U U K K U K K ª º « » « » « » « » « » « » « » « » ¬ ¼ G 0 0 0 0 0 0 ' 0 0 0 0 0 0 0 0 0 0 0 0 0 0 0 0 0 0 ( ) r r r r x x x x x x r r v m r kr v v u u v v u u v u u v v mk r r U [ K [ K [ K [ K [ K [ K [ K [ K [ K [ K U [ K [ K ª º « » « » § w w · w w « » ¨ ¸ « ©w w ¹ w w » « » « § w w · § w w · » « ¨w w ¸ ¨w w ¸ » © ¹ © ¹ « » « w w w w » « w w w w » « » ¬ ¼ C (13) The variation in the sound solution can be written as
(
') 0
t
G
[
G
K
G
G
w
w
w
w
W
w
F
w
G
C W
(14)Multiplying by a co-state vector
\
\
, also known as Lagrange Multiplier, and integrating over the domain and time produces 0 '(
)
0
f t T t DdDdt
t
G
G
G
G
[
K
ª
w
w
w
º
«
w
w
w
»
¬
¼
³ ³
\
W
F
G
C W
(15)Here
G
F
can be split into contributions associated withG
w
andG
S
using a similar notation( x) ( r) ( )x ( x) ( )r ( r) J J J J J J [ [ [ [ K K G G«ª »ºG«ª »º G G G G ¬ ¼ ¬ ¼ F A w B w A w A w B w B w ( x) ( r) ( )x ( x) ( )r ( r) J J J J J J K K K K K K G G«ª »ºG«ª »º G G G G ¬ ¼ ¬ ¼ G A w B w A w A w B w B w (16) For the first part of (15), we have
0 0 0 0 0 1 1 1 1 ( ) [ ( ( ) ( ))] [ ( ) ( )] f f f f f t T t T T t t t D D t t T t T t D D t dDdt dt dD t t J J dD J J dtdD t
G
G
G
G
G
G
G
w w ª º ª º ¬ ¼ « w » w ¬ ¼ w w³ ³
³
³
³
³ ³
W W W w w w w\
\
\
\
\
(17)³ ³
³ ³
³ ³
³
³
³ ³
³
³
³
F G F F G G F F F F \ \ \ \ \ \ \ \ \ \ (18)The domain can then be split into two parts as shown in Fig. 15. First, the near field domain (D1 ) whose
boundaries are the solid surface and the integral line. Second, the far field domain (D2 ) which borders the near field domain along the integral line and the far field boundary.
\
\
and\
\
are the values of\
\
above and below the integral line.The last term of (15) can be written as 0 0 ' ' '
(
)
( )
f f t t T T t D t DdDdt
dDdt
J
J
G
ª
G
G
º
ª
º
«
»
¬
¼
¬
¼
³ ³
\
C W
³ ³
\
w
C
C
w
(19)All these three parts may be integrated to give
0 1 1 2 2 0 0 1 1 ' ' [ ( ) ( )] ( ) 0 f f f t T D t t T T T T i i i i i i B D B D i i t t T t D J J dtdD t n dB dD n dB dD dt dDdt J J [ [ [ [G
G
G
G
G
G
[
[
G
G
w w § w w · ¨ w w ¸ © ¹ ª º « » ¬ ¼³ ³
³ ³
³
³
³
³ ³
w w F F F F C C w w\
\
\
\
\
\
\
(20)Consequently, the variation of the inviscid flux at the wall boundary reduces to
' ' 0 0 ' 0 ' 0 ' 0 0 0 ( ) ( ) 1 ( ) 1 ( ) 0 0 x r x x c y r u v J J J J p J J K K U G U G K K U G U U G G K K U G U U ª º ª º « » « » « » « » « » « » « » « » « » « » « » « » « » « » « » « » ¬ ¼ «¬ »¼ G (21)
>
@
>
@
0 0 ' ' 0 0 ' 0 ' 0 1 2 3 4 1 2 3 4 ' 0 0 ' ' 2 3 1 0 0 0 0 ( ) ( ) 1 ( ) 1 ( ) 0 0 ( ) [ f f t T t CD x r x x t r t CD r x r d dt u v J J J J p d dt J J p u J J G [ K K U G U G K K U G U U \ \ \ \ G \ \ \ \ [ K K U G U U K K \ \ G \ U G U U ª º ª º½ ° « » « »° ° « » « »° ° « » « »° ° « »° ® « » « »¾ ° « » « »° ° « » « »° ° « » « »° ¬ ¼ ° «¬ »¼° ¯ ¿ ³ ³
³ ³
G \ 0 ' ' ' 0 2 3 0 0 1 1 ( ) ( )] ( ) ( ) f t x r x r t CD v p p d dt J J J J K U G K \ G K \ G K [ U U § ·½ ° ° ® ¨ ¸¾ ° © ¹° ¯ ¿³ ³
(22)Consequently the variation of the inviscid flux at the integral line reduces to
> @
' ' ' ' ' ' 0 0 0 0 0 0 ' ' ' 0 0 0 ' ' ' ' 0 0 0 ' ' 0 0(
) ( ) (
) ( )
1
(
) ( )
( )
1
(
) ( )
( )
( )
( )
0
w I II II x r x y x r x o x r y o x rp
p
u
v
u
u
v
v
J
J
J
u u
u v
J
J
J
p
v v
v u
J
J
J
wt u
wt v
J
J
G
G
G
G
G
[
[
[
[
U
U G
U
U G
[
[
[
U
G
G
U
U
G
[
[
[
U
G
G
U
U
[
[
G
G
w
w
ª
ª
º
«
«
»
«
«
»
«
«
»
«
«
»
«
«
»
«
«
»
«
«
»
«
»
«
»
¬
¼
¬
F
F
w
F
F
F
º
»
»
»
»
»
»
»
«
»
«
»
«
»¼
(23)Similarly, using formulations (23) , we can have
1 2 3 0 1 0 1 1 2 ' 0 0 1 2 3 ' ' ' ' 0 0 0 0 1 ' ' ' 0 0 2 0 ' ' ' 0 0 0 ( )( ) ( )( ) 1 ( ) ( ) ( ) 1 ( ) ( ) f f t t T x r x r o o t L t L x r x r r u v d dt p d J J J u u v v J J u u u v J J v v v u J [ [ [ [ G K \ \ \ \ \ \ G K U U [ [ G U U G U U \ \ [ [ U G G \ \ U [ U G G U ª º « » ¬ ¼ ª º « » ¬ ¼ ª º « » ¬ ¼³ ³
\ \ F³ ³
0 1 3 3 ' ' 0 0 4 4 ( ) ( ) ( ) f t t L x x r d dt J u wt v wt J J K [ \ \ [ [ G G \ \ ½ ° ° ° ° ° ° ° ° ° ° ® ¾ ª º ° ° « » ° ¬ ¼ ° ° ° ° ª º ° ° «¬ »¼ ° ¯ ¿³ ³
(24)Note that the coordinate transformation is such that
G
S
is negligible in the far-field and the line integral of common side of two neighboring blocks inside the whole domain will be cancelled. Then we substitute Eqs. (22) and (24) into Eq. (20). Since the left hand expression of (20) equals zero, it may be subtracted from the variation in the cost function (10) to give1 2 3 1 ' ' ' 2 3 0 ' ' ' ' 1 0 0 2 3 0 0 0 ' ' 0 0 ' 1 2 3 0 1 1 [ ( ) ( )] ( ) ( ) f f f t x r o o CD t x r x r CD t x r x r o o L I p p p d dt J J u v p p d dt J J J J u v p p p d J J J K K G G \ \ G [ U U K K K K \ U G U G \ G \ G [ U U [ [ [ [ G \ \ \ \ \ \ G K U U § § · · ¨ ¨ ¸ ¸ ¨ © ¹ ¸ © ¹ § · ¨ ¸ © ¹ ª § · º « ¨ ¸ » © ¹ ¬ ¼
³ ³
³ ³
³ ³
1 2 3 ' ' ' ' 0 0 0 0 1 ' ' ' 0 0 2 0 ' ' ' 0 0 3 0 ' ' 0 0 4 4 ( )( ) ( )( ) 1 ( ) ( ) ( ) 1 ( ) ( ) ( ) ( ) ( ) x r x r x r x r dt u u v v J J u u u v J J v v v u J J u wt v wt J J [ [ G U U G U U \ \ [ [ U G G \ \ U [ [ U G G \ \ U [ [ G G \ \ ª º ½ °«¬ »¼ ° ° ° ° ª º ° ° « » ° ° ¬ ¼ ° ® ¾ ª º ° ° « » ° ¬ ¼ ° ° ° ° ª º ° «¬ »¼ ¯ ¿ 1 0 0 0 0 ' 1 0 ' 1 ( ( ) ( ) ) ( [ ( ) ( ) ] [ ( ) ( ) ] ) [ ( )] ( ) f f f f f t L t T T T T x r x r D t T T x r x r D t t T t T D t t D d dt C J dtdD t J J J J J dtdD J J J J J dtdD dDdt t J K [ [ K K G [ K [ [ K K G G G G [ K G G ° ° w w w w w w w w ½ ® w w ¾ ¯ ¿ w w³ ³
³ ³
³ ³
³ ³
³ ³
A B A B w A B A B w C w w \ \ \ \ \ \ \ \ (25)The variation
G
w
can be eliminated from (25) to produce a differential adjoint system governing\
\
1 ' 1 2 1 ( T T ) T 0 J t [ K J w w w w C w C w C \ \ \ \ where 1 x r, 2 x r J J J J [ [ K K C A B C A B Since the initial condition for the Lagrange multipliers are set to zero, then(0) 0
T
\
\
Since the noise problem is periodic in nature and that the cost function used for this problem is not dependent up on
t
f , then ( ) 0 T f t \ \Thus, by letting
\
\
satisfy the boundary condition, then ' 2 x 3 r o o p J JK
K
\
\
U
U
1 2 3 1 ' 2 3 1 4 0 x r o o p on L J J \ \ [ \ \ [ \ \ U U \ ° ° ® ° ° ¯
The variation of cost function
G
I
finally reduces to the following 2 1 3 0 ' 2 3 0 ' ' ' 0 0 2 0 0 ' ' ' 0 0 3 0 ( ) ( ) 1 ( ) ( ) ( ) 1 ( ) ( ) ( ) ( [ ( ) ( ) ] [ ( ) f f f t x r o CD x r t L r x t T T x r x D t p I d dt J J u u u v J J d dt v v v u J J J J J K K G \ G \ G [ U [ [ U G G \ \ U K [ [ U G G \ \ U [ [ K G G G G [ K § · ¨ ¸ © ¹ ª º ½ °« » ° °¬ ¼ ° ® ¾ ª º ° ° « » ° ¬ ¼ ° ¯ ¿ w w w w³ ³
³ ³
³ ³
\ A B \ A 0 0 ' 1 ( ) ] [ ( )] ( ) f f r t T t T D t t D dtdD J C J dtdD dDdt t J K G G ½ ® ¾ ¯ ¿ w w³ ³
³ ³
B w w \ \ w (26)The GIof equation (26) is the cost function to be used for the optimization, which can then provide a direction of improvement to reduce the objective function.
References
[1]S. Zheng, M. Zhuang, and F.Thiele, Noise prediction and optimization system for turbofan engine inlet duct design. In: 10th AIAA/CEAS Aeroacoustics Conference, Manchester, AIAA 2004-3031, 2004, pp.1-10.
[2]P. Moinier, , J. D. Muller, and M. B. Giles, Edge-based Multigrid Schemes and Preconditioning for Hybrid Grids. AIAA Journal, 40(2002) 1954-1960.
[3]Free-Field-Technologies-S.A. ACTRAN 2004, 16 Place de l’Univeresite B-1348 Louvain-la-Neuve, Belgium, 2004.
[4]S. Shahpar, SOFT: A New Design and Optimisation Tool for Turbomachinery. Evolutionary Methods for Design, Optimisation and Control, CIMNE, Barcelona, 2002, pp.1-12.
[5]F. L Pan, and J. Coupland, An Integrated Optimization System for Low Noise Nacelle Design. In: 11th AIAA/CEAS Aeroacoustics Conference (26th AIAA Aeroacoustics Conference), Monterey, California, AIAA 2005-2945,2005, pp.1-16.
[6]R. Sugimoto, and R. J. Astley, Validation and application of a hybrid prediction scheme for bypass duct noise. In: 12th AIAA/CEAS Aeroacoustics Conference, Cambridge, MA, USA, AIAA paper 2006-2520, 2006,pp.1-13.
[7]C. McAleer , R. J. Astley, , K. Holland, , R. Sugimoto, , and A. Kempton, Fan Noise Propagation within Curved Bypass Ducts with 3D Features. In: 14th AIAA/CEAS Aeroacoustics Conference (29th AIAA Aeroacoustics Conference), Vancouver, British Columbia Canada, AIAA 2008-2878, 2008, pp.1-16.
[8]E. J.Rice, Acoustic Liner Optimum Impedance for Spinning Modes with Mode Cutoff Ratio as Design Criterion, AIAA Paper 76-516, 1976, pp. 1-13.
[9]W. R. Watson, and J. H. Robinson, Design and Attenuation Properties of Periodic Checkerboard Liners, AIAA Paper 2003-3309,2003,pp. 1-15.
[10]R. E. Motsinger, R. E. Kraft, and J. W. Zwick, Design of optimum acoustic treatment for rectangular ducts with flow, American Society of Mechanical Engineers, no. 76-GT-113, (1976) 15-36.
[11]J. A. Hamilton, and R. J. Astley, Theoretical Optimisation of an Intake Lip Liner for a A320/CFM56 Flight Tests,Technical Report D1.2-3.5-11, Silencer Consortium, 2002, pp. 1-13.
[12]L. Lafronza, A. McAlpine, A.J. Keane and R.J. Astley, Response surface method optimization of uniform and axially segmented duct acoustics liners, Journal of Aircraft, 43(2006) 1089-1102.
[13]S. Qiu, W. B. Song, and H. Liu, Shape optimization of a general bypass duct for tone noise reduction using continuous adjoint method. Proceedings of the institution of Mechanical Engineers, Part C Journal of Mechanical Engineering Science, 227 (2013) 1-16.
[14]J.E. Ffowcs Williams, D.L. Hawkings, Sound generated by turbulence and surfaces in arbitrary motion. Philos Trans Royal Soc Lond, 1969, A264(1969) 321–42.
[15]S. K. Richards, X. X. Chen, , and X. Zhang, Parallel computation of 3D acoustic radiation from and engine intake. In: 11th AIAA/CEAS Aeroacoustics Conference (26th AIAA Aeroacoustics Conference), Monterey, California, AIAA paper 2005-2947,2005, pp.1-16.
[16]X. Zhang, X. X. Chen, , C. L. Morfey, , and P. A. Nelson, Computation of fan noise radiation from a realistic engine exhaust geometry with flow. In: 9th AIAA/CEAS Aeroacoustics Conference, Hilton Head, South Carolina, AIAA paper 2003-3267, 2003, pp. 1-11.
[17]K Y Fung, H B Ju, Broadband time-domain impedance models. AIAA Journal, 39(2001) 1449-1454
[18]M G Jones, W R Watson, T L Parrott. Benchmark data for evaluation of aeroacoustic propagation codes with grazing flow. AIAA Paper 2005-2853, 2005, pp.1-15
[19]X X Chen, X Zhang, Time-domain broadband liner optimization. AIAA Paper 2010-3719, 2010,pp 1-12 [20]R. M. Hicks, and P. A. Henne, Wing design by numerical optimization. Journal of Aircraft, 15(1978) 407–412.
[21]A. Jameson, , N. Pierce, , and L. Martinelli, Optimum aerodynamic design using the Navier-Stokes equations. Theor. Comput. Fluid Dyn., 10(1998) 213-237.
[22]G.W. Burgreen, , and O. Baysal, Three-dimensional aerodynamic shape optimization of wings using sensitivity analysis. In: 32nd Aerospace Sciences Meeting and Exhibit, Reno, Nevada, January 10-13, AIAA paper 94-0094, 1994, pp.1-12.
[23]D. C. Montgomery, Design and Analysis of Experiments, 5th ed.,Wiley, New York, 2000.
[24]K. J. Baumeister, and S. J. Horowitz, Finite element-integral acoustic simulation of JT15D turbofan engine. Journal of Vibration, Acoustics, Stress, and Reliability in Design, Transactions of the ASME, 106(1984) 405-413.