Contents list available at IJRED website
Int. Journal of Renewable Energy Development (IJRED)
Journal homepage: http://ejournal.undip.ac.id/index.php/ijred
Enhanced Grey Wolf Optimizer Based MPPT Algorithm of
PV System Under Partial Shaded Condition
Ch. Santhan Kumar
a*and R. Srinivasa Rao
a
aDepartment of Electrical and Electronics Engineering, JNT University Kakinada, Kakinada, Andhra Pradesh 533003, India
ABSTRACT: Partial shading condition is one of the adverse phenomena which effects the power output of photovoltaic (PV) systems due to inaccurate tracking of global maximum power point. Conventional Maximum Power Point Tracking (MPPT) techniques like Perturb and Observe, Incremental Conductance and Hill Climbing can track the maximum power point effectively under uniform shaded condition, but fails under partial shaded condition. An attractive solution under partial shaded condition is application of meta-heuristic algorithms to operate at global maximum power point. Hence in this paper, an Enhanced Grey Wolf Optimizer (EGWO) based maximum power point tracking algorithm is proposed to track the global maximum power point of PV system under partial shading condition. A Mathematical model of PV system is developed under partial shaded condition using single diode model and EGWO is applied to track global maximum power point. The proposed method was programmed in MATLAB environment and simulations are carried out on 4S and 2S2P PV configurations for dynamically changing shading patterns. The results of the proposed method were analyzed and compared with GWO and PSO algorithms. It was observed that proposed method is effective in tracking global maximum power point with more accuracy in less computation time compared to other methods.
Keywords: Enhanced Grey Wolf Optimizer, Maximum power point tracking, Partial shaded condition, PV system, Single diode model.
Article History: Received June 12nd 2017; Received in revised form August 13rd 2017; Accepted August 15th 2017; Available online How to Cite This Article: Kumar, C.H.S and Rao, R.S. (2017Enhanced Grey Wolf Optimizer Based MPPT Algorithm of PV System Under Partial Shaded Condition. Int. Journal of Renewable Energy Development, 6(3), 203-212.
https://doi.org/10.14710/ijred.6.3.203-212
*Corresponding Author: +919885554065; Fax: 08847772000
Email: [email protected]
1. Introduction
Almost all the countries in the world are adopting solar photovoltaic systems as an alternative to conventional power generation due to several advantages like reduced green house gas emission, inexhaustible nature of solar energy, eco-friendly nature etc. India is also targeting 100 GW of electrical power generation by 2022 through small and large-scale solar parks to meet the growing power demand (JNNSM, 2016).
The PV system is equivalently represented in single or two-diode model and due to its low efficiency, it is necessary to operate it at maximum power point (MPP) in order to attain highest power output. PV systems are subjected to several atmospheric conditions, partial shaded condition (PSC) is one such phenomenon, where PV modules are subjected to partial shading (due to passing clouds, building shadows, bird waste etc.). When PV system is
subjected to PSC its nonlinear characteristics exhibit multiple maximum power points due to bypass diode
operation across shaded modules (Silvestre et al.
2009), therefore it is necessary to operate at global MPP.
There are many methods available to mitigate the effect of PSC viz. MPPT Controllers, PV Array
Reconfiguration, Power electronic converter
configurations etc. In this work MPPT controller is used to operate PV system at global MPP under PSC. Though classical MPPT techniques like Perturb and Observe (P&O), Incremental Conductance (INC), Hill Climbing (HC) etc. work efficiently to track MPP under uniform shaded condition, but fails to track
global MPP under PSC (Ankit et al. 2016, Deepak et
al. 2016). In literature, some of the authors (Makbul
et al. 2017, Saravanan et al. 2016) applied intelligence based techniques like ANN and Fuzzy systems to extract maximum power under PSC, but these
P a g e | 204
techniques need proper training and rules
formulations, which are system dependent.
In recent times, meta-heuristic based MPPT techniques became popular because of their accuracy
and system independency (Zainal et al. 2013). Several
authors proposed MPPT algorithms based on Particle
Swarm Optimization (Ishaque et al. 2012 – Liu et al.
2012), Artificial Bee Colony (Sundareswaran et al.
2015), Ant Colony Optimization (Jiang et al. 2013),
Cuckoo Search (Ahmed et al. 2014), Firefly
(Sundareswaran et al. 2014), Grey Wolf Optimizer
(Satyajit et al. 2016) and Whale Optimization
Algorithm (Santhan et al. 2016). All these algorithms
differ noticeably in terms of accuracy, efficiency, tracking time and complexity (Jordehi 2016). In general, MPPT techniques are classified into direct and indirect control techniques based on the decision variable employed in tracking the MPP.
In conventional GWO Algorithm, δ and ω wolves
participate in search process, as they are subordinates
to α and β, these wolves does not contribute much in
hunting the prey (Mirjalili et al. 2014).
In this paper, an Enhanced Grey Wolf Optimizer (EGWO) MPPT Algorithm is proposed by eliminating
the δ and ω wolves phase, entire herd is considered as
α and β wolves, where α is the leader for the herd
and gives optimal solution. Hence, the proposed EGWO leads to quick search process to track global MPP in less time.
The rest of the paper is as follows: Section 2 briefly describes modeling of PV system under partial shaded condition; Section 3 gives an overview of conventional GWO and proposed EGWO algorithm and its application for MPPT of PV system; Section 4 presents the results and comparison; and finally conclusions are given in section 5.
2. Characteristics of PV system under PSC 2.1 Photovoltaic module
The Equivalent circuit diagram for Single diode PV cell is shown in Fig. 1.
Fig. 1 Single diode model PV cell
Single diode model of PV cell is mostly used in modeling of PV system due to reduced complexity and
computational efficiency over two-diode model
(Giuseppina et al. 2014, Sangram et al. 2016).
The output current of PV cell is written as
) ( ] 1 ) ) ( ( [ 0 sh s c c s c c PV c R R I V KTA R I V q e I I I (1)
where Ic is PV cell output current, Vc is PV cell
output voltage, Ipv is photo current, Io is diode reverse
saturation current, Rs and Rsh are series and shunt
resistances, q is charge of an electron (1.6 × 10⁻¹⁹ C), A
is diode ideality factor, K is Boltzmann’s constant
(1.38 × 10⁻²³ N-m/K), T is panel operating temperature
(in Kelvin).
The output current of PV module with Ns number of
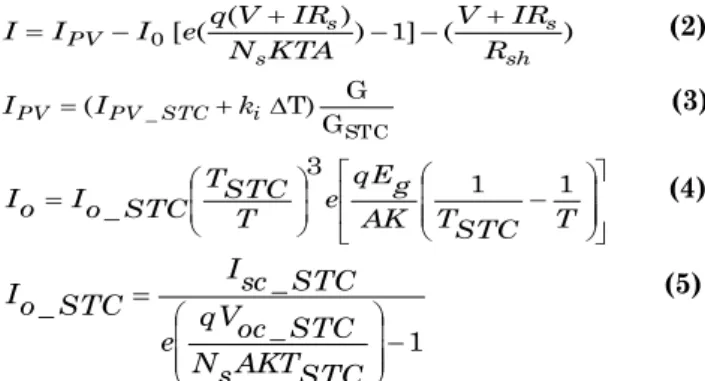
PV cells is given as ) ( ] 1 ) ) ( ( [ 0 sh s s s PV R IR V KTA N IR V q e I I I (2) STC _ G G T) ( PV STC i PV I k I (3) T STC T AK g qE e T STC T STC o I o I 1 1 3 _ (4) 1 _ _ _ STC AKT s N STC oc qV e STC sc I STC o I (5)
where V is PV voltage, I is PV current, Vt is thermal
voltage of PV module, IPV_STC is photo current at
standard test conditions (STC), ki is current
temperature coefficient, G is solar irradiation in
kW/m2, ∆T is temperature change (∆T=T-T
STC) in
Kelvin, Io_STC is diode reverse saturation current at
STC, Egis energy band gap (eV), Voc_STC andIsc_STC are
open circuit voltage and short circuit current of PV module at STC.
In order to get the module voltage, (2) is modified as
s o sh s o ph IR I R R I I I V 1 ln q KTA Ns (6)
2.2Modeling of Partial shading condition
A PV system is modeled using four PV modules and these are represented in the form of four series (4S) and two series two parallel (2S2P) PV configurations as shown in Fig. 2.
Assume each PV module in Fig. 2(a) receives same
irradiation of 1000 W/m2 and rating of each module is
200 W at STC. As irradiation is same, bypass diodes
Ic
Rs
+
ID
Iph Rsh Vc
-are reverse biased resulting same current flows through all modules and P-V characteristics of array exhibit only single peak MPP.
(a) (b)
Fig. 2 (a) 4S PV configuration (b) 2S2P PV configuration
When a string is subjected to partial shading,
module G4 receives less irradiation (500 W/m2) while
other modules in the string receives 1000 W/m2. The
module G4 acts as load instead of generator and it tries to take the current generated from non-shaded modules. The bypass diode is forward biased and protects the shaded module from being damaged. Due to diversion of current by bypass diode, PV characteristics have multiple peaks of which one is global MPP with reduced output. If bypass diode is removed, array exhibit only one peak but output is drastically reduced. The blocking diodes shown in Fig. 2(b) prevent the reverse current from other strings due to voltage mismatch between two strings.
Output voltage of jth module from (6) is obtained by
comparing photo current of jth module with its
corresponding string current Isi as follows :
, 0 , 1 ln q KTA s N i s I ij pv I i s I ij pv I s R i s I o I sh R s R i s I o I ij pv I ij V (7)
where Vij is voltage across jth module of ith string
By varying current in the string (Is) from zero to
photo current of module with higher irradiation,
output voltage of ith string of PV array is given by
m n ij V i s V 1 (8)where m is number of series connected modules in a
string.
Output current of PV array is given by
s k i I I 1 (9)where s is number of parallel connected strings in an
array
3. Enhanced GWO and its application to MPPT 3.1 Overview of Grey Wolf Optimizer
Grey Wolf Optimizer (GWO) is a new meta-heuristic algorithm for non-linear optimization problems from family of swarm intelligence and it is inspired from grey wolves; it mimics the leadership hierarchy and hunting mechanism of grey wolves in nature. In GWO, there are four types of grey wolves
such as alpha (α), beta (β), delta (δ) and omega (ω) and
they have very strict social dominant hierarchy as shown in Fig. 3, where dominance of wolves decreases
from top to bottom. In GWO, α wolves are leaders of
the herd and gives fittest solution of optimization
problem, β wolves are subordinates to α wolves and
they helps in decision making, ω wolves comes under
third class and δ wolves dominate ω wolves and they
have to submit to α and β(Mirjalili et al. 2014).
Fig. 3 Hierarchy of grey wolves
There are three main steps in hunting i.e., searching for prey, encircling prey and attacking the prey. The cooperation and communication between wolves gives optimal solution in least time.
Fig. 4. Hunting behavior of grey wolves: (a-c) chasing, approaching, and tracking prey (d) encircling (e) stationary situation and attack
V G1 G2 G3 G4 I - + G1 G2 G3 G4 +
-V I Is1 Is2 I ω δ β αP a g e | 206
Hunting behavior of grey wolves is shown in Fig. 4. This algorithm is simple in principle with good convergence speed and high accuracy and it has proper balance between both exploration and
exploitation phases of search process (Mirjalili et al.
2014).
3.2 Enhanced Grey Wolf Optimizer
In conventional GWO, δ and ω wolves submit to α
and β wolves and do not contribute much in hunting
the prey. This leads to higher population of search agents and wastage of time for tracking the optimal
solution. In the proposed Enhanced GWO algorithm δ
and ω phase is completely eliminated to speed up search process without compromising the accuracy of optimal solution. The modified steps to determine encircling and hunting behavior of proposed EGWO
algorithm are as follows (Mirjalili et al. 2014):
• Encircling
Each search agent encircles the prey during hunt. The encircling behaviour is mathematically modeled as (t) X (t)-X . C D p sg (10) D . A (t)-X ) (t Xsg 1 p (11)
where t is current iteration and
a
-r
.
a
A
2
1
(12) 22
.
r
C
(13)where A, C are coefficients to maintain proper balance
between exploration and exploitation, r1 and r2 are
random numbers between [0, 1] and a is linearly
decreased from 2 to 0 over course of iterations that resembles approaching the prey.
• Hunting
The positions of all search agents are updated
according to positions of best search agents Xα and Xβ,
for each iteration using following equations
sg β β sg α α C.X X , D C .X X D 1 2 (14) ) D .( A -X X ), D .( A -X X1 α 1 α 2 β 2 β (15) 2 1) X1 X2 (t Xsg (16)
Search agents finish hunt by attacking the prey when it stops moving. The position updating of grey wolves is shown in Fig. 5.
Fig. 5 Position updating of grey wolves
3.3 Application of EGWO for MPPT
The main objective is to obtain the maximized output
power P from the PV array considering duty ratio d as
the decision variable. The objective function is
formulated as follows (Santhan et al. 2016):
Maximize: P(d) (17)
Subjected:
d
min
d
d
max (18)where dmin and dmaxare limits of duty ratio.
The block diagram for MPPT is shown in Fig. 6 and the sequential steps to obtain global MPP using proposed EGWO MPPT algorithm are as follows:
Fig. 6 Block diagram for MPPT Controller
• Initialization
Initialize population Np (wolves)in search space
9 . 0 1
.
0 di between minimum limit, 0.1 and
maximum limit, 0.9 of duty ratio using (19):
min min max ) )( 1 , (N d d d rand di p (19)
In this case, Np is taken as four i.e., number of
modules in the PV system.
MPPT Boost converter Gate Drive 100 Ω V I Doptimal PV array
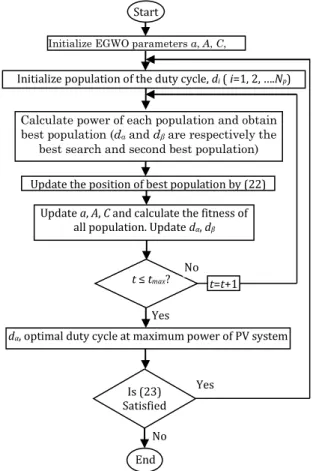
Fig. 7 Flow chart for EGWO MPPT Algorithm
• Evaluate the position of the prey
Calculate fitness values i.e., PV power of the
population. Assign dα and dβ as first and second
best population with highest PV power.
• Updating the positions of search agents
The positions of the population di are updated
according to positions of dα and dβ.
i β β i α α C.d d , D C .d d D 1 2 (20) ) D .( A -d d ), D .( A -d d1 α 1 α 2 β 2 β 21) 2 1) d1 d2 (t di (22)
where Dα and Dβ are distance of dα and dβ from
maximum power.
The PV powers are calculated for updated positions of population and finish hunt when prey stops moving i.e., when maximum PV power is obtained.
• Termination criterion
The algorithms terminates when it reaches
maximum number of iterations and outputs dα
as the optimal duty ratio to operate at
maximum power.
• Reinitialize
The algorithm reinitializes search for a change in solar irradiation using
P P P P old pv old pv pv , , (23)
where Ppv,old is power at GMPP of last operating
point, ∆P is set to 10%.
The flowchart for tracking global MPP using EGWO MPPT algorithm is given in Fig. 7.
4. Results and Comparison
To examine the performance of proposed EGWO MPPT algorithm, simulations were carried on different combinations of four PV modules i.e., four series (4S) and two series two parallel (2S2P) PV configurations subjected to three different shading patterns. The parameters of Kyocera KC 200GT PV module used in modeling the PV system are given in Appendix.
Three shading patterns of 4S PV configuration are as follows:
1) G1,G2=1000, G3,G4=600
2) G1,G2=1000, G3,G4=400
3) G1=1000, G2=600, G3=400, G4=200
Three shading patterns of 2S2P PV configuration are as follows:
4) G1=1000, G2=600, G3=1000, G4=600
5) G1=1000, G2=400, G3=1000, G4=400
6) G1=1000, G2=600, G3=1000, G4=400
4.1 4S PV configuration
The electrical characteristics of the 4S PV configuration subjected shading patterns 1, 2 and 3 are shown in Fig. 8. From figure, it is noticed that characteristics exhibit multiple peaks due to bypass diode operation across the shaded modules subjected to three different shading patterns with many local and one global MPP. The 4S PV configuration is subjected to two and four different irradiations for patterns 1, 2 and 3. The PV system must be operated at global MPP to use maximum available power.
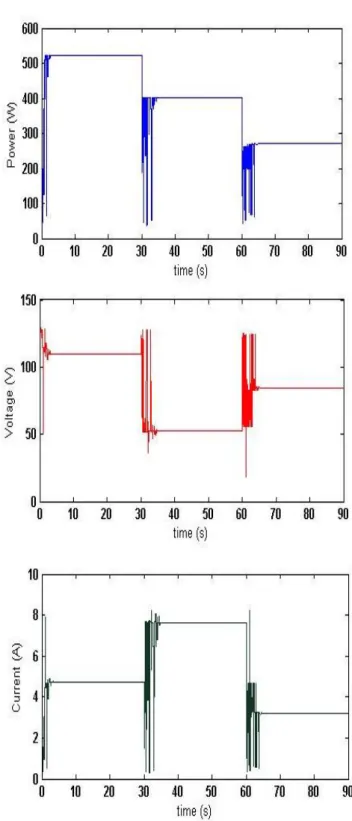
The dynamic performance of proposed algorithm is examined by operating 4S PV configuration at different shading patterns. The 4S PV configuration is subjected to shading pattern 1 from 0-30 sec, pattern 2 from 30-60 sec and pattern 3 from 60 sec. The tracking curves of power, voltage and current of PV array for proposed EGWO algorithms of 4S PV
Start
Update a, A, C and calculate the fitness of all population. Update dα, dβ
Update the position of best population by (22)
dα, optimal duty cycle at maximum power of PV system
Initialize EGWO parameters a, A, C,
t=1
Initialize population of the duty cycle, di( i=1, 2, ….Np)
Calculate power of each population and obtain best population (dα and dβ are respectively the
best search and second best population)
t ≤ tmax? No Yes t=t+1 Is (23) Satisfied Yes No End
P a g e | 208
configuration subjected to three dynamic shading patterns are shown in Fig. 9. From figure, it is noticed that proposed algorithm can efficiently track global MPP for all dynamically changing shading patterns. The algorithm reinitializes search by sensing change in PV power for a change in shading pattern at t=30 sec and t=60 sec respectively.
Fig. 8 Electrical characteristics of 4S PV configuration for shading pattern 1, 2 and 3
The maximum power tracked by proposed
algorithm for shading pattern 1 is 522.633 W with a tracking time of 3.6 sec, similarly maximum power tracked for shading pattern 2 and 3 are 401.064 W and 270.090 W with a tracking time of 4.8 sec and 5.9 sec respectively.
4.2. 2S2P PV configuration
The electrical characteristics of 2S2P PV
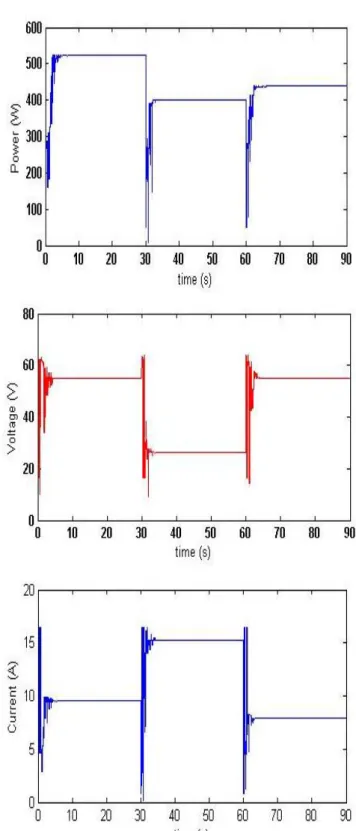
configuration subjected to shading patterns 4, 5 and 6 are shown in Fig. 10. From figure, it is noticed that characteristics exhibit two peaks with one global maximum and other is local maxima for shading patterns 4, 5 and 6. The 2S2P PV configuration is subjected to shading pattern 4 from 0-30 sec, pattern 5 from 30-60 sec and pattern 6 from 60 sec respectively to examine dynamic performance of proposed algorithm.
Fig. 9 Tracking curves of 4S PV configuration
The tracking curves of power, voltage and current using proposed algorithm for 2S2P PV configuration subjected to three dynamic shading patterns are shown in Fig. 11. From figure, it is noticed that proposed algorithm tracks global MPP for all shading patterns of 2S2P PV configuration.
Fig. 10 Electrical characteristics of 2S2P PV configuration for shading pattern 4, 5 and 6
The algorithm reinitializes search at t=30 sec and t=60 sec for a change in shading pattern. The maximum power tracking by proposed algorithm for shading pattern 4 is 523.078 W in tracking time of 4.5 sec and maximum power of 401.185 W and 437.95 W with a tracking time of 3.5 and 3.7 sec respectively for shading pattern 5 and 6.
4.3 Comparative Analysis
The proposed EGWO algorithm is compared with
conventional GWO MPPT algorithm (Satyajit et al.
2016) and most implemented Particle Swarm
Optimization MPPT algorithms (Liu et al. 2012) under
similar conditions. The parameters of three
algorithms are mentioned in Appendix.
The comparative results for EGWO, GWO and PSO MPPT algorithms in terms of accuracy and speed for tracking of global MPP for all shading patterns of 4S and 2S2P PV configuration are presented in Table 1. From table, it is observed that proposed algorithm is superior to conventional GWO and PSO algorithms.
The statistical performance analysis of EGWO, GWO and PSO MPPT algorithms by performing 50 trail runs are given in Table 2.
Fig. 11 Tracking curves of 2S2P PV configuration
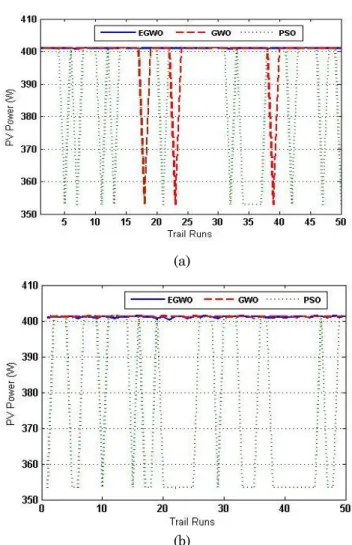
From Table 2, it is observed that proposed algorithm can track global MPP with more accuracy over PSO algorithm and in less tracking time than GWO MPPT algorithm. The tracking results for 50 trail runs performed by three algorithms for pattern 2 of 4S and pattern 5 of 2S2P configurations with highest standard deviation in table 2 are shown in Fig. 12.
P a g e | 210
Table 1
Comparative analysis of EGWO, GWO and PSO MPPT algorithms
Table 2
Statistical comparative analysis of EGWO, GWO and PSO MPPT algorithms
PV Configuration Shading Pattern Tracking algorithm Power (W) Voltage (V) Current (A) Duty ratio (doptimal) Tracking time (sec) Maximum Power from P-V curve Efficiency (%) 4S 1 EGWO 522.633 110.02 4.75 0.5195 3.6 522.6331 99.99 GWO 522.633 110.02 4.75 0.5183 8.2 99.99 PSO 522.633 110.02 4.75 0.5191 11.7 99.99 2 EGWO 401.064 52.28 7.67 0.7391 4.8 401.0647 99.99 GWO 401.064 52.49 7.64 0.7378 8.4 99.99 PSO 401.064 52.49 7.64 0.7378 12.3 99.99 3 EGWO 270.090 84.14 3.21 0.4882 5.9 270.1204 99.98 GWO 270.120 84.14 3.21 0.4883 9.2 99.99 PSO 270.120 84.14 3.21 0.4874 12.1 99.99 2S2P 4 EGWO 523.078 54.95 9.52 0.7583 4.5 523.1240 99.99 GWO 523.078 55.06 9.50 0.7592 8.2 99.99 PSO 522.93 54.70 9.56 0.7608 13.2 99.96 5 EGWO 401.185 26.12 15.36 0.8696 3.5 401.3190 99.96 GWO 401.199 26.36 15.22 0.8684 7.7 99.97 PSO 353.425 55.57 6.36 0.7043 10.9 88.06 6 EGWO 437.95 55.17 7.94 0.7363 3.7 438.0498 99.97 GWO 437.97 55.37 7.91 0.7354 7.9 99.97 PSO 437.97 55.37 7.91 0.7353 11.8 99.97 PV configuration Shading pattern Tracking method Mean best values (W) Standard deviation (W) Maximum power value (W) Minimum power value (W) Average tracking time(s) 4S 1 EGWO 522.633 522.582 522.629 0.0082 3.6 GWO 522.633 522.622 522.632 0.0021 8.2 PSO 522.633 401.064 517.768 24.0638 11.7 2 EGWO 401.064 400.064 401.044 0.0704 4.8 GWO 401.064 352.932 399.134 11.5464 8.4 PSO 401.064 352.932 390.473 21.8291 12.3 3 EGWO 270.120 270.034 270.115 0.0148 5.9 GWO 270.120 270.090 270.119 0.0042 9.2 PSO 270.120 261.316 268.887 3.0858 12.1 2S2P 4 EGWO 523.124 520.826 522.763 0.4442 4.5 GWO 523.124 522.358 523.033 0.1325 8.2 PSO 523.124 522.785 523.073 0.0666 13.2 5 EGWO 401.319 400.294 401.027 0.2344 3.5 GWO 401.319 400.896 401.182 0.1465 7.7 PSO 401.319 353.052 371.559 24.0344 10.9 6 EGWO 438.049 437.144 437.692 0.2295 3.7 GWO 438.049 437.658 437.658 0.1151 7.9 PSO 438.049 437.049 437.957 0.1230 11.8
(a)
(b)
Fig. 12 Maximum power tracked by three algorithms for (a) Shading pattern 2 of 4S Configuration, (b) Shading pattern 5 of 2S2P Configuration
From Figure 12, it is observed that PSO MPPT algorithm suffers from local MPP trapping frequently and GWO MPPT algorithm suffers occasionally, whereas EGWO MPPT algorithm does not suffer from local MPP trapping and tracks the global MPP for all the trail runs performed
5. Conclusion
An accurate analytical modeling of PV system under partial shaded condition is presented. An Enhanced GWO MPPT algorithm is proposed by
eliminating the δ and ω phase of conventional GWO
algorithm to track the global MPP of PV system under partial shaded condition with more accuracy and in less tracking time. To examine the performance of the proposed EGWO algorithm, simulations are carried out on 4S and 2S2P PV configurations subjected to three different shading patterns. The dynamic performance of the proposed algorithm is observed by subjecting the 4S and 2S2P PV configurations for dynamically changing shading patterns each for 30 sec. The performance of proposed algorithm is examined by comparing results with existing
conventional GWO and PSO MPPT algorithms and results are presented. It is noticed that proposed algorithm tracks global MPP with more accuracy and less tracking time. Due to stochastic nature of heuristic algorithms, 50 trail runs were performed for three algorithms under similar conditions and it is observed that proposed algorithm is free from local MPP trapping and has less standard deviation than PSO MPPT algorithm, less tracking time than GWO and PSO MPPT algorithms. From performance analysis, it is observed that proposed EGWO algorithm is superior to other two algorithms.
Appendix
Table A
Parameters of Kyocera KC-200GT module Maximum power (Pmp) 200 W
Open circuit voltage (Voc) 32.9 V
Short circuit current (Isc) 8.21 A
Maximum power Voltage (Vmp) 26.3 V
Maximum power current (Imp) 7.61 A
Voltage temperature coefficient (kv) -1.23 x 10⁻¹ V/ºC
Current temperature coefficient (ki) 3.18 x 10⁻³ A/ºC
Table B
Parameters of EGWO, GWO and PSO MPPT algorithms
Parameter PSO GWO EGWO
Initial population (duty ratio) Randomly between 0.1 and 0.9 Randomly between 0.1 and 0.9 Randomly between 0.1 and 0.9 Np 4 4 4 C1,max 2 - - C2,max 2 - - C1,min 1 - - C2,min 1 - - Wmax 1 - - Wmin 0.1 - - Maximum number of iterations, tmax 100 100 100 Termination
criteria tmax tmax tmax
References
Ahmed, J. and Salam, Z. (2014) A maximum power point tracking (MPPT) for PV system using Cuckoo search with Partial shading capability. Appl Energy, 119, 118-130. Ciulla.G., Brano, V.L., Dio, V.D. and Cipriani, G. (2014) A
comparison of different one-diode models for the representation of I–V characteristic of a PV cell. Renewable and sustainable energy reviews, 32, 684-696.
Gupta, A., Chauhan, Y.K and Rupendra, K.P. (2016) A comparative investigation of maximum power point tracking methods for solar PV system. Solar energy, 136, 236-253.
Ishaque, K., Salam, Z., Amjad, M. and Mekhilef, S. (2012) An improved particle swarm optimization (PSO)-based MPPT
P a g e | 212
for PV with reduced steady state oscillations. IEEE Trans Power Electron, 27(8), 3627-3637.
Ishaque, K., Salam, Z., Shamsudin, A. and Amjad, M. (2012) A direct control based maximum power point tracking method for photovoltaic system under partial shading conditions using particle swarm optimization algorithm. Applied Energy, 99, 414-422.
Jiang, L.L., Maskell, D.L. & Patra, J.C. (2013) A novel ant colony optimization based maximum power point tracking for photovoltaic systems under partially shaded condition.
Energy & Buildings, 58, 227-236.
JNNSM, India. (2016) http://www.mnre.gov.in.
Jordehi, A.R. (2016) Maximum power point tracking in photovoltaic (PV) systems: A review of different approaches.
Renewable and sustainable energy reviews, 65, 1127-1138. Kumar, C., & Rao, R. (2016). (2016). A Novel Global MPP
Tracking of Photovoltaic System based on Whale Optimization Algorithm. International Journal of Renewable Energy Development, 5(3), 225-232.
Liu, Y.H., Huang, S.C., Huang, J.W. and Liang, W.C. (2012) A particle swarm optimization based maximum power point tracking algorithm for PV systems operating under partially shaded conditions. IEEE Trans Energy Conv, 27(4), 1027-1035.
Mirjalili, S., Mirjalili, S, M. & Lewis, A. (2014) Grey wolf optimizer. Advances in Engg Software, 69, 46-61.
Ramli., M.A.M., Twaha,S., Ishaque, K. and Al-Turki, Y.A.. (2017) A review on maximum power point tracking for photovoltaic systems with and without shading conditions.
Renewable and sustainable energy reviews, 67, 144-159. Sangram, B. and Saini, R, P. (2016) A mathematical modeling
framework to evaluate the performance of single diode and
double diode based SPV systems. Energy reports, 2, 171-187.
Saravanan, S. and Ramesh, B., N. (2016) Maximum power point tracking algorithms for photovoltaic system – A review.
Renewable and sustainable energy reviews, 57, 192-204. Satyajit, M., Bidyadhar, S. and Pravat, K.R. (2016) A new
MPPT design using grey wolf optimizer technique for photovoltaic system under partial shading conditions. IEEE Trans on sustainable energy, 7(1), 181-188.
Silvestre, S., Boronat, A. and Chouder, A. (2009) Study of bypass diodes configuration on PV modules. Applied Energy, 86, 1632-1640.
Sundareswaran, K., Sankar, P. and Sankaran, P. (2014) MPPT of PV systems under partial shaded Conditions through a colony of flashing fireflies. IEEE Trans Ener Conv, 29(2), 463-472.
Sundareswaran, K., Sankar, P., Nayak, P.S.R., Simon, S.P. & Palani, S. (2015) Enhanced energy output from a PV system under partial shaded conditions through Artificial bee colony. IEEE Trans Sustainable Ener, 6(1), 198-209. Verma, D., Nema.S., Shandilya, A., M., and Dash, S.K. (2016)
Maximum power point tracking (MPPT) techniques:Recapitulation in solar photovoltaic systems.
Renewable and sustainable energy reviews, 54, 1018-1034. Zainal, S., Jubaer, A. and Beny, S.M. (2013) The application of
soft computing methods for MPPT of PV system: A technological and status review. Applied Energy, 107, 135-148.

![2-deoxy-2-[18]fluoro-D-glucose PET/CT (18FDG PET/CT) may not be a viable biomarker in Pompe disease](data:image/gif;base64,R0lGODlhAQABAIAAAP///wAAACH5BAEAAAAALAAAAAABAAEAAAICRAEAOw==)