Faculty Publications from the Center for Plant
Science Innovation
Plant Science Innovation, Center for
2013
Comparative studies of differential gene calling using RNA-Seq
Comparative studies of differential gene calling using RNA-Seq
data
data
Ximeng Zheng
University of Nebraska-Lincoln
Etsuko N. Moriyama
University of Nebraska-Lincoln, [email protected]
Follow this and additional works at: https://digitalcommons.unl.edu/plantscifacpub
Part of the Plant Biology Commons, Plant Breeding and Genetics Commons, and the Plant Pathology Commons
Zheng, Ximeng and Moriyama, Etsuko N., "Comparative studies of differential gene calling using RNA-Seq data" (2013). Faculty Publications from the Center for Plant Science Innovation. 83.
https://digitalcommons.unl.edu/plantscifacpub/83
This Article is brought to you for free and open access by the Plant Science Innovation, Center for at
DigitalCommons@University of Nebraska - Lincoln. It has been accepted for inclusion in Faculty Publications from the Center for Plant Science Innovation by an authorized administrator of DigitalCommons@University of Nebraska - Lincoln.
R E S E A R C H
Open Access
Comparative studies of differential gene calling
using RNA-Seq data
Ximeng Zheng
1, Etsuko N Moriyama
1,2*From
The 9th Annual Biotechnology and Bioinformatics Symposium (BIOT 2012)
Provo, UT, USA. 25-26 October 2012
Abstract
Background:With its massive amount of data, gene-expression profiling by RNA-Seq has many advantanges compared with microarray experiments. RNA-Seq analysis, however, is fundamentally different from microarray data analysis. Techniques developed for analyzing microarray data thus cannot be directly applicable for the digital gene expression data. Several statistical methods have been developed for identifying differentially expressed genes specifically from RNA-Seq data over the past few years.
Results:In this study, we examined the performance of differential gene-calling methods using RNA-Seq data in practical situations. We focused on two representative methods: one parametric method, DESeq, and one nonparametric method, NOISeq. We examined their performance using both simulated and real datasets. Our simulation followed the RNA-Seq process and produced more realistic short read data. Both DESeq and NOISeq identified over-expressed genes more correctly than under-expressed genes. While DESeq was more likely to call longer genes as differentially expressed than shorter ones, NOISeq did not have such bias. When the underlying variation increased, both methods showed higher rates of false positives. When replicates were not available in the experiments, both methods showed lower rates of true positives and higher rates of false positives.
Conclusions:The level of variation clearly affected the performance of both methods, showing the importance of understanding the variation in the data as well as having replications in RNA-Seq experiments. We showed that it is possible to obtain improved differential gene-calling results by combining the results obtained by the two methods. We suggested strategies to use these two methods individually or combined according to the characteristics of the data.
Background
RNA-Seq is a recently developed technology based on next-generation sequencing. It is used to analyze gene expression profile by counting the number of short reads directly generated from each mRNA. Compared with microarray technology, RNA-Seq has many advantages,e. g., high resolution, low background noise, no prior knowledge of reference sequence required (withde novo
transcriptome assembly), and capability of distinguishing isoforms and allelic expression [1]. RNS-Seq analysis is, therefore, now overtaking microarray analysis. However,
the count data used in RNA-Seq are discrete and funda-mentally different from continuous microarray data [2]. Techniques developed for analyzing microarray data are therefore not directly applicable on these digital gene expression data.
Many challenges exist in normalizing and analyzing RNA-Seq data. Even after length normalization,e.g., using RPKM (reads per kilobase of exon model per mil-lion mapped reads) [3], the length bias may still persist in differential gene-calling [4]. Non-uniform read coverage depending on experimental protocols and local sequence context has been reported [5-7]. The fact that a small number of highly expressed genes can generate a big por-tion of the total reads complicates normalizapor-tion [8]. Moreover, expression levels affect the effectiveness of * Correspondence: [email protected]
1
School of Biological Sciences, University of Nebraska-Lincoln, Nebraska, 68588-0118, USA
Full list of author information is available at the end of the article Zheng and MoriyamaBMC Bioinformatics2013,14_(Suppl 13):S7 http://www.biomedcentral.com/1471-2105/14/S13/S7
detecting differentially expressed genes; highly expressed transcripts are more likely to be called as differentially expressed andvice versa[9].
For continuous data obtained by microarray, a normal distribution is usually used to model biological and tech-nical variations after log transformation [10]. For dis-crete count data obtained by RNA-Seq, Poisson distribution has been applied to fit the count variation across technical replicates [8]. However, RNA-Seq data show larger variation than Poisson distribution [11]. Many methods developed for RNA-Seq analysis, such as DESeq [11], edgeR [12], Cufflinks/Cuffdiff [13,14], bay-Seq [2], and TSPM [15], therefore, apply negative bino-mial distributions (as well as Poisson in the case of TSPM) to account for biological variation. NOISeq [16] is a non-parametric method. Recently released BitSeq [17] uses Bayesian approach to estimate transcript expression levels incorporating uncertainty in read map-ping while the biological variation is modeled using an expression-level-dependent prior.
Importance of including both technical and biological replicates in designing RNA-Seq experiments is clearly demonstrated in Auer and Doerge [18]. McIntyreet al. [19] further demonstrated that technical variation, although smaller than the biological variation, cannot be ignored. In practice, however, many RNA-Seq experi-ments are done without or with only a few replicates. In order to accommodate such situations, for example, DESeq estimates gene-expression variance between replicates by pooling genes with similar expression to enhance the variance estimation [11]. When no repli-cates are available, DESeq treats gene expressions between two experimental conditions as replicates. Without replicates, determination of differentially expressed genes becomes very conservative. In the case of NOISeq, a non-parametric method, when no repli-cates are available, it simulates technical replirepli-cates (but no biological replicates) based on multinomial distribution [16].
Kvamet al. [20] compared DESeq, edgeR, baySeq, and TSPM methods on simulated data under various scenar-ios,e.g., using 2 or 4 replicates, and using Poisson or nega-tive binomial models to generate data. Their report is consistent with previous other studies; baySeq performed slightly better than DESeq and edgeR in general, and TSPM did not perform well when only a few replicates were available (see also [15]). In the study by Tarazonaet al. [16], NOISeq was compared with DESeq, edgeR, bay-Seq, and Fisher’s Exact Test. For both simulated count data and real datasets, NOISeq performed comparable to or better than other methods. While NOISeq found slightly fewer truly differentially expressed genes compared to other methods, the sensitivity of discovering differen-tially expressed genes by NOISeq was less dependent on
the sequencing depth. The sensitivity of other methods increased with increasing sequencing depth resulting dis-covering more true positives. However, this was at the cost of having significantly more false positives compared to NOISeq.
Simulated read-count data have been often used for testing performance of differential gene expression ana-lysis methods [2,15,17,20]. In these previous studies, except for the study by Glaus et al. [17], count data were directly simulated from a defined distribution (e.g., Poisson or negative binomial models) given the expected expression level of each gene in each condition. How-ever, in the real RNA-Seq analysis, some reads can be mapped to multiple locations on the genome or tran-scripts. Such non-uniquely mapped reads are usually discarded and are not counted. This practice could affect the relationship between expected gene expression levels and the actual read counts obtained causing the count data not following the defined distribution. In order to examine the effect of having non-uniquely mapped reads (and how they are handled), simulation experiments should incorporate the entire RNA-Seq process step by step, instead of only simulating the count data.
In this study, we focused on comparing the perfor-mance of two methods: DESeq, a parametric, negative-bionomical model based method, and NOISeq, a non-parametric method. We examined their performance using both simulated and real datasets. We simulated the process of short-read generation and read-mapping in order to examine how the mapping method affects the results. While both methods showed that their ability to identify differentially expressed genes depended on gene-expression level, length-based bias was not shown with NOISeq. The level of variation among replicates clearly affected the performance of both methods. We further examined how having no replicates affected the differen-tial gene-calling results. Based on the results we obtained with both methods under different conditions, we presented a possible strategy to improve identification accuracy for differentially expressed genes by using these two methods.
Methods
Overall process of the RNA-Seq simulation
In order to examine how discarding non-uniquely mapped reads affects the results of RNA-Seq analysis, we simulated the entire RNA-Seq process step by step:
1. We used the entire set of the protein-coding transcripts from the mouse genome as our reference transcriptome. It included 26,017 transcripts excluding alternative-splicing forms. These sequences were used for generating short reads.
2. Each gene was randomly assigned an expression level from a Gamma distribution (described in the next section).
3. Short reads with their length of 36bp were gener-ated from each gene starting at random positions. No sequencing errors were introduced in this process. The number of short reads generated for each gene was set to be proportional to the expression level and the length of the gene (described in the next section). 4. Short reads generated were mapped back to the mouse reference sequences by using SOAP2 [21] allowing up to two mismatches. Following the com-mon practice, only short reads that can be uniquely mapped back to the reference sequences were consid-ered ("-r 0”option), and those mapped more than one location were discarded.
5. These steps were repeated for each replicate of each experimental condition.
The number of short reads mapped to each gene was used as the count input for differential gene expression analysis.
Modeling gene expression levels
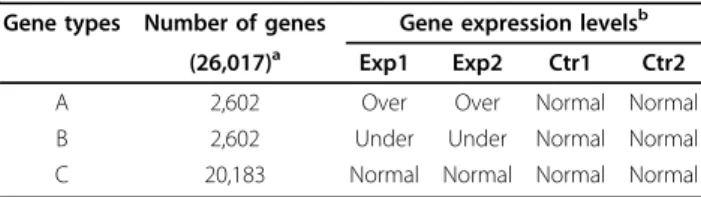
The expression level of each gene at the control condition was assigned randomly from a Gamma distribution with the shape parameter 0.15 and the scale parameter 1160. These parameters were chosen to reproduce a distribution similar to those found in many available RNA-Seq datasets. Table 1 summarizes our simulation model. 10% each of the genes (types A and B) were assigned to be“over"- and
“under"-expressed in the experimental condition. For these differentially expressed genes, the fold-changes were chosen randomly from 1.1 - 5.0. The remaining 80% of the genes (type C) were considered to have no difference in expected expression between the control and experimental conditions. Since RNA-Seq experiments often include only a few replicates, we included only two replicates in each of the experimental ("Exp1”and“Exp2”) and control ("Ctr1” and“Ctr2”) conditions. For a testing purpose, another dataset was simulated without replicates (one replicate each in experimental and control conditions).
Modeling technical and biological variations
The biological variation between replicates within each condition group was modeled by a Gamma distribution:
λi∼Gamma(ki,θi) (1)
wherekiandθiare the shape and scale parameters for genei. Two datasets were generated with different levels of variation: the moderate-variation dataset with 0.33 of the coefficient of variation (CV) and thelarge-variation dataset with 0.67 of CV. The technical variation was modeled by a Poisson distribution. Thus the expression level of gene i after considering both biological and technical variations can be expressed as:
Ei∼Pois(λii) (2)
The number of short reads generated from each gene was assumed to be proportional to the expression level and the length of the gene:
Ni=c×Ei×Li (3)
where Niis the number of short reads generated for genei,Li is the length of genei, and cis a constant to make desired amount of total reads in the experiment. For this study, we set the total number of short reads to be approximately 23 million for each replicate.
Differential gene-calling methods compared
One of our foci in this study was to examine how different methods perform when there was no replicate as it is the case still in many RNA-Seq experiments. DESeq, edgeR, and baySeq are all based on negative binomial models, and DESeq has a straight-forward option to handle experimen-tal data when replicates are not available. We thus chose DESeq (version 1.2.1) [22] as a representative of para-metric methods and a relatively newly introduced non-parametric statistics method NOISeq (R script down-loaded on Feb 21, 2012 from [23]).
When testing the performance of each method without replicates, for DESeq, the option“method”for variance estimation was set to“blind”. For NOISeq, we used the recommended parameter values n = 5 and pnr = 0.2, but for the parameter v, we used 0.2 based on our prelimin-ary results. We used the default parameter values for DESeq and NOISeq when replicates were available. DESeq takes raw count data as input. We used RPKM as the normalization method for NOISeq input data.
Test statistics
In our simulations, as shown in Table 1, types-A and -B genes were set to be differentially expressed ("actual posi-tives”), and type-C genes were set to be non-differentially expressed ("actual negatives”). We compared the list of these genes with those determined to be differentially
Table 1 Simulation strategy
Gene types Number of genes Gene expression levelsb
(26,017)a Exp1 Exp2 Ctr1 Ctr2
A 2,602 Over Over Normal Normal B 2,602 Under Under Normal Normal C 20,183 Normal Normal Normal Normal
a
Total number of genes is shown in parentheses.
b
“Over": over-expressed,“Under": under-expressed, and“Normal": no-differential expression.
Zheng and MoriyamaBMC Bioinformatics2013,14_(Suppl 13):S7 http://www.biomedcentral.com/1471-2105/14/S13/S7
expressed by DESeq and NOISeq at various thresholds. Results were classified as follows:
• True Positive (TP): genes set to be differentially expressed and called as differentially expressed by the method,
• True Negative (TN): genes set to be non-differen-tially expressed and not called as differennon-differen-tially expressed by the method,
• False Positive (FP): genes set to be non-differen-tially expressed but called as differennon-differen-tially expressed by the method, and
• False Negative (FN): genes set to be differentially expressed but not called as differentially expressed by the method.
The performance of the methods was evaluated as fol-lows:
Sensitivity= TP
TP+FN (4)
False Discovery Rate(FDR)= FP
TP+FP (5)
Precision= 1−FDR= TP
TP+FP (6)
Recall=Sensitivity= TP
TP+FN (7)
Equation (5) is used to calculate the empirical false dis-covery rate from the observed data. For simplicity, we call it as“False Discovery Rate”or FDR.
Real RNA-Seq datasets used
Sultan et al.’s dataset
Sultanet al. [24] performed differential gene expression analysis between human embryonic kidney- and Ramos B-cell lines using both RNA-Seq and microarray experiments. We extracted the short-read count data for 13,118 human genes from their RNA-Seq study considering only the hits on the exons (total read numbers ranging from around 5 to 7 millions). Although their experiments included two biological replicates, these data were combined in their study due to high correlation between replicates within each cell line. Thus we treated their experiment as having no replicates. We analyzed this RNA-Seq data using both DESeq and NOISeq. The accuracy of these methods was tested against the results based on their microarray analysis (usingq-value = 0.05 as the cutoff) for the same set of genes. We considered the microarray results as bases of comparison, defining the“actual”positives and negatives.
Then the precision and recall were calculated following the equations (6) and (7).
Chlamydomonas and pea aphid datasets
Two unpublished RNA-Seq datasets were also included: a green algaChlamydomonas reinhardtiidataset (Cerutti
et al. in preparation) and a pea aphidAcyrthosiphon pisum
dataset (Brissonet al. unpublished). TheClamydomonas
dataset compared the expression of 16,865C. reinhardtii
genes between the control and the nitrogen-starvation experiment (144-hour time point). Each condition included two replicates (total read numbers ranging from around 20 to 30 millions). This dataset had a moderate level of variation (CV = 0.33). The pea aphid (A. pisum) dataset compared 35,884 genes between the control and solitary conditions (8-hour time point). For this data-set, three replicates were included for each condition (total read numbers ranging around 2 to 3 millions). The level of variation was twice larger than that of theClamydomonas
dataset (CV = 0.67).
We used these datasets to test“consistency”in the results obtained by DESeq and NOISeq between when replicates were available and when no replicates were available. Differentially expressed genes were first identi-fied using all replicates. These results were used as the
“standards” for the comparative purpose. We next ana-lyzed the RNA-Seq data assuming no replicate. Then the precision and recall were calculated following the equa-tions (6) and (7). Since there are multiple replicates for both control and experimental conditions, we took the average statistics from all pairwise comparisons and reported the“average precision”and the“average recall”.
Note that these“average precision”and“average recall” were used to measure the consistency in the results obtained with and without having replicates. Since for these actual RNA-Seq data, we do not know the“true positives”and“true negatives”, these statistics are used by no means to indicate the accuracy of the methods.
Results and discussion Effect of uncertain read-mapping
Our simulation process reproduced read-mapping uncer-tainty. Approximately 90% of short reads were uniquely mapped back to the mouse reference sequences, while 10% of reads were mapped to multiple locations on the reference and discarded from the analysis. Comparisons of the results based on the two simulation processes, simulating the entire RNA-Seq process and simulating count data directly, showed, for both DESeq and NOISeq, equal or slightly bet-ter performance when count data were simulated directly as many previous studies have done (data not shown). Uncertainty in read-mapping, therefore, could affect differ-ential gene-calling performance. With increased numbers of non-uniquely mapped reads, this effect would be larger.
Effects of gene expression-level and gene length on differential gene calling
We first examined if differential gene-calling performance depends on gene-expression levels. We used the simulated dataset with themoderatevariation (CV = 0.33) for this analysis. Using ranges of thresholds, sensitivities were cal-culated separately for two groups of genes: over-expressed (type A in Table 1) and under-expressed (type B in Table 1) genes. For DESeq,q-value (FDR adjustedp-value) was used for the threshold. For NOISeq, the probability of a gene being differentially expressed provided by the method was used for the threshold. We call this probabilityPNOI. When both being used as a threshold,q-value is roughly comparable to the probability of equivalent expression (1-PNOI) (see [25] for discussion). As shown in Table 2, we observed expression-level dependent results with both DESeq and NOISeq. Both methods showed slightly but consistenly higher sensitivities for the over-expressed genes than for the under-expressed genes. Over-expressed genes were slightly more likely to be called correctly as differentially expressed than under-expressed genes. This is consistent with the results reported by Wuet al. [9].
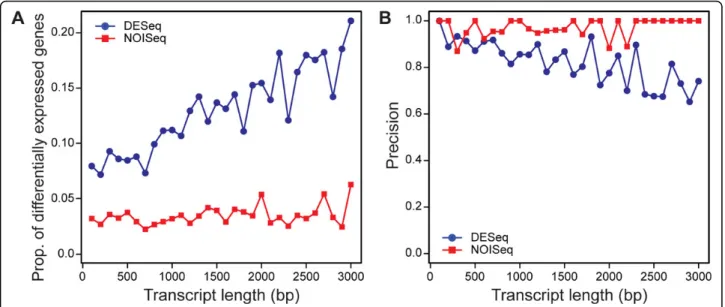
Oshlack and Wakefield pointed out that gene-length dependency is shown with differential calling based on RNA-Seq [4]. We examined if such length-dependency exists in the results obtained by DESeq and NOISeq using again our simulated dataset with themoderatevariation. As shown in Figure 1A, DESeq had length-dependency where longer transcripts were more likely to be called as differentially expressed, whereas NOISeq did not exhibit such dependency. In order to examine the proportion of true positives among the genes called as differentially expressed, in Figure 1B, precisions are plotted. Precision decreased with gene length for DESeq whereas NOISeq showed consistently very high precision (very close to 1.0). It indicates that for longer genes, DESeq calls more genes as differentially expressed, but their results include more false positives. In contrast, NOISeq calls a smaller number of genes as positives, but with very high accuracy, regard-less of the lengths.
Gene-calling performance and biological variation Biological variation can be quite large in RNA-Seq data. In order to study if and how the variation in the data affects the performance of differential gene calling, we analyzed two simulated datasets that modeled two levels of biological variation:moderate (CV = 0.33) andlarge
(CV = 0.67). The sensitivities and false discovery rates were calculated using the equations (4) and (5).
False discovery rate (FDR) control
DESeq calculatesq-values (FDR adjustedp-values) for each gene. If the method controls the FDR well, theq-value threshold used to identify differentially expressed genes should equal to or greater than the observed FDRs. As shown in Figure 2A, DESeq controlled FDRs more reliably when the biological variation wasmoderatecompared to when it waslarge. With thelargevariation, observed FDRs were significantly larger than reportedq-values especially for those smaller than 0.2. This result is consistent with the one reported by Kvamet al. [20]. FDR was not controlled in their“Simulation 4”where variation was large.
NOISeq uses the probability (PNOI) to identify differen-tially expressed genes. As mentioned before, we can con-sider 1-PNOIto be equivalent toq-value [25]. As shown in Figure 2B, although observed FDRs were consistently lar-ger when the biological variation was large, NOISeq roughly controlled the FDR regardless of the level of varia-tion. In fact, when the variation is moderate, observed FDRs were much lower than 1-PNOIvalues.
Effect of biological variation on differential gene-calling
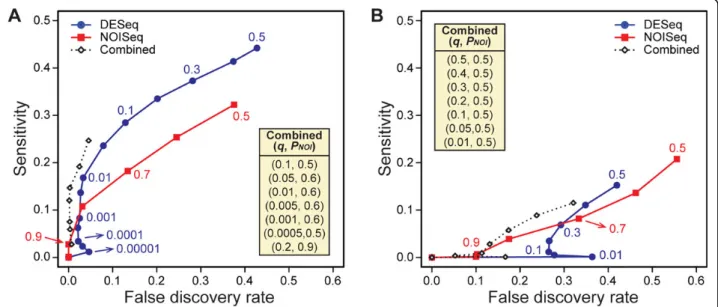
Next we compared the effect of biological variation on the performance of differential gene-calling by DESeq and NOISeq. As shown in Figure 3A, with themoderate varia-tion, the sensitivity of DESeq was significantly better than NOISeq when the q-value threshold was greater than 0.005. NOISeq performed better than DESeq when the
PNOIthreshold was greater than 0.8. With thelarger varia-tion, as shown in Figure 3B, the sensitivity of NOISeq was significantly better than DESeq with largePNOIthresholds (PNOI> ~0.7). DESeq performed better only when the
q-value threshold greater than 0.3 was used. As mentioned above, especially for DESeq observed FDRs are much larger than theq-value thresholds when the biological variation was large.
Effect of replications on differential gene-calling
We next examined the performance of DESeq and NOISeq on the simulated datasets where no replicates were used. Compared to the results shown in Figure 3, when no replicates were available, as shown in Figure 4, the overall accuracy for both methods decreased dramati-cally as expected and the FDRs were very large at all thresholds. DESeq found hardly any truly differentially expressed genes when no replicates were available. For example, while, at theq-value threshold of 0.05, DESeq
Table 2 Sensitivity of DESeq and NOISeq gene-calling and gene-expression levels
Threshold valuesa Gene group 0.005 0.01 0.05 0.1 0.2 0.3 0.4 0.5 [DESeq] Over-expressed 0.21 0.26 0.36 0.44 0.51 0.57 0.63 0.66 Under-expressed 0.19 0.23 0.32 0.39 0.46 0.52 0.57 0.62 [NOISeq] Over-expressed 0.00 0.00 0.00 0.05 0.17 0.28 0.38 0.47 Under-expressed 0.00 0.00 0.00 0.03 0.14 0.25 0.35 0.46 a
q-value for DESeq and 1-PNOIfor NOISeq.
Zheng and MoriyamaBMC Bioinformatics2013,14_(Suppl 13):S7 http://www.biomedcentral.com/1471-2105/14/S13/S7
had sensitivity about 0.25 in Figure 3A, it was 0 in Figure 4A. NOISeq still found truly differentially expressed genes, however, at a cost of having many false positives. For example, NOISeq had sensitivity≈0.1 and FDR≈0.03 at
PNOI= 0.8 in Figure 3A, while sensitivity≈0.22 and FDR
≈0.4 in Figure 4A at the same threshold. DESeq was con-servative in calling differentially expressed genes when no
replicates were available, whereas NOISeq was much more aggressive. Similar to when replicates were available, when the variation was large, both methods performed worse as shown in Figure 4B. These results confirmed the impor-tance of having replicates in RNA-Seq experiments. If no replicates are available, however, NOISeq may serve better as a starting point of analysis.
Figure 1Gene lengths and differential gene-calling performance. Differential gene-calling performance of DESeq (blue circles) and NOISeq (red squares) is plotted againt transcript length (bp). The transcripts are binned according to their lengths with 100bp increment. For each bin, the proportion of transcripts called differentially expressed by each method (A) and the precision of calling differentially expressed genes by each method (B) are plotted. The thresholds used areq=0.2 for DESeq andPNOI=0.8 for NOISeq. The same patterns were observed when
different threshold values were used (data not shown).
Figure 2False discovery rate control and the level of biological variation. Observed false discovery rates (FDRs) are plotted against theq -value thresholds used for DESeq (A) and 1-PNOIthresholds used for NOISeq (B) for the simulated datasets withmoderate(blue circles) andlarge
Combining the results of DESeq and NOISeq to improve differential gene-calling
We examined if we could improve the accuracy in identi-fying differentially expressed genes by combining DESeq and NOISeq. We tested ranges of combinations of
thresholds (q-value for DESeq andPNOIfor NOISeq). At each threshold combination, positives (differentially expressed genes) were identified when called by both methods (i.e., taking the intersection of results). In order to find the best performing combination, in addition to
Figure 3Gene-calling performance and the level of biological variation. Sensitivities are plotted against the false discovery rates calculated from the results obtained by DESeq (blue circles), NOISeq (red squares), and“Combined”method (open diamonds) for the simulated datasets withmoderate(A) andlarge(B) biological variations. The threshold values used (qfor DESeq andPNOIfor NOISeq) are shown for some data
points. For the“Combined”method, data points that showed the highest sensitivy/FDR for each givenq-value are plotted, and their threshold combinations, (q,PNOI), are provided in each panel in the order of higher to lower sensitivities. See Additional file 1 for the entire results of the
“Combined”method.
Figure 4Gene-calling performance and the level of biological variation when no replicates are available. Sensitivities are plotted against the false discovery rates calculated from the results obtained by DESeq (blue circles) and NOISeq (red squares) for the simulated datasets with moderate(A) andlarge(B) biological variations and no replicates. The threshold values used (qfor DESeq andPNOIfor NOISeq) are shown for
some data points.
Zheng and MoriyamaBMC Bioinformatics2013,14_(Suppl 13):S7 http://www.biomedcentral.com/1471-2105/14/S13/S7
sensitivities and FDRs, we calculated their ratios (sensi-tivity/FDR). As described before, NOISeq tends to have lower sensitivities as well as FDRs compared to DESeq at equivalent thresholds (Figures 1 and 3). Therefore, by combining both results, we expected to achieve lower FDRs (fewer false positives). With lower sensitivities given by NOISeq, on the other hand, in order to keep the level of sensitivities given by DESeq, we need to use relaxed thresholds with NOISeq. Our grid-search results showed such patterns (see Additional file 1). For the
moderate-variation data, the combination (q,PNOI) = (0.005, 0.6) generated the highest sensitivity/FDR (60), which was significantly higher than the highest such ratio obtained by using a single method (5.67 by DESeq). Using even more relaxed thresholds for both DESeq and NOISeq,e.g., (q,PNOI) = (0.05, 0.5) or (0.1, 0.5), we can obtain sensitivities similar to the levels obtained by DESeq and maintain FDRs significantly lower. When var-iation is large, the combination (q,PNOI) = (0.4, 0.5) gen-erated the best performance in terms of the sensitivity to FDR ratio (0.37). Although using NOISeq withPNOI= 0.5 generated a slightly higher ratio (0.38), FDR was too high (0.56) for any practical use. The combination method provided a much lower FDR compared to the single use of either DESeq or NOISeq. However, we should note that sensitivities are all very low even with such relaxed thresholds when variation is very large. In Figure 3, results of some combination strategies are compared against the results obtained by single methods. It shows that in most cases the observed FDRs obtained by the combination method were lower than the threshold values used. It also shows that the combination strategy can improve the performance (higher sensitivity and lower FDR) in identifying differentially expressed genes compared to using either DESeq or NOISeq alone for bothmoderate- andlarge-variation data. When no repli-cation data are available, the combination strategy did not improve the accuracy of calling differentially expressed genes (data not shown).
Performance analysis on the real RNA-Seq data
Comparing the results between RNA-Seq and microarray analyses
We tested the performance of DESeq and NOISeq on the real RNA-Seq datasets published by Sultanet al. [24]. Using the corresponding microarray result as the refer-ence, precision and recall were calculated as described before. As shown in Table 3, both methods had close to or higher than 90% of precision for a wide range of thresh-olds. However, their recall (sensitivity) values were very low (lower than 0.05 for DESeq and lower than 0.12 for NOISeq). The performance of DESeq and NOISeq are comparable at stringent thresholds (0.005 or lower). NOISeq showed slightly higher precision with more
relaxed thresholds. It should be noted that although the RNA-Seq data by Sultanet al. [24] did not contain a repli-cate, their data had a low level of variation (Pearson’s cor-relation coefficients are 0.98-0.99) between original replicates.
Consistency analysis between with and without biological replications
Using the two sets of real RNA-Seq data, we tested the
“consistency”in the results given by DESeq and NOISeq. We compared the results from DESeq and NOISeq using no replicate with those using replicates on the same data-sets. Two datasets are: theChlamydomonasdataset that have moderate variation and the pea aphid dataset that have large variation. The objective here is to see if DESeq and NOISeq can yield somewhat consistent/reliable results when no replicates are available.
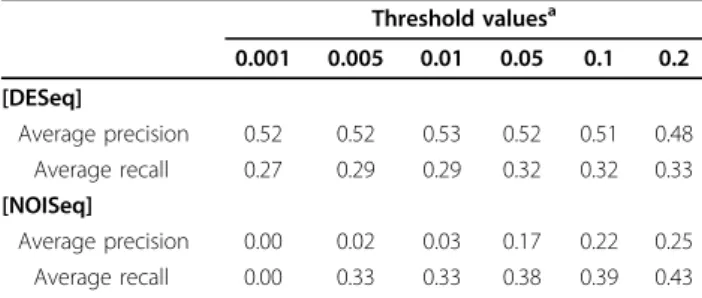
As shown in Table 4, DESeq was found to be very con-servative in finding differentially expressed genes when no replicates were available. This was indicated by very high precision (fewer false positives) and very low recall (more false negatives). In other words, with no replicates, while DESeq found only a small number of genes as differentially expressed, many of these identified genes were what it would have found if there were replicates. NOISeq was found to be more aggressive in finding differentially expressed genes when no replicates were available, indi-cated by relatively low precision (more false positives) and high recall (fewer false negatives). Without replicates, while NOISeq could find almost all genes that would have been found if there were replicates, many of genes identi-fied would not have been found if replicates were available (possible false positives). When the data included much larger variation as in the case of the pea aphid datasets (Table 5), as expected, results obtained from single cates were not consistent with those obtained when repli-cates were available. Interestingly, precisions of NOISeq do not seem to be affected by the level of variations. Regard-less of the amount of variation, with NOISeq we expect to find the same proportion of false positives (inconsistently identified genes). However, the recall values were severely affected with the larger variation, dropping to the level
Table 3 Performance of DESeq and NOISeq compared against the microarray study.
Threshold valuesa 0.001 0.005 0.01 0.05 0.1 0.2 [DESeq] Precision 0.94 0.93 0.90 0.90 0.89 0.88 Recall 0.01 0.02 0.02 0.04 0.04 0.05 [NOISeq] Precision 0.94 0.93 0.94 0.94 0.92 0.86 Recall 0.002 0.01 0.01 0.03 0.05 0.12 aq
almost the same as found with DESeq, indicating the increased proportion of false negatives (many differentially expressed genes were not identified without replicates).
These results were consistent with our results using simulated data described earlier. When no replicate is available for both moderate- and large-variation datasets, DESeq is very conservative in finding differentially expressed genes, whereas NOISeq is more aggressive but more error prone.
Suggested strategies of using DESeq and NOISeq
This study clearly showed that biological variation affects significantly and differently how the two methods we studied, DESeq and NOISeq, perform in differential gene-calling. Therefore, it is highly recommended to have replications in RNA-Seq experiments and deter-mine the variation in the data. Large variation will cause more false positives for both DESeq and NOISeq. We also showed that it is possible to improve the accuracy by combining the results of both methods. Based on the results we obtained in this study, the following are our suggested strategies of using DESeq and NOISeq depending on the level of biological variation:
1. If the biological variation is moderate,e.g., CV≈0.33, to control the FDR at around 0.05 or lower, we can take advantage of combining results by taking the inter-section of both methods usingq=0.1 threshold for DESeq andPNOI=0.5 threshold for NOISeq.
2. If the biological variation is large,e.g., CV≈0.67, we may need to consider a higher FDR control,e.g., ~0.2, in order to find a good number of differentially expressed gene candidates. We can use the combined results using the thresholdsq=0.3 or 0.4 for DESeq andPNOI=0.5 for NOISeq. Note that only a very small number of differentially expressed genes can be found in order to control the FDR smaller than 0.2. With such high FDRs, the results obtained should be consid-ered as preliminary and further analysis is required.
It is advisable to have replications in RNA-Seq experi-ments. Based on our analysis on simulated as well as real datasets, when there is no replicate, DESeq is very conser-vative and finds a very small number of differentially expressed genes. However, its results are more consistent with the results obtained using replicates. On the contrary, NOISeq is more aggressive and finds more candidates of differentially expressed genes, which, however, include a large number of false positives. When the results of DESeq and NOISeq are compared to the results based on a microarray analysis, in general NOISeq showed better per-formance. Our recommended strategy for analyzing no-replicate datasets, therefore, is to use NOISeq withPNOI thresholds 0.8-0.95 as a starting point of further analysis.
Conclusions
In this study, we presented a comparison between a para-metric method, DESeq, and a nonparapara-metric method, NOISeq, for differential gene-calling using RNA-Seq data. The level of variation clearly affected the performance of both methods. It is important to have replications in RNA-Seq experiments and understand the level of varia-tion in the data. Both DESeq and NOISeq performed much better on data with moderate biological variation than with large biological variation. They both found slightly more truly over-expressed genes than under-expressed genes. DESeq showed length-dependent results where longer transcripts were called more as differentially expressed, whereas NOISeq did not show this trend. We showed that it is possible to obtain improved differential gene-calling results by combining the results obtained by the two methods. We suggested strategies to use these two methods individually or combined according to the characteristics of the data. It would be useful to explore combination strategies further including more methods.
Additional material
Additional file 1: Analysis of combination strategy with the
moderate- andlarge-variation data. Performance of combination strategies for differential gene-calling was examined based on the sensitivity, FDR, and sensitivity to FDR ratio. Tables S1 and S2 show the resuls for simulated datasets withmoderateandlargevaritions, respecitvely.
Table 4 Performance consistency with DESeq and NOISeq on theChlamydomonasdata
Threshold valuesa 0.001 0.005 0.01 0.05 0.1 0.2 [DESeq] Average precision 1.00 0.99 0.99 0.99 0.99 0.99 Average recall 0.03 0.04 0.05 0.07 0.07 0.08 [NOISeq] Average precision 0.02 0.08 0.12 0.15 0.17 0.24 Average recall 1.00 1.00 1.00 0.96 0.95 0.94 aq
-value for DESeq and 1-PNOIfor NOISeq.
Table 5 Performance consistency with DESeq and NOISeq on the pea aphid data
Threshold valuesa 0.001 0.005 0.01 0.05 0.1 0.2 [DESeq] Average precision 0.52 0.52 0.53 0.52 0.51 0.48 Average recall 0.27 0.29 0.29 0.32 0.32 0.33 [NOISeq] Average precision 0.00 0.02 0.03 0.17 0.22 0.25 Average recall 0.00 0.33 0.33 0.38 0.39 0.43 aq
-value for DESeq and 1-PNOIfor NOISeq.
Zheng and MoriyamaBMC Bioinformatics2013,14_(Suppl 13):S7 http://www.biomedcentral.com/1471-2105/14/S13/S7
Competing interests
The authors declare that they have no competing interests.
Authors’contributions
XZ and ENM proposed the project. XZ performed the analysis. XZ and ENM wrote, read and approved the final manuscript.
Acknowledgements
We thank Drs. Brisson and Cerutti (School of Biological Sciences, University of Nebraska-Lincoln) for letting us analyze their unpublished RNA-Seq data, and Dr. Wang (Department of Statistics, University of Nebraska-Lincoln) for his helpful discussion. The project described was made possible by a grant from Nebraska Tobacco Settlement Biomedical Research Enhancement Funds to E.N.M.
Declarations
The authors declare that funding for publication of the article was sponsored partly by a grant from Nebraska Tobacco Settlement Biomedical Research Enhancement funds and partly by departmental funds. This article has been published as part of BMC Bioinformatics Volume 14 Supplement 13, 2013: Selected articles from the 9th Annual Biotechnology and Bioinformatics Symposium (BIOT 2012). The full contents of the supplement are available online at http://www.biomedcentral.com/ bmcbioinformatics/supplements/14/S13
Authors’details
1School of Biological Sciences, University of Nebraska-Lincoln, Nebraska, 68588-0118, USA.2Center for Plant Science Innovation, University of Nebraska-Lincoln, Nebraska, 68588-0118, USA.
Published: 1 October 2013
References
1. Wang Z, Gerstein M, Snyder M:RNA-Seq: a revolutionary tool for transcriptomics.Nat Rev Genet2009,10(1):57-63.
2. Hardcastle TJ, Kelly KA:baySeq: empirical Bayesian methods for identifying differential expression in sequence count data.BMC Bioinformatics2010,11:422.
3. Mortazavi A, Williams BA, McCue K, Schaeffer L, Wold B:Mapping and quantifying mammalian transcriptomes by RNA-Seq.Nat Methods2008, 5(7):621-628.
4. Oshlack A, Wakefield MJ:Transcript length bias in RNA-seq data confounds systems biology.Biol Direct2009,4:14.
5. Benjamini Y, Speed TP:Summarizing and correcting the GC content bias in high-throughput sequencing.Nucleic acids research2012,40(10):e72. 6. Hansen KD, Brenner SE, Dudoit S:Biases in Illumina transcriptome
sequencing caused by random hexamer priming.Nucleic Acids Res2010, 38(12):e131.
7. Li J, Jiang H, Wong WH:Modeling non-uniformity in short-read rates in RNA-Seq data.Genome Biol2010,11(5):R50.
8. Bullard JH, Purdom E, Hansen KD, Dudoit S:Evaluation of statistical methods for normalization and differential expression in mRNA-Seq experiments.BMC Bioinformatics2010,11:94.
9. Wu Z, Jenkins BD, Rynearson TA, Dyhrman ST, Saito MA, Mercier M, Whitney LP:Empirical bayes analysis of sequencing-based transcriptional profiling without replicates.BMC Bioinformatics2010,11:564.
10. Smyth GK, Michaud J, Scott HS:Use of within-array replicate spots for assessing differential expression in microarray experiments. Bioinformatics2005,21(9):2067-2075.
11. Anders S, Huber W:Differential expression analysis for sequence count data.Genome Biol2010,11(10):R106.
12. Robinson MD, McCarthy DJ, Smyth GK:edgeR: a Bioconductor package for differential expression analysis of digital gene expression data. Bioinformatics2010,26(1):139-140.
13. Trapnell C, Roberts A, Goff L, Pertea G, Kim D, Kelley DR, Pimentel H, Salzberg SL, Rinn JL, Pachter L:Differential gene and transcript expression analysis of RNA-seq experiments with TopHat and Cufflinks.Nat Protoc 2012,7(3):562-578.
14. Trapnell C, Williams BA, Pertea G, Mortazavi A, Kwan G, van Baren MJ, Salzberg SL, Wold BJ, Pachter L:Transcript assembly and quantification by
RNA-Seq reveals unannotated transcripts and isoform switching during cell differentiation.Nat Biotechnol2010,28(5):511-515.
15. Auer PL, Doerge RW:A Two-Stage Poisson Model for Testing RNA-Seq Data.Statistical Applications in Genetics and Molecular Biology2011,10((1)). 16. Tarazona S, Garcia-Alcalde F, Dopazo J, Ferrer A, Conesa A:Differential
expression in RNA-seq: a matter of depth.Genome Res2011, 21(12):2213-2223.
17. Glaus P, Honkela A, Rattray M:Identifying differentially expressed transcripts from RNA-seq data with biological variation.Bioinformatics 2012,28(13):1721-1728.
18. Auer PL, Doerge RW:Statistical design and analysis of RNA sequencing data.Genetics2010,185(2):405-416.
19. McIntyre LM, Lopiano KK, Morse AM, Amin V, Oberg AL, Young LJ, Nuzhdin SV:RNA-seq: technical variability and sampling.BMC Genomics 2011,12:293.
20. Kvam VM, Liu P, Si Y:A comparison of statistical methods for detecting differentially expressed genes from RNA-seq data.Am J Bot2012, 99(2):248-256.
21. Li R, Yu C, Li Y, Lam TW, Yiu SM, Kristiansen K, Wang J:SOAP2: an improved ultrafast tool for short read alignment.Bioinformatics2009, 25(15):1966-1967.
22. DESeq.[http://www-huber.embl.de/users/anders/DESeq/].
23. NOISeq website.[http://bioinfo.cipf.es/noiseq/doku.php?id=downloads]. 24. Sultan M, Schulz MH, Richard H, Magen A, Klingenhoff A, Scherf M,
Seifert M, Borodina T, Soldatov A, Parkhomchuk D,et al:A global view of gene activity and alternative splicing by deep sequencing of the human transcriptome.Science2008,321(5891):956-960.
25. Kall L, Storey JD, MacCoss MJ, Noble WS:Posterior error probabilities and false discovery rates: two sides of the same coin.J Proteome Res2008, 7(1):40-44.
doi:10.1186/1471-2105-14-S13-S7
Cite this article as:Zheng and Moriyama:Comparative studies of differential gene calling using RNA-Seq data.BMC Bioinformatics2013
14_(Suppl 13):S7.
Submit your next manuscript to BioMed Central and take full advantage of:
• Convenient online submission
• Thorough peer review
• No space constraints or color figure charges
• Immediate publication on acceptance
• Inclusion in PubMed, CAS, Scopus and Google Scholar
• Research which is freely available for redistribution
Submit your manuscript at www.biomedcentral.com/submit