www.wjpr.net Vol 4, Issue 11, 2015.
1042 Thamke et al. World Journal of Pharmaceutical Research
UV METHOD FOR DETERMINATIONIN OF METHOTREXATE
TABLET DOSAGE FORM
Nita Thamke*, Mukesh Mohite, Pratiksha Shinde and Pooja Hulle
Padm. Dr. D. Y. Patil College of Pharmacy, Akurdi, Pune-411044, Maharashtra, India.
ABSTRACT
Two simple, precise and economical UV methods have been developed
for estimation of Methotrexat in bulk formulation. Method A involves
measurement of UV absorbance in Zero order derivative at 374nm.
Method B deals with area under curve measurement (AUC method),
which involves the calculation of integrated value of absorbance with
respect to wavelength between 372-376nm. The drug follows
Beer-Lambert’s law in the concentration range of3-10ug/ml in both the
methods. Results of analysis were validated statistically and were
found to be satisfactory. Thus proposed methods can be successfully
applied for estimation of Methotrexatin routine analytical work.[1,2,3]
KEYWORDS: Methotrexat, Zero order derivative, Area Under Curve method (AUC), UV
Spectrophotometer.
INTRODUCTION
Methotrexate is described chemically L-Glutamic acid,
N-{4-[[(2,4-Diamino-6-pteridinyl)methyl]methylamine]benzoyl}-, Folex: Methotrexate; Mexate.[1]It is a class of
anticancer drug. It is abbreviated MTX and as amethopterin is antimetabolite and antifolate
drug.[1-3]the drug is official in Indian pharmacopoeia,[4] ,USP,[5]and BP.[6] Literature survey
reveals that there are few UV Spectroscopic methods.[7-11] and one HPLC,[12] method is
reported for the determination of methotrexate in plasma and urine of humans, rats and dogs.
So an attempt was made to develop two simple, accurate, rapid and precise
spectrophotometric methods for the determination of Methotrexate in tablet and formulation.
Volume 4, Issue 11, 1042-1047. Research Article ISSN 2277– 7105
Article Received on 27 Aug 2015,
Revised on 20 Sep 2015, Accepted on 14 Oct 2015
*Correspondence for
Author
Nita Thamke
Padm. Dr. D. Y. Patil
College of Pharmacy,
Akurdi, Pune-411044,
www.wjpr.net Vol 4, Issue 11, 2015.
1043 EXPERIMENTAL
Materials
Methotrexatwas obtained as gift sample from Matrix Ltd. NaOH are used as a solvent in the
study.
Instrument
A shimadzu UV-1700 UV/VIS Spectrophotometer was used with 1cm matched quartz cells
were used for spectral measurements.
Stock solution
Accurately about 5 mg of Methotrexatwas weighed and transferred to 50 ml volumetric flask;
50 ml of NaOH was added to dissolve the drug completely with vigorous shaking. Then the
volume was made up with the NaOH up to the mark to give the drug stock solution of
concentration 50μg/ml.
Method A
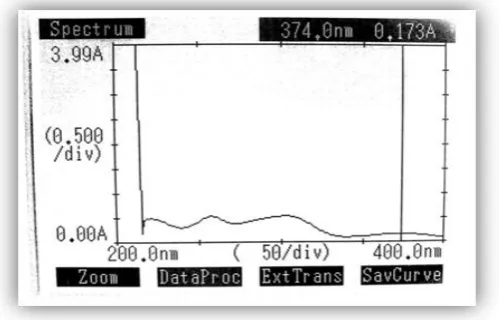
The Zero order derivative spectra at n = 0showed a sharp peak at 374 nm (Figure 1). The
absorbance difference at n=0 (dA/dλ)was calucalted by the inbuilt software of the instrument
which was directly proportional to the concentration of the standard solution.The standard
drug solutions were scanned in the Zero order derivative spectra.A calibration curve was
plotted taking the absorbance difference (dA/dλ) against the concentration of Methotrexate.
The coefficient of correlation (r2), slope and intercept values of this method are given in table
1.[2]
Method B
The AUC (area under curve) method involves the calculation of integrated value of
absorbance with respect to the wavelength between two selected wavelengths λ1 and λ2.
Area calculation processing item calculates the area bound by the curve and the horizontal
axis. This wavelength range is selected on the basis of repeated observations so as to get the
linearity between area under curve and concentration. Suitable dilutions of standard stock
solution (50μg/ml) of Methotrexatwere prepared and scanned in the spectrum mode from the
wavelength range 372nm to 376nm (figure 2) and the calibration curve was plotted as AUC
against concentration of Methotrexat. The method was checked by analyzing the samples
with known concentration. As the results obtained were satisfactory low, the method was
www.wjpr.net Vol 4, Issue 11, 2015.
1044 Analysis of tablet formulation
For the estimation of Methotrexatin tablet formulation by the two methods, ten tablets were
weighed and ground into a fine powder. Tablet powder equivalent to 2.5 mg of Methotrexat
weighed and transferred to 25 ml volumetric flask and dissolve in 25 ml of NaOH. It was
kept for ultra sonification for 45 min, finally the volume was made up to the mark with
NaOH, this was then filtered through Whatman filter paper to get tablet stock solution of
concentration to 100 μg/ml. Various dilutions of the tablet solution were prepared and
analyzed for six times and concentration was calculated by using calibration curve for the two
methods. Both the methods were validated according to ICH guidelines,[13] Recovery studies
were carried out atthree different levels i.e. 80%, 100% and 120% by adding the pure drug (4,
6 and 8 mg respectively) to previously analyzed tablet powdered sample (2.5mg) as per ICH
guidelines.[14] and percentage recovery was calulated as shown in table 2. All the methods
were validated for linearity, accuracy and specificity.
RESULT AND DISCUSSION
The methods A & B for the estimation of Methotrexatin tablet form were found to be simple,
precise, accurate, rapid & reproducible. Beer- Lambert’s law was obeyed in the concentration
range of 3-10 μg/ml in both the methods. The values of standard deviation were satisfactory
low and the recovery studies were close to 100%.The derivative spectroscopic method
applied has the advantage that it locates the hidden peaks in the normal spectrum when the
spectrum is not sharp and it also eliminates the interference caused by the excipients present
in the formulation. The AUC method has advantage that it is applicable to be drug which
shows the broad spectra without a sharp peak. Hence the two methods can be employed for
routine analysis of the drugs in quality control, R&D laboratories.
Table 1: Optical characteristics and parameters
Parameters Method A Method B
Wavelength(nm)
Beer’s – Lambert’s range (µg/ml) Coefficient of correlation (r2 ) Regression equation : Y = mx + c a – Slope (m)
b – Intercept (c) LOD
LOQ
Molar absorptivity
374 3-10 0.9451
0.020 0.026 5.576 16.899 0.015517
372-376 3-10 0.9964
0.104 0.281 0.1143 0.8289
www.wjpr.net Vol 4, Issue 11, 2015.
1045 Table 2: Assay of the Tablet.
Method Tablet
Formulation Label claim(mg) Amount found (mg)* %
mean S.D. R.S.D. S.E.
A B T1 T1 2.5 2.5 2.3 2.4 92 96 0.7528 1.0954 0.818 1.1410 0.3072 0.4471
Table 3 Recovery Studies
Sr. No.
Tablet Sample
Level of recovery %
Mean* S.D.* R.S.D.* S.E.*
A B A B A B A B
[image:4.595.174.424.311.471.2]01 02 03 T1 80 100 120 98.57 99.59 100.28 99.52 100.04 100.21 1.1503 0.7743 0.5519 0.7016 0.0871 0.2211 1.1669 0.7774 0.5503 0.7049 0.0870 0.2206 0.6641 0.4470 0.3177 0.4050 0.0502 0.1276 When *n=3 at each level of recovery
[image:4.595.176.421.526.706.2]Fig. 1: Spectrum by Zero order derivative method.
www.wjpr.net Vol 4, Issue 11, 2015.
1046 CONCLUSION
An accurate and precise zero order derivative and AUC method have been developed and
evaluated for the analysis of methotrexate using (0.1N) NaOH as solvent. The percentage
recovery and obtained concentrations of active ingredient where within the acceptable limits.
These methods can be used for the estimation of methotrexate in bulk and formulation for
quality control studies.
REFRENCES
1. Remington, The Science and Practice of Pharmacy, 21st Edition, Published by Wolters
Kluwer(India) Private limited new delhi, Volume II: 1580.
2. Martindale the complete drug reference, Edited by Sean C. Sweetman. Published by the
pharmaceutical press An imprint of RPS publishing., 2009; 6: 745-51.
3. The Merck index an encyclopedia of chemicals, drugs and biological 13th editions
published by merck research laboratories division of merck and Co., INC. whitehouse
station, NJ., 2001; 6015.
4. Indian Pharmacopoeia 2014, Vol II published by the Indian Pharmacopeia commission
Ghaziabad., 2014; 2: 2191-2194.
5. USP NF, The Official Compendia of Standards, Asian edition., 2008; 3: 2662-2663.
6. British Pharmacoppeia 2004 vole 3 amended by supplements., 2004; 4.1-4.8: 2577.
7. Bandi R., N.V.S.Naidu, P.SugunbAnd KantipudiRambabu.Validation Of UV – Visible
Spectrophotometric method for the analysis of methotrexate in pharmaceutical
formulations.International Journal of Pharmacy and Pharmaceutical Science Research.,
2013; 3(3): 108-114.
8. Subbarayan S., KarthikeyanV.Analytical method development and validation of layer by
layer magnetic nanoparticles of methotrexate and melphalan.world journal of pharmacy
and pharmaceutical sciences., 3(3): 1221-1253.
9. Bandi R. Naidu.N.V.S. and P. Suguna. Development and validation of UV-visible
spectrophotometric method for the analysis of methotrexate in pharmaceutical
formulations. Scholars Research Library Der PharmaChemica., 2013; 5(4): 71-79.
10.Maste M. M., Bhat A. R., Mohite M. and Patil D., Spectroscopic method for estimation of
Methotrexatin bulk and tablet dosage form., 2011; 2(2): 47-50.
11.JaroslawC ,Tomasz G and Janusz B. methods for methotrexate determination in
MACROMOLECULAR CONJUGATES DRUG CARRIER. ActaPoloniae
www.wjpr.net Vol 4, Issue 11, 2015.
1047
12.Alice R. Oliveira, Lilia B. Caland, Edilene G. Oliveira, Eryvaldo S. T. Egito, Matheus F.
F. Pedrosa and Arnobio A. Silva Junior, HPLC-DAD and UV-Vis Spectrophotometric
Methods for Methotrexate Assay in Different Biodegradable Microparticles, J. Braz.
Chem. Soc., 2015; 26(4): 649-659.
13.ICH, Q2A, Text on Validation of Analytical Procedures, International Conference on
Harmonization, Geneva, October 1994; 1.
14.ICH, Q2B, Validation of Analytical Procedures:Methodology, International Conference