ANALYTICAL METHOD DEVELOPMENT AND VALIDATION OF
RP-HPLC METHOD FOR THE DETERMINATION OF
TULOBUTEROL IN TRANSDERMAL DRUG DELIVERY SYSTEM
Kavita Parui* and Dr. Snehalatha Boddu
Department of Quality Assurance, Oriental College of Pharmacy, Sanpada, Navi Mumbai.
ABSTRACT
A sensitive, accurate and reproducible RP-HPLC method has been
developed and validated for the determination of Tulobuterol in
transdermal drug delivery system. Chromatographic separation was
achieved isocratically on a Prontosil C18 column (250 x 4.6 mm, 5 μm)
with a mobile phase consisting of Acetonitrile:0.02M Potassium
dihydrogen phosphate buffer (60:40), adjusted to pH 3.0 with
Orthophosphoric acid at the flow rate of 1.0 mL/min. UV detection
was performed at 215 nm. The retention time for tulobuterol was found
to be 2.880 minute. The proposed method was validated by parameters
such as selectivity and specificity, linearity, accuracy, precision, limit
of detection, limit of quantification, robustness and assay according to the ICH guidelines.
The calibration curve of tulobuterol was linear in the range of 25 – 75 µg/mL with correlation
coefficient (r2) of 0.9998. Both intra and inter-day precision and accuracy were within acceptable limits. The limit of detection and limit of quantification for tulobuterol were found
out to be 2.90 and 0.95 respectively. The robustness was also estimated on the small
fluctuations in the mobile phase compositions, wavelength and the flow rate. The developed
method can be applicable for routine quantitative analysis.
KEYWORDS: Tulobuterol, Transdermal drug delivery, RP-HPLC, Method Validation.
INTRODUCTION
The Tulobuterol patch is the first bronchodilator transdermal delivery system developed for a
long acting β2 receptor agonists (LABA) and has been widely used in the management of
asthma and chronic obstructive pulmonary disease (COPD). Tulobuterol is official in
Volume 6, Issue 5, 1148-1156. Research Article ISSN 2277– 7105
*Corresponding Author
Kavita Parui
Department of Quality
Assurance, Oriental College
of Pharmacy, Sanpada, Navi
Mumbai.
Article Received on 09 March 2017,
Revised on 29 March 2017, Accepted on 19 April 2017
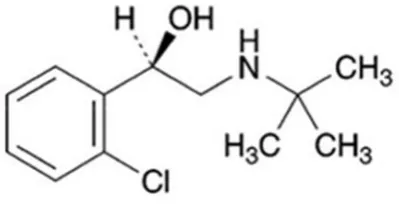
Japanese Pharmacopoeia. The molecular formula of tulobuterol is C12 H18ClNO and chemical
[image:2.595.207.407.139.245.2]name is (RS) -2-tert-Butylamino-1- (2-chlorophenyl) ethanol.[1-4]
Figure 1: Structure of Tulobuterol
Nocturnal asthma is defined as variable exacerbation of the underlying asthma condition,
which is associated with increased symptoms of airway hyper-responsiveness and/or
worsening of lung function. Nocturnal asthma exaggerates and decrease in lung function in
the early morning which known as the ―morning dip‖. Hence tulobuterol patch was
developed to prevent the morning dip and to sustain drug efficacy over 24 hours.[5] The tulobuterol patch is a unique transdermal drug delivery system prepared by using crystal
reservoir technology. It’s a directly acting sympathomimetic and has selective β2 receptor
stimulating activity. It’s easy to use and requires only once-daily application. It should not be
used in the patients with a history of hypersensitivity. The patch are available in three
different doses: Tuloplast™ 0.5 (Each patch of 2.5 cm2 contains 0.5 mg Tulobuterol), Tuloplast™ 1 (Each patch of 5 cm2 contains 1.0 mg Tulobuterol), Tuloplast™ 2 (Each patch of 10 cm2 contains 2.0 mg Tulobuterol).[6-7]
The literature survey showed a very few chromatographic methods[8-12] were developed for the determination of tulobuterol in human plasma. Hence, there’s no specific method for the
determination of tulobuterol by RP-HPLC by using this particular mobile phase in
transdermal drug delivery system. The proposed method is optimized and validated as per the
international conference on harmonization (ICH) guidelines.[13]
EXPERIMENTAL
Materials and reagents
Tulobuterol was obtained as a gift sample from Vamsi Labs Ltd., Solapur, India. The
available pharmaceutical formulation (Tuloplast™ 2 Transdermal Patch) was obtained
10 cm2 contains 2.0 mg of Tulobuterol were used in analysis. HPLC grade acetonitrile (Thomas Baker) and water, Potassium dihydrogen phosphate (LOBA CHEM),
Orthophosphoric Acid.
Instrumentation
RP-HPLC was performed using Shimadzu HPLC system consisting of a pump LC-20AD,
rheodyne sample injection port with 20 microlitre loop, SPD-20A UV-Detector, Spinchrom
software, column used was Prontosil C18 (250 x 4.6 mm, 5 µm), Weighing was done on
Contech CA-123 balance and pH was adjusted using PCI analytics Digital pH meter 111.
Principle
Reversed phase liquid chromatography isocratic elution with SPD-20A UV detection.
Chromatographic Conditions
Column : Prontosil C18 (250 x 4.6 mm, 5 µm particle size)
Mobile Phase : Acetonitrile: 0.02 M Potassium dihydrogen phosphate buffer (60:40),
adjusted to pH 3.0 with Orthophosphoric acid
Flow Rate : 1.0 mL/min
Wavelength : 215 nm
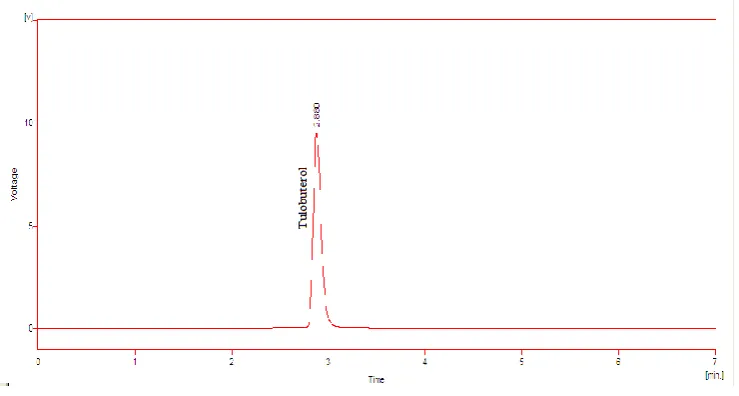
Retention Time : 2.880 minute
Injection Volume : 20 µL
Runtime : 7 minutes
[image:3.595.71.504.297.736.2]Elution : Isocratic
Figure 3: Chromatogram of Tulobuterol Patch
Preparation of 0.02 M Potassium dihydrogen orthophosphate (pH 3.0)
About 2.7218 g of Potassium dihydrogen orthophosphate was accurately weighed and
transferred to 1000 ml volumetric flask and dissolved in 900 ml of water. The pH was
adjusted to 3.0 ± 0.05 with Orthophosphoric acid, volume was made up to 1000 ml with
water. The solution was then filtered using 0.45 µ membrane filter.
Preparation of Mobile Phase
Mixed Acetonitrile and 0.02 M Potassium dihydrogen orthophosphate buffer adjusted to pH
3.0 with Orthophosphoric acid in the ratio 60:40 and was sonicated.
Preparation of Standard Solution
About 100 mg of Tulobuterol was accurately weighed and transferred into 100 ml volumetric
flask and dissolved in mobile phase and final volume was made up to the mark with mobile
phase. Final concentration of tulobuterol of 50 µg/ml are made by suitable dilutions.
Preparation of Sample solution
Take the patch equivalent to 2 mg, then remove the release liner. After removal of release
liner, their rims were carefully and completely cut into pieces and then patch was transferred
into 25 ml conical flask containing 10 ml of mobile phase, sonication for 15 minutes; after
sonication volume make up to 20 ml with mobile phase and again sonicate for 15 minutes. It
was cooled down at room temperature for 15 minutes. Solution was filtered using Whatman
RESULTS AND DISCUSSION
The proposed RP-HPLC method was validated as per ICH guidelines. The parameters studied
for validation were selectivity and specificity, linearity, accuracy, precision, limit of
detection, limit of quantification, robustness and assay.
Selectivity and Specificity
To assess the selectivity of the developed method solution of drug were injected into the
system then observe sharp peak of Tulobuterol were obtained at retention time of 2.880 min
in reference to standard solution. Specificity was determined by comparison of the
chromatogram of standard and sample solution. As the retention time of standard drug and
the retention time of the drug in sample solution were same, so the method was specific. The
parameters like resolution (Rs) and asymmetric factor were calculated. Good correlation was
found between the results of standard and sample solution. Result are shown in the Table 1.
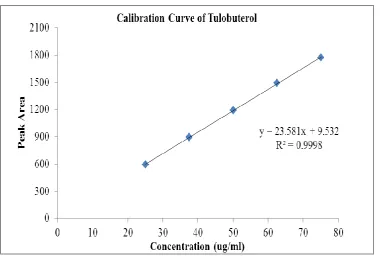
Linearity
The linearity of an analytical method is its ability to obtain results, which are directly
proportional to the concentration of analyte in the sample. It was carried out by preparing the
sample solution containing 25-75 µg/ml. A calibration curve was drawn by plotting
concentration on X-axis Vs area on Y-axis and regression equation, correlation coefficient,
y-intercept, slope of the equation was calculated. Result are shown in the Table 2 and Figure 4.
Accuracy
The accuracy of the proposed methods was assessed by recovery studies at three different
levels i.e. 75%, 100% and 125%. The recovery studies were carried out by adding known
amounts of standard Tulobuterol were added to pre-analyzed samples and they were
subjected to proposed HPLC method. The recoveries result of Tulobuterol in transdermal
patch are shown in the Table 3.
Precision
Precision study was performed to find out intraday and interday variations. The intraday and
interday precision study of Tulobuterol was carried out by estimating the correspondence
response 3 times on the same day and on 3 different days for 3 different concentrations of
tulobuterol and the results are reported in terms of % relative standard deviation (% RSD)
Limit of detection (LOD) and Limit of quantitation (LOQ)
LOD is ability of analytical method able to detect the lowest concentration of the analyte.
LOQ is lowest concentration of the analyte which can be quantitatively analyzed with
acceptable precision and accuracy. It was calculated based on the slope and blank response
from the calibration curve as per ICH guidelines. LOD and LOQ were calculated based on
the standard deviation of the response and slope. Result are shown in Table 4.
Robustness
The robustness study was done by making small changes in the optimized method parameters
like ± 2% change in mobile phase ratio, ± 2% change in flow rate and ± 2% change in
wavelength. There was no significant impact on the retention time and tailing factor.
Assay
The amount of Tulobuterol per patch was calculated by comparing the peak area of the
standard solution and sample. Result are shown in Table 5.
Table 1: System suitability parameters
Table 2: Linearity of Tulobuterol
System Suitability Parameters Tulobuterol
Retention time (min) 2.880
Resolution 2.86
Theoretical Plates 4681
Asymmetric Factor 1.62
Sr No. Concentration (µg/ml) Peak Area
1. 25 593.926
2. 37.5 897.493
3. 50 1189.737
4. 62.5 1490.556
5. 75 1771.21
Regression equation y = 23.581x + 9.532 Correlation coefficient (R2) 0.9998
Slope 23.581
Figure 4: Calibration curve of Tulobuterol
Table 3: Accuracy Studies of Tulobuterol
Table 4: Precision Studies, LOD and LOQ of Tulobuterol
Table 5: Assay Determination of Tulobuterol
CONCLUSION
The proposed HPLC method for the determination of tulobuterol in transdermal drug delivery
system was found to be sensitive, accurate and reproducible. This conventional method has
not been reported before. All the validated parameters were found to be within the range. Pre-analyzed
sample solution (µg/ml)
Sample concentration
(µg/ml)
Excess drug added (µg/ml)
Amount recovered
(µg/ml)
% Recovery
Tulobuterol
25 12.5 37.13 99.00%
25 25 49.59 99.19%
25 37.5 62.10 99.36%
Parameters
Precision(%RSD)
Limit of detection
Limit of Quantitation Intra-day
( n=3) Inter–day (n=3)
Tulobuterol 0.42 0.35 2.90 0.95
Brand % Amount found
Tuloplast™ 2 (Each patch of 10 cm2
contains
[image:7.595.85.532.375.652.2]Thus the method developed can be used as alternative method for the routine determination
of the drug in quality control laboratories as it has taken very short run time of around 3 min.
ACKNOWLEDGEMENT
The authors are thankful to Vamsi Labs Ltd., Solapur for kindly providing gift samples of
Tulobuterol.
REFERENCES
1. T. Numao, T. Fukuda. Japanese guideline for the diagnosis and management of bronchial
asthma (1998)—its results and reversion, Nihon rinshon, Jpn. J. Clin. Med, 2001; 59:
1871-1877.
2. Asia Pacific COPD Roundtable Group, Global initiative for chronic obstructive lung
disease strategy for the diagnosis, management and prevention of chronic obstructive
pulmonary disease: an Asia-Pacific perspective, Respirology, 2005; 10: 9-17.
3. Japanese Pharmacopeia. The Ministry of Health, Labour and Welfare. Prefectural office
in Japan. (2016); 17th Edition: 1738-40.
4. Tulobuterol Drug Profile:
https://pubchem.ncbi.nlm.nih.gov/compound/5606#section=WHO-ATC-Classification-System.
5. Gen Tamura, Masakazu Ichinose, Yoshinosuke Fukuchi and Terumasa Miyamoto.
Transdermal Tulobuterol Patch, a Long-Acting β2-Agonist. Allergology International,
2012; 61: 219-229.
6. Ichikawa T, Sugiura H. Long-term safety, efficacy and patient acceptability of the
tulobuterol patch. Research and Reports in Transdermal Drug Delivery, 2013; 2: 9-18
http://dx.doi.org/10.2147/RRTD.S34031.
7. Tuloplast Monograph:
https://tuloplast.files.wordpress.com/2015/11/tuloplast-adults-monograph.pdf.
8. Longmei Cheng, Guangtao Hao, Xueyi Chen, Yingfu Zhang, Yuanyuan Zhang, Ruihua
Dong, Zeyuan Liu, Hengyan Qu. Quantification of tulobuterol, a selective β2 adrenergic
agonist, in human plasma by liquid chromatography-tandem quadrupole mass
spectrometry. Journal of Chinese Pharmaceutical Sciences, 2016; 25(7): 526–534.
9. Xiao Han, Ran Liu, Lifang Ji, Mei Hui, Qing Li, Liang Fang, Kaishun Bi. Determination
of tulobuterol in rat plasma using a liquid chromatography–tandem mass spectrometry
Chromatography B, 2016; 1008: 108-114.
http://dx.doi.org/10.1016/j.jchromb.2015.11.017.
10.LIU Zhi-mei, LIU Wen-shuang, CHEN Xue-hong, ZHU Jun-ming, LIU Wei.
Determination of tulobuterol in tulobuterol transdermal patch by HPLC. Chinese Journal
of Hospital Pharmacy, 2010; 30(12): 996-999.
11.XU Feng-Guo, ZHANG Zun-Jian, TIAN Yuan, JIAO Hao-Yan, LIANG Jia-Bi, GONG
Guo-Qing. Determination of Tulobuterol in Rabbit′s Plasma by LC/MS and Study of Its
Pharmacokinetics. Journal of China Pharmaceutical University, 2005; 36(2): 146 -149.
12.Fengguo Xu, Zunjian Zhang, Yuan Tian, Haoyan Jiao, Jiabi Liang, Guoqing Gong.
High-performance liquid chromatography electrospray ionization mass spectrometry
determination of Tulobuterol in rabbit's plasma. J Pharm Biomed Anal, 2005; 37(1):
187-93. http://dx.doi.org/10.1016/j.jpba.2004.09.052.
13.International Conference on Harmonization, Harmonized Tripartite Guideline, Validation