Original citation:
Norman, D. G., Watson, D. G., Burnett, B., Fenne, P. M. and Williams, M. A. (Mark A.). (2018) The cutting edge - Micro-CT for quantitative toolmark analysis of sharp force trauma to bone. Forensic Science International, 283. pp. 156-172.
Permanent WRAP URL:
http://wrap.warwick.ac.uk/97194
Copyright and reuse:
The Warwick Research Archive Portal (WRAP) makes this work by researchers of the University of Warwick available open access under the following conditions. Copyright © and all moral rights to the version of the paper presented here belong to the individual author(s) and/or other copyright owners. To the extent reasonable and practicable the material made available in WRAP has been checked for eligibility before being made available.
Copies of full items can be used for personal research or study, educational, or not-for-profit purposes without prior permission or charge. Provided that the authors, title and full bibliographic details are credited, a hyperlink and/or URL is given for the original metadata page and the content is not changed in any way.
Publisher’s statement:
© 2018, Elsevier. Licensed under the Creative Commons Attribution-NonCommercial-NoDerivatives 4.0 International http://creativecommons.org/licenses/by-nc-nd/4.0/
A note on versions:
The version presented here may differ from the published version or, version of record, if you wish to cite this item you are advised to consult the publisher’s version. Please see the ‘permanent WRAP URL’ above for details on accessing the published version and note that access may require a subscription.
The Cutting Edge – Micro-CT for Quantitative Toolmark Analysis of
Sharp Force Trauma to Bone
HIGHLIGHTS
• Micro-CT was demonstrated to be a valuable toolmark analysis and visualization tool
• Quantitative knife toolmark properties can be easily extracted from micro-CT data
• Mechanically made toolmarks differ from those made under more real-world conditions
• Serrated and plain blades produce statistically different toolmark properties
• Toolmarks correlate with knife properties allowing successful predictive modelling
ABSTRACT
Toolmark analysis involves examining marks created on an object to identify the likely tool responsible for
creating those marks (e.g., a knife). Although a potentially powerful forensic tool, knife mark analysis is still in
its infancy and the validation of imaging techniques as well as quantitative approaches is ongoing. This study
builds on previous work by simulating real-world stabbings experimentally and statistically exploring
quantitative toolmark properties, such as cut mark angle captured by micro-CT imaging, to predict the knife
responsible. In experiment 1 a mechanical stab rig and two knives were used to create 14 knife cut marks on
dry pig ribs. The toolmarks were laser and micro-CT scanned to allow for quantitative measurements of
numerous toolmark properties. The findings from experiment 1 demonstrated that both knives produced
statistically different cut mark widths, wall angle and shapes. Experiment 2 examined knife marks created on
fleshed pig torsos with conditions designed to better simulate real-world stabbings. Eight knives were used to
generate 64 incision cut marks that were also micro-CT scanned. Statistical exploration of these cut marks
suggested that knife type, serrated or plain, can be predicted from cut mark width and wall angle. Preliminary
results suggest that knives type can be predicted from cut mark width, and that knife edge thickness correlates
with cut mark width. An additional 16 cut marks walls were imaged for striation marks using Scanning Electron
Microscopy with results suggesting that this approach might not be useful for knife mark analysis. Results also
indicated that observer judgements of cut mark shape were more consistent when rated from micro-CT images
than light microscopy images. The potential to combine micro-CT data, medical grade CT data and photographs
to develop highly realistic virtual models for visualisation and 3D printing is also demonstrated. This is the first
study to statistically explore simulated real-world knife marks imaged by micro-CT to demonstrate the potential
of quantitative approaches in knife mark analysis. Findings and methods presented in this study are relevant to
both forensic toolmark researchers as well as practitioners. Limitations of the experimental methodologies and
imaging techniques are discussed, and further work is recommended.
Keywords
Micro-CT Cut marks Scanning electron microscopy (SEM)
1.0
INTRODUCTION
1The most common method of murder in the UK is through the use of sharp instruments such as knives [1,2]. 2
Forensic pathologist typically conduct toolmark analysis to determine the type of instrument and level of force 3
used, the trajectory of the weapon during impact, and the position of the victim and perpetrator during the 4
assault [3]. No tool type produces exactly the same toolmark, which makes analysis of the remaining marks a 5
powerful forensic method. [4]. Toolmark Analysis of Sharp Force Trauma covers a broad range of tools [5]
6
including saw marks [6-10] and hacking marks [11-13], typically found in body dismemberment, and knife marks 7
[13-21] seen in fatal stabbings – the will be examined in this study. 8
9
In knife mark analysis experiments the simulation of real-world stabbings is difficult and therefore it is not 10
surprising that previous work have started with tightly controlled experimental produces. These often use 11
defleshed or dry bone samples which are clamped whilst toolmarks are made by either the experimenters
[17-12
19] or by some mechanical means [15,20-21]. However, knife type distinctions are more difficult when 13
toolmarks are made in real-world conditions when factors such as tissue presence, bone elasticity [22], knife 14
impact and knife trajectory are more variable. Indeed, using more realistic conditions Ferllini (2012) 15
demonstrated, contrary to previous consensus, it was not possible to determine knife type from the toolmarks 16
due to significant variability in their properties [23]. This is concerning as toolmark analysis has come under 17
legal scrutiny in recent years, via the Daubert Standards introduced by the US Supreme Court [24] and Section 18
20 of the UK Forensic Science Regulator’s Code of Practice. 19
20
Traditional light microscopy has been the primary imaging method for toolmark analysis [25, 26-27]. However, 21
although possible [28] determining quantitative toolmark properties with this method can be unreliable [29]. 22
Furthermore, without destructive methods, toolmark information that is not visible from the surface, such as 23
wall angle and depth, cannot be obtained [30].Fortunately, alternative methods are being developed. Scanning 24
Electron Microscopy (SEM) has been used to measure knife mark widths [31, 20], and is currently unique in 25
being able to reveal striation patterns imprinted on cut mark walls which are strongly diagnostic for determining 26
saw type [21]. Numerous studies aimed at identifying knife striations in costal cartilage have produced mixed 27
results [21, 23, 31-35] and the authors know of no studies investigating knife striations in bone. Optical laser 28
scanning can capture 3-dimensional (3D) data at a resolution around 100µm+ [36]. This has been used for; 29
crime scene scanning [37], traffic accident documentation [38], blunt force injury capture [39-41], and model 30
creation for 3D printing [42-43]. Sansoni et al (2009) provided initial support that laser scanning could also be 31
used in knife and saw marks analysis [36]. Crucially though none of the above methods allow for the internal 32
toolmark properties to be captured non-destructively [44-45]. Although Medical grade CT has been shown to 33
resolutions (>300μm) precludes it as an alternative to microscopy for extracting toolmark properties [28, 30,
35
48]. However, micro-CT is likely to be more appropriate for the extraction of toolmarks properties due to its 36
significantly higher spatial resolution (0.5-100µm) [14]. 37
38
The application of micro-CT in forensic investigations has been pioneered by Thali et al [14], Rutty et al [48] and 39
others, applying it directly to toolmark analysis [9, 17, 47, 49-50]. Thali et al created puncture marks in pork 40
shoulders and using micro-CT took 2D slices of the puncture marks before visually overlaying the knife blade tip 41
to suggest a match [14]. Rutty et al described and demonstrated, with a small sample of different bone traumas, 42
the potential of micro-CT for forensic science [48]. Capuani et al’s study however suggested that micro-CT could 43
not be used to distinguish between knife marks, however it was noted that their sample size was small [17]. 44
Gaudio et al used cone beam CT to image puncture marks on bone at a relatively low resolution of 100-300μm3
45
before exporting the data as 3D mesh models to Geomagic Studio where measurements of the length, depth 46
and width were taken [50]. The errors in measuring the toolmark geometries were ±0.6mm with the author 47
describing the 3D reconstructions as “extremely realistic 3D models”–the present authors suggest that this can 48
be much greater with current technology. Furthermore, micro-CT has also been recommended as an effective 49
method for saw mark analysis [9]. A recent study by Pelletti et al showed that micro-CT allowed for clear 50
objective measurements of saw marks with high agreement across different raters [10]. Baier et al, showed 51
how micro-CT could be used successfully in a homicide case and, although no formal toolmark analysis was 52
performed, the authors noted that micro-CT did allow for excellent visualisation of toolmark properties [44]. 53
Finally, other non-sharp force trauma toolmark studies, such as those by Giraudo et al, have demonstrate micro-54
CT as a useful tool for gunshot residue analysis [51]. Although these few studies show great potential for micro-55
CT as a non-destructive toolmark imaging technology, the previous studies contained only a small number of 56
cut marks with little to no quantitative toolmark analysis conducted. Asides from quantitative methods, micro-57
CT has other benefits in toolmark analysis. For example, it allows the possibility of creating high resolution 3D 58
models that can be fused with medical CT scans – such as placing a toolmarked rib its anatomical context. 59
Photographs of the defleshed toolmarks can be mapped onto the fused model providing additional colour 60
information such as bone staining. Susepcted knives and these 3D models could be imported into the 3D digital 61
environment allowing digital attempts of weapon-wound matching. These 3D models could be printed and used 62
as visual props for forensic investigators or a jury [42-43]. 63
64
In summary, the current study aims to evaluate a range of toolmark analysis imaging methods and 3D 65
visualisation techniques and determine whether these methods can identify toolmark properties that allow for 66
the statistical determination of knife type from knife marks created on bone as a result of a simulated stabbing 67
2.0 MATERIALS AND METHODS
692.1
Methodology Summary
70
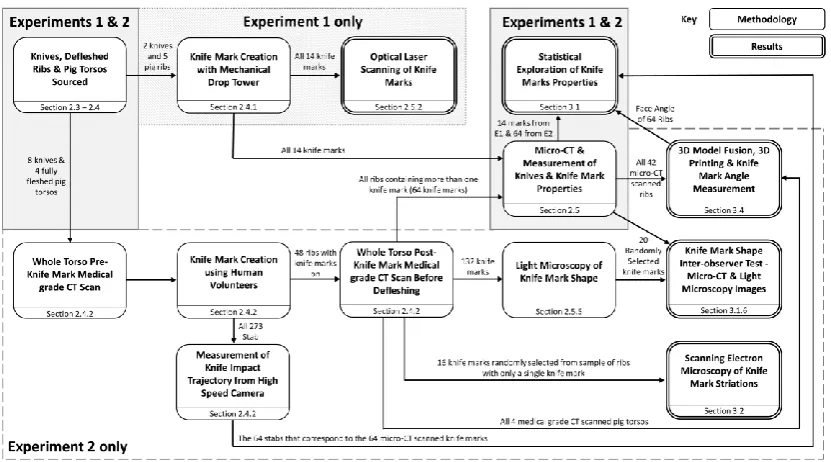
Given the complexity of the methodology i.e. two experiments, various imaging methods assessed, and 71
different analyses preformed, a diagrammatic summary of the methodology is presented [Fig.1.]. 72
73
Fig. 1. Diagrammatic summary of the study including experiment 1 and 2, each different imaging method and
74
analysis and which section of the article to reference
75 76
2.2
Terminology
77
Toolmarks resulting from sharp instruments such as knifes are often called cut marks and can be classified into 78
clefts, punctures or incisions [5]. Previous work has already demonstrated how micro-CT could be used to 79
analyse puncture marks [14], therefore the focus of this study is incision cut marks. Given the lack of 80
standardisation in the literature regarding toolmark terminology, specific definitions are provided [Fig. 2.]. 81
[image:5.595.92.508.166.397.2]83
Fig. 2. Cut mark terminology A) 3D model examples of cut mark shapes, Y, T and V, usually made by different
84
knife types B) The width is defined as the minimum distance between the edges of the cut mark and is measured
85
at the surface of the bone thereby does not include cut mark wastage. Cut mark length is the minimum distance
86
between the start and end of the cut mark. C) The wall angle is the maximum angle between the two adjacent
87
walls intersecting on the cut mark floor. The serrated angle, only present in Y shaped cuts marks, is the maximum
88
(obtuse) angle between the wall that does not intersect the floor and its adjacent wall which does. The depth is
89
the maximum distance from the cut mark floor to the surface of the bone. The floor radius is the radius of the
90
circle whose perimeter in tangential to the two adjacent walls intersecting on the cut mark floor. D) The
91
measurement of face angle is described as the angle between the lateral face of the rib (i.e. the face of the rib
92
facing away from the body) and the cut mark floor. Striations are observed on the wall of the incision mark
93
highlighted white. Note that some of these measures (serrated angle, face angle and floor radius) have not been
94
described in previous literature, possibly because they would be difficult to visualise without the use of micro-CT.
95 96
2.3
Knives Sourced
97
Five confiscated worn knives from the Physical Protection Group of the Metropolitan Police (knives 1-2 and 6-98
8, [Fig. 4.]) with an additional 3 worn kitchen knives (knives 3, 5 & 9, [Fig. 4.]). One serrated (knife 4) and one 99
plain knife (knife 5) were used in Experiment 1 and four serrated and four plain knives were used for Experiment 100
2 (knife 4 was used in both experiments). Quantitative measures of the knife properties [Fig. 5.] as 101
recommended by Ferrilli (2012) [23], are presented [Table. 1]. 102
103
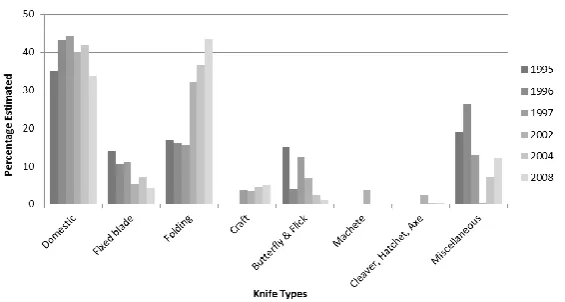
Fig. 3.Classes of knives that are either confiscated from prisoner’s property or confiscated from the street 104
between 1995 and 2008 by the Physical Protection Group of the Metropolitan Police [52].
[image:6.595.160.443.583.734.2]Table 1
Properties of knives used in Experiments 1 and 2
Key Knife Type Individual
Knife Tip Angle (°)
Edge Angle (°)
Serrated angle (°)
Edge Thickness (mm)
1 Serrated Steak1 45 23 164 0.86
2 Serrated Fishing2 60 34 158 0.77
3 Serrated Pairing2 42 37 146 0.61
4 Serrated Steak2 49 50 140 1.03
5* Plain Vegetable4 50 42 n/a 0.88
6 Plain Folding4 57 29 n/a 0.42
7 Plain Cook’s3 70 44 n/a 0.33
8 Plain Cleaner3 34 35 n/a 0.67
9 Plain Carving4 75 23 n/a 0.31
1 Double serration 2 Classic serrations 3 Flat bevel 4 Asymmetrical flat bevel *Only used in Experiment 1
106
Fig. 4. From left to right, Knives 1-4 serrated, 5-9 plain edged. Five Confiscated knives donated by the Physical
107
Protection Group of the Metropolitan Police (Knives 1-2 & 6-8), and two knives (Knives 3 & 9) used in experiment
108
2. One knife (Knife 5) used solely in experiment 1 along with Knife 5.
109 110
[image:7.595.182.423.143.472.2]111
Fig. 5. Diagram of knife properties reported in Table 1. A) A Plain blade grind cross section showing the Blade
112
Edge Thickness, the thickness of the blade at the top of the cutting edge, and the Blade Edge Angle relating to
113
the sharpness of the cutting edge; B) A Serrated blade grind cross section showing the Blade Serrated Angle,
114
similar to the serrated angle for cut marks but is only present on serrated blades, is the maximum (obtuse) angle
115
between the blade face not intersecting the cutting edge and the adjacent cutting face and C) Blade profile
116
showing the Blade Tip Angle relating to the point of the tip
[image:7.595.177.418.534.685.2]2.4
Knife Mark Procedures
1182.4.1 Experiment 1 Procedure 119
To understand conflicting findings in the literature, one aim was to compare toolmarks made in a more 120
controlled manner (Experiment 1) against those made in a more simulated real-world fashion (Experiment 2). 121
Cut marks were created on dry bone using mechanical means [15, 17-18, 21, 35, 46]. To replicate a “push and
122
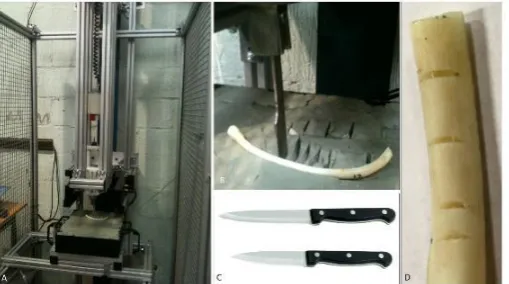
thrust” effect seen in human stabbing kinematics [53], a Home Office Body Armour Drop Test Rig [Fig. 6A.]
123
consisting of a 1.9kg missile with plastozote dampers was used. Knife impact energy was specified as 45J 124
typically delivered in a human knife attack [54]. Three pig ribs were sourced from a butcher, manually defleshed, 125
and air dried prior to testing [18, 20, 15-26]. The ribs were placed on a standard clay backing with approximately 126
¼ of the rib edge in the path of the knife projectile [Fig. 6B.]. 7 marks were generated each by two knives (knives 127
4 and 5, [Fig. 6C.]) generating 14 incisions for imaging [Fig. 6D.]. 128
[image:8.595.172.427.299.441.2]129
Fig. 6. A) Drop Test Rig; B) Knife marking dry rib; C) Two knives used in experiment 1, Knife 4, left and Knife 5
130
right; and D) 4 cut marks generated by Knife 4
131 132
2.4.2 Experiment 2 Procedure 133
In contrast to Experiment 1, Experiment 2 aimed to create more realistic toolmarks. Due to their similarities to 134
human tissue [18, 23, 55] and as the torso is the most targeted region during knife attacks [18, 23, 35] four fully 135
fleshed pig (sus scrofa) torsos were sourced from a medical meat supplier. For practical reasons such as storage 136
and medical imaging, the organs were replaced with tightly compacted High-Density Polyethylene bags and the 137
samples were then stitched up to mimic typical skin tension. High-Density Polyethylene is similar in density to 138
human tissue and would therefore partially simulate blade resistance. To mimic human skin thickness, 139
subcutaneous fat was thinned and to create clothing resistance, white T-shirts were then stitched on the torsos 140
[23] which also allowed labelling of the individual stab wounds with a fabric pen. As a pre-experiment baseline, 141
the whole samples were scanned using a GE ‘Medical’ grade CT system (resolution 300µm) before being
142
refrigerated overnight. Rather than rigidly holding the torsos in position, the samples were placed upright so 143
that the torso was approximately the anatomical height of an average male torso and then rested against a 5cm 144
solid thick polystyrene sheet which was supported by a clamp. This allowed the sample to partially recoil on 145
movement [Fig. 7.] the samples were mounted with one side of the ribs perpendicular to the human volunteer 147
ensuring knife to rib contact. A Casio EX-ZR100 camera recorded each knife impact at 240fps with video 148
software used to measure the knife impact trajectory relative to the surface of the sample (serrated knife 149
trajectory was later used for analysis). 150
[image:9.595.181.415.161.353.2]151
Fig. 7. Pig torso sample with white material outer layer clamped in an upright orientation positioned at average
152
torso height prior to cut mark generation by human effort.
153 154
Two right handed male volunteers performed underarm and overhead stabs with moderate force, anywhere 155
on the sample between ribs 4-10, thereby not restricting the volunteers to adopt an unnaturally precise action. 156
10 stabs per volunteer per stab type and per knife was planned, equating to 320 stabs. However, two of the 157
serrated knives broke (Knife 1 snapped midway along the blade after 7 impacts and Knife 2 snapped at the 158
handle after 26 impacts) leading to 273 stabs in total. The volunteers noted that the serrated blades allowed 159
for a much more “penetrating” and ”controlled” stabbing and that wider knives didn’t penetrate very far often
160
stopping with just the tip perforating the skin presumably due to the intercostal rib spaces. Samples were 161
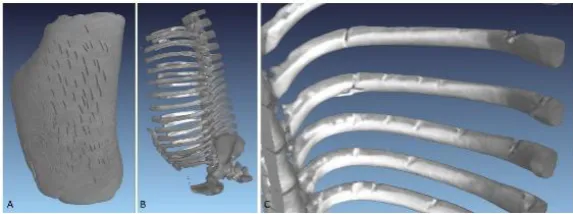
scanned again using medical grade CT (resolution 300µm) with the tissue cut marks now clearly visible from the 162
scans [Fig. 8.]. This provided baseline scans of the ribs in their anatomical positions, allowing for subsequent 163
model fusion with the micro-CT data. Following medical CT scanning the pig samples were stored overnight in 164
a fridge. 165
166
Fig. 8. A) Medical grade CT scan of the tissue B) bone from a pig torso and C) cut marks sample following human
167
stab cut mark generation conducted in experiment 2.
[image:9.595.153.440.629.736.2]The ribs were manually dissected out by a trained anatomist, ensuring no confounding cut marks were created. 169
A mechanical saw separated the ribs at the spine ends and a surgical knife cut between the intercostal spaces 170
to separate each individual rib. It was noted that the ribs stabbed with Knife 3 were shattered, and although a 171
single rib was salvaged, the rest were discarded. Defleshing and preparing the rib samples was done using a 172
chemical antiformin solution method proposed by Snyder et al [56](for alternative methods including burying, 173
water maceration, mechanical removal, boiling, biological detergent, bleach, use of dermestid beetles and 174
chemical solutions, see [57-65]). The antiformin solution was prepared by mixing 150g of sodium carbonate 175
with 250mL water and 100g of calcium hypochlorite with 750mL water. These solutions are then combined to 176
form a 1L sodium carbonate – calcium hypochlorite solution and then continually stirred over the course of 3-177
4 hours. 150g of sodium hydroxide was added to 1L of water before combining with sodium carbonate to create 178
a concentrated calcium hypochlorite solution. The antiformin solution diluted 1:8 with water was slowly heated 179
to approximately 85°C and the rib samples placed in for approximately 3 minutes with constant monitoring. The 180
samples were then removed and rinsed thoroughly in warm water removing any remaining soft tissue with a 181
sponge. Degreasing was done by simmering the samples in a 50% ammonia solution for approximately 4 hours. 182
They were then left to air dry for 24 hours before being placed in a 1-3% hydrogen peroxide solution for 183
approximately 1 hour to allow slight whitening and preservation. The samples were left to air dry for 2-3 days 184
and the labels were replaced with ink labels written on the bone surface. An example of two ribs defleshed with 185
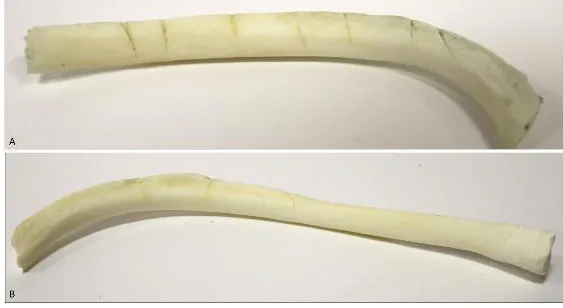
the toolmarks produced by Knife 4 [Fig. 9A.] and 8 [Fig. 9B]. is shown below. Four samples were damaged due 186
to experimenter error in the form of prolonged exposure to the antiformin solution and were therefore 187
removed from further analysis. The 42-remaining ribs contained 132 cuts marks of varying types. 188
[image:10.595.155.437.479.633.2]189
Fig. 9. Defleshed pig rib from experiment 2 with A) 7 cut marks made by knife 4; and B) 3 marks made by knife 8
2.5
Imaging
1912.5.1 Micro-CT Imaging 192
Using a Nikon XT H 320LC Micro-CT scanner, each rib was scanned individually with resolutions between 10-193
30μm. Scanning parameters were 90kV, 6W, 2 second exposure, no filter and 6-14 magnification resulting in 194
scan times around 3 hours per rib. The data were reconstructed using Nikon’s Proprietary software, CT Pro and 195
then exported to VGStudio Max for toolmark measurements [Fig. 10.] using the same process documented in 196
Thornby et al [66]. The toolmark properties [Fig. 2.] were then measured in VGStudio Max. 197
All 14 incisions from Experiment 1 were scanned. In experiment 2, cleft (15 marks) and puncture (19 marks) 198
marks were filtered out prior to imaging. As micro-CT scanning is time consuming (approximately 3 hours per 199
scan) and expensive, an a-prior decision was made to only scan ribs containing 2 or more toolmarks. The total 200
number of marks micro-CT scanned in experiment 2 was 64, with 33 created by serrated knives and 31 by plain 201
knives. The number of cut marks micro-CT scanned at the individual knife level was; 0, 3, 7, 23, 8, 11, 8, 4 for 202
Knives 1-9 respectively. In total, 64 incisions were scanned in Experiment 2. Each knife blade was also scanned 203
(parameters 225kV, 17W, 1.4 second exposure, 1mm copper filter and 1-10 magnification) before being 204
reconstructed and exported as surface files. 205
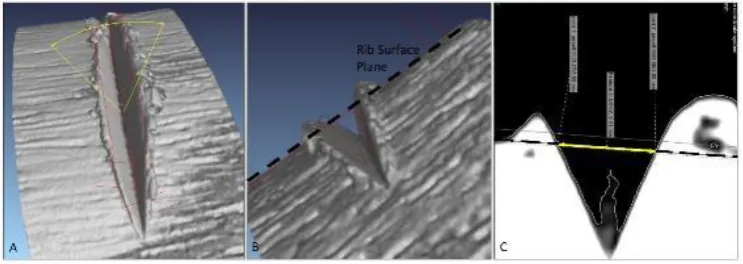
[image:11.595.112.484.396.528.2]206
Fig. 10. Example of virtual measurement of cut mark micromorphological on V shaped micro-CT scanned cut
207
mark. A) Wall angle measurement; B) Width measurements; C) 2D view cross section of width measurement
208
209
2.5.2 Optical Laser Scanning 210
Following pilot work by Sansoni et al (2009) [36], we assessed the effectiveness of optical laser scanning for 211
toolmark analysis. A Nikon K6 10 Series manual measurement arm was used to scan all 14 cut marks from 212
Experiment 1. The ribs were lightly clamped and scanned at approximately 120μm, creating point cloud data 213
that was exported to Geomagic Studio as 3D polygon data. However, it was difficult to capture the visible cut 214
mark interior and often resulted in incomplete mesh surface data unsuitable for further analysis. No additional 215
analysis or laser scanning was performed. 216
2.5.3 Scanning Electron Microscopy 218
Eight serrated cut marks and eight plain cut marks were randomly selected from ribs that were filtered out from 219
micro-CT scanning due to only having a single cut mark per rib. To separate cut mark walls, the ribs were 220
carefully sawn from the underside of the cut mark to the cut mark floor. One was completely sawn through and 221
SEM imaged providing baseline saw striations [23]. Following the separation of the walls, samples were cut to 222
size, fixed to metal studs with a silver paint, gold sputtered and then imaged in a Sigma SEM machine (lateral 223
spatial resolutions ≈3µm). 224
2.5.5 Light Microscopy 225
Consistent qualitative assessment of knife toolmark across forensic practitioners is desired when categorising 226
toolmark shape. The levels of agreement, measured as inter-observer reliability, between 10 participants for 227
the categorisation of toolmark shape was compared between micro-CT and light microscopy. A Nikon SMZ 745T 228
microscope, captured images of the cut marks in experiment 2 to compare cut mark shape classification 229
objectivity with micro-CT images. 10 participants (aged 18-43, 4 females) from the university with no prior 230
knowledge of toolmark analysis classified images of cut mark shapes based on micro-CT cross-sections images 231
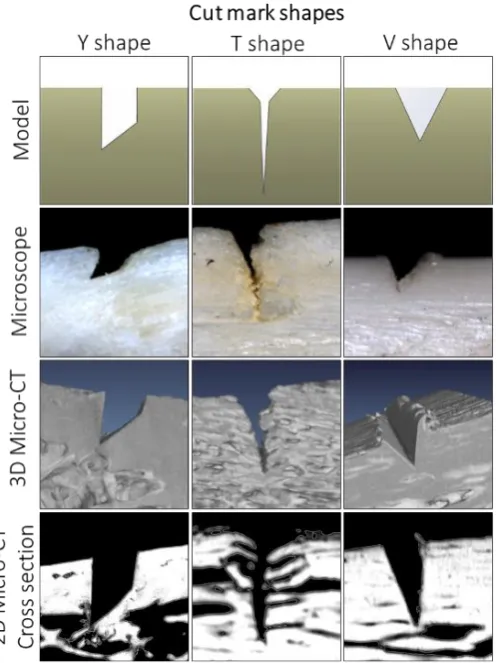
and microscope images [Fig. 11.]. Participants completed a questionnaire which included examples of pre-232
classified cut mark shapes as training before judging 20 paired microscope and micro-CT cut marks shapes, 233
presented in a random order, as either ‘V’, ‘Y’, ‘T’, ‘neither’ or ‘unsure’. Interobserver agreement was assessed 234
using; Fliess’s Kappa, Krippendorff’s alpha and average pairwise % agreement. Criteria for ‘good’ agreement in 235
237
Fig. 11. Example cut mark shapes Y, T and V presented as idealised model, microscope image, 3D micro-CT image
238
and 2D micro-CT cross section. Images like the ones above were given separately to participants to classify the
239
cut mark shape as either V, T, Y, ‘neither’ or ‘unsure’ 240
2.5.6 Model Fusion and Visualisation 241
Medical grade CT, micro-CT, laser scanning and photographs from experiment 2 were used to develop 3D 242
models that facilitated data storage and processing, visualisation, 3D printing and virtual analysis. The Medical 243
CT 3D data provided relatively low resolution models (300µm) providing anatomical context for individual 244
micro-CT scanned models. High resolution micro-CT surface data of bone was extracted using the method 245
described by Norman et al (2014) and was used to combine the micro-CT and medical CT data [73-74]. Key 246
regions of interest e.g. cut marks or the acutal knife blades, were kept at full resolution (≈30µm) whilst 247
contextual information was reduced in fidelity enabling file size reduction from approximately 40GB to 248
approximately 40Mb. This stage is crucial to allow fusion of all the micro-CT scanned ribs with the medical CT 249
scanned torso as without it the file size would be too great to handle in Geomagic Studio (a 3D mesh software) 250
with currently available systems. The knife blade scans were imported in Geomagic Studio in as free floating 251
models. Digitial photos of the ribs and knives were taken to capture all avaliable surface detail. These photos 252
were mapped onto the micro-CT rib models using ‘Texture Mapping’ in Geomagic Studio producing high
253
resolution coloured surface models that facilitated data storage/processing, visualisation, 3D printing and 254
3.0
RESULTS
2563.1
Toolmark Analysis
257
3.1.1 Knife type differences 258
In Experiment 1, 14 toolmarks were mechanically created on dry pig bone using one serrated and one plain 259
edged blade. The authors noted that quantitively and quantitatively these mechanically made toolmarks were 260
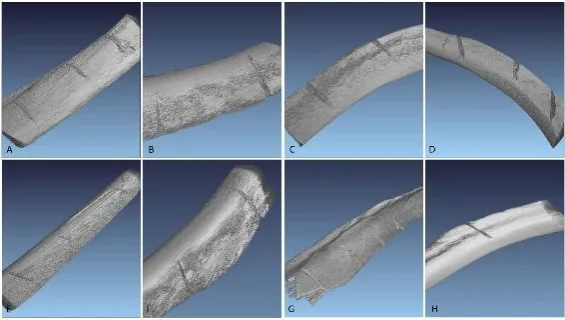
very uniform and clean [Fig. 12.]. In experiment 2, 64 incision marks were micro-CT scanned for analysis and 261
these were notably more variable both within and between individual knives [Fig. 13.].
262
[image:14.595.158.436.223.383.2]263
Fig. 12. Experiment 1 Micro-CT image of: A) Four cut marks from a serrated Knife, (knife 4); B) Five cut marks
264
from by a plain Knife (knife 5); C) 2D cross section of ideal Y shaped cut mark from serrated Knife; D) 3D Y shaped
265
cut mark from serrated blade; E) 2D cross section of ideal V shaped cut mark from a plain blade and F) 3D top
266
down view of cut mark from a plain knife
267 268
269
Fig. 13. Experiment 2 Micro-CT images of: A) Three cut marks made by Knife 1; B) Two cut marks made by Knife
270
2; C) Two cut marks made by Knife 3; D) Four cut marks made by Knife 4; E) Four cut marks made by Knife 6; F)
271
Two cut marks made by Knife 7; G) Four cut marks made by Knife 8; H) A cut mark made by Knife 9.
272
To assess whether the two knife types in this study produced significantly different toolmarks, two one-way 273
multivariate analyses were conducted using the toolmark properties measured from the micro-CT for both 274
experiment 1 [Table 2] and experiment 2 [Table 3]. The one-way multivariate analysis results from experiment 275
1 and 2 suggest that in our sample of knives, the serrated blades produced significantly different cut mark micro-276
[image:14.595.156.439.450.610.2]Experiment 2 is also provided to illustrate these the differences [Fig. 14.]. For the purpose of statistical analysis, 278
we considered each cut mark to be independent any other cut mark irrespective of knife, volunteer, stab 279
trajectory and pig torso. 280
281
Finally, we determined whether the generated cut mark shapes could be used to discriminate between serrated 282
and plain knives. The shape of all cut marks were classified as either ‘Y’, ‘T’, ‘V’ or ‘unsure’ [Fig. 2.] by the first 283
author and compared with the identity of the knife that produced them. In Experiment 1 all knife marks 284
categorised as Y shaped were generated from by the serrated knives and all those categorised as V shaped were 285
generated by plain knives. In experiment 2, 94% of V shaped cut marks were made by plain blades, 100% of Y 286
shaped cut marks were created by serrated blades and T cut mark shapes were shared by 54% of plain blades 287
and 46% of serrated blades. 288
[image:15.595.57.553.395.456.2]289
Table. 2.
Experiment 1: Mean Toolmark properties for blade type (Data are expressed as mean ± standard deviation) and one-way multivariate ANOVA results. Independent variable was blade type (Serrated or Plain) and dependant variable were the toolmark properties (Width, Wall angle and Floor Radii). Combine dependants:
F(3,10)=19.134, p <0.001
Cut Mark Properties Serrated Blade Plain Blade Statistical Results Width (mm) 1.07 ± 0.33 0.64 ± 0.14 F(1,12)=62.48, p <0.001 Wall angle (°) 42.1 ± 2.8 50.1 ± 6.7 F(1,12)=8.62, p <0.05 Floor radii (mm) 0.034 ± 0.005 0.031 ± 0.16 F(1,12)=0.21, p =0.66
Assumptions: There were no univariate outliers in the data, as assessed by inspection of boxplots. Preliminary assumption checking revealed that the data were not normally distributed, as indicated by Shapiro-Wilk test, there were no univariate or multivariate outliers, as assessed by boxplot and Mahalanobis distance, respectively; there were linear relationships (except for floor radius), as assessed by scatterplot, no multicollinearity; and there was homogeneity of variance-covariance matrices, as assessed by Box's M test. Given that the one-way MANOVA is fairly robust to deviations from normality no corrections were performed. There was homogeneity of variance-covariances matrices, as assessed by Box's test of equality of covariance matrices.
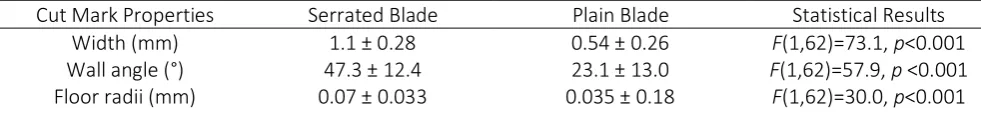
Table. 3.
Experiment 2: Mean Toolmark properties for blade type (Data are expressed as mean ± standard deviation) and one-way multivariate ANOVA results. Independent variable was blade type (Serrated or Plain) and dependant variable were the toolmark properties (Width, Wall angle and Floor Radii). Combine dependants:
F(3,60)=33.5, p<0.001
Cut Mark Properties Serrated Blade Plain Blade Statistical Results Width (mm) 1.1 ± 0.28 0.54 ± 0.26 F(1,62)=73.1, p<0.001 Wall angle (°) 47.3 ± 12.4 23.1 ± 13.0 F(1,62)=57.9, p <0.001 Floor radii (mm) 0.07 ± 0.033 0.035 ± 0.18 F(1,62)=30.0, p<0.001
[image:15.595.55.546.625.685.2]291
Fig. 14.Normalised boxplots of cut mark micro-morphology (width, wall angle and floor radius) for knife types
292
plain and serrated (serrated in grey) measured in Experiment 2.
293
294
3.1.2 Knife Prediction 295
A Binomial Logistic Regression was conducted to determine the predictive value of combining toolmark 296
properties to classify knife type, serrated or plain. The model accounted for 78% of the variance in knife type 297
and correctly classified 94% of cases of toolmarks. [Table 4]. 298
To examine the predictive power of toolmark properties for estimating knife blade properties and stab 299
mechanics, four Pearson's product-moment correlations were run to assess the relationship between: 1) knife 300
edge thickness and cut mark width, 2) floor radius and knife edge angle (sharpness), 3) serrated angle and 301
serrate blade edge angle, and 4) knife impact trajectory and cut mark face angle [Table 5]. The results showed 302
there was a; 1) large positive significant correlation between knife thickness and cut mark width [Fig. 15.],2) 303
medium significant correlation between knife edge angle and floor radius [Fig. 16.], 3) no significant correlation 304
between serrated angle and serrate blade edge angle and 4) large positive significant correlation between cut 305
mark face angle and knife impact trajectory [Fig. 17.]. 306
Three preliminary linear regressions models revealed that with 95% confidence; 1) 92% of the cut mark widths 307
could be explained by knife edge thickness, 2) 98% of the cut marks floor radii could be explained by knife edge 308
310
[image:17.595.53.542.189.279.2]311
Table 5:
Pearson's product-moment correlations and Linear Regression Models to explore the predictive power of toolmark properties for estimating knife blade properties and stab mechanics
Toolmark Property
Tool or Stab Property Pearson correlations Toolmark Variance explain
Prediction Equationσ Linear Regression Fit
% of marks predicted
at 95% confidence
Width Knife Edge Thickness
r(64)=0.78,
p<0.001 α 61%μ
Knife Edge Thickness (mm) = 0.20mm + 0.58mm * Cut Mark
Width mm
F(1,62)=96.8,
p <0.001 92%
Floor Radius
Knife Edge Angle
r(64)=0.33,
p <0.01 α 11%θ
Knife Edge Angle (°) = 36° + 90° * Cut Mark
Floor Radius°
F(1,62)=7.5, p
<0.01 98%
Serrated Angle
Serrate Blade Edge Angle
r(64)=-0.18,
p = 0.32 α - - - -
Face Angle
Knife Impact Trajectory
r(33)=0.69,
p<0.001 β 47% μ
Knife Impact Trajectory (°) = 23° + 0.84° * Face
Angle°
F(1,31)=27.9,
p<0.0005 97%
Assumptions for two Pearson's product-moment correlations:
α Preliminary analyses showed that the relationships were approximately linear and had no outliers. However, with the exception of width and serrated angle, variables were not normally distributed, as assessed by Shapiro-Wilk's test. Given Pearson’s correlation is
relatively robust to data that is not normally distributed no corrections were performed.
β Preliminary analyses showed the relationships were linear with face angle being normally distributed, as assessed by Shapiro-Wilk's test, and there were no outliers. Given that stab impact trajectories were either overhead or underarm it was unsurprising that trajectory was not normally distributed however as before no corrections were performed.
σ All assumptions for preliminary linear regression: Visual inspection of these two plots indicated a linear relationship between the variables and there was homoscedasticity and normality of the residuals.
[image:17.595.56.551.416.633.2]μ Large size effect according to Cohen (1988) θ Medium size effect according to Cohen (1988)
Table. 4.
Binomial Logistic Regression values predicting likelihood of Knife type based on cut mark width, wall angle and floor radius. The model was statistically significant, χ2(3)=56.32, p<0.001 explaining 78% (Nagelkerke R2)
of the variance in knife type and correctly classified 94% of cases. Serrated Blade Sensitivity = 94%, specificity = 94%, positive predictive value = 94% and negative predictive value = 94%.
95% C.I. for Odds Ratio
B SE Wald df p Odds Ratio Lower Upper
Width 4.71 1.86 6.45 1 0.011 111.5 2.935 4236
Floor radius 37.69 21.37 3.11 1 0.078 2.3 x 10¹⁶ 0.015 3.6 x 1034
Wall angle 0.07 0.03 4.38 1 0.036 1.0 1.0 1.1
Constant -8.08 1.98 16.63 1 0.000 0.000
312
Fig. 15.Scatterplot of Knife Edge Thickness (mm) of Knives 1-4, 6-9 used in Experiment 2, against cut mark width
313
(mm) of cut mark created in Experiment 2. The solid line shows the linear regression fit with R2 of 0.61 and 314
equation y = 0.58x + 0.22. The dashed lines represent the individual confidence intervals at each prediction of
315
the linear regression equation.
316
[image:18.595.204.392.305.469.2]317
Fig. 16.Scatterplot of Knife Edge Angle / Sharpness (degrees) of Knives 1-4, 6-9 used in Experiment 2, against
318
cut mark floor radius (degrees) of cut mark created in Experiment 2. The solid line shows the linear regression fit
319
with R2 of 0.11 and equation y = 90x + 36. The dashed lines represent the individual confidence intervals at each 320
prediction of the linear regression equation.
321
322
Fig. 17. Scatterplot of Knife impact trajectory (degrees) of Knives 1-4, 6-9 used in Experiment 2, against cut mark
323
face angle (degrees) of cut mark created in Experiment 2. The solid line shows the linear regression fit with R2 of 324
0.23 and equation y = 0.84x + 23. The dashed lines represent the individual confidence intervals at each
325
prediction of the linear regression equation.
[image:18.595.204.389.538.701.2]3.2
Knife Mark Shape Inter-rater Reliability
327Three Inter-observer reliability tests for classification of cut mark shapes from micro-CT and microscope were 328
computed. Fliess’s Kappa (κ), Krippendorff’s alpha (α) and average pairwise % agreement (%) were run to
329
determine if there was agreement between the 10 trained non-forensic experts on which cut mark shape (V, T, 330
Y, ‘neither’ or ‘unsure’) 20 pairs micro-CT and microscope cut marks were. For micro-CT images, there was good 331
agreement between the 10 participants for all tests, (κ=0.85, p<0.005), (α=0.79, p<0.005) and (%=85, p<0.005). 332
However, for microscope images there was poor agreement between the 10 participants for all tests (κ=0.65,
333
p<.0005), (α=0.52, p<0.005) and (%=64, p<0.005). 334
3.3
Knife Mark Striations with SEM
335
Striations were only visible on 11 cut mark walls across 7 cut marks. Two examples (1-2) from plain non-serrated 336
blades and two example (3-4) from serrated blades are shown below [Fig. 18.]. In line with observations of 337
striations in the literature, striations produced by serrated blades are larger and more spaced than those from 338
non-serrated blades which are much finer and closer together [Fig. 18.]. 339
[image:19.595.169.427.368.565.2]340
Fig. 18. SEM images of cut mark wall striation marks from plain blades, (Example 1 from Knife 6 and Example 2
341
from Knife 7) and from serrated blades (Example 3 from Knife 3 and Example 4 from Knife 4)
342
343
3.4
Model Fusion and Visualisation
344
Medical grade CT, micro-CT and photography were all be combined to create high resolution colour accurate 345
3D models that could be used for data storage facilitate data storage/processing, visualisation, 3D printing and 346
virtual forensic exploration [Fig. 19.]. Although toolmarks were visible in the medical-CT scans, further 347
349
Fig. 19. Model fusion process combining medical CT scans, micro-CT scans and digital photography for data
350
storage, visualisation, 3D printing and virtual analysis. From the top, the pig torso [A1] which was medical CT
351
scanned [A2] and exported as a 3D model [A3] and colour rendered [A4] providing an initial whole sample
352
medical CT scan which included the soft and hard tissue. The micro-CT rib models could then be aligned to this
353
anatomically accurate model. The defleshed ribs which were photographed [B1] were micro-CT scanned [B2] 354
and exported as high-resolution 3D models [B3]. The rib photographs were then mapped onto the 3D models
355
[B4] before the micro-CT models were aligned and fixed in anatomical position on the medical CT-based model
356
[D1 & D2]. The physical knives [C1] were also photographed and micro-CT scanned [C2] and exported as 3D
357
models [C3] to create photo realistic high-resolution models [C4]. These geometrically accurate knives were
358
brought into the 3D environment with the pig torso and knife and toolmarks were matched [D3]. With the full
359
fused model and knives, the knife trajectory could be estimated [D4] and impact site determined [D5] which can
360
be valuable information to forensic investigators. Once knife and toolmark surfaces are aligned, surface
361
comparison/best fit algorithms can be run to determine the percentage match. Although not the remit of this
362
work, an example of this is shown with green indicating good surface match [D6]. Finally, a virtual section (Ribs
363
4-11) of the combined 3D micro-CT model was prepared for 3D printing [E1] Note that the spine was replaced
364
by a solid cylinder for structural stability and the knife used to create the printed knife marks was also printed
365
[E2]. The corresponding knife was printed to illustrate an example of where the knife left marks on both the
366
underside of the rib and on the cut mark thereby allowing a physical approximation of stab trajectory to be
367
visualised [E3]. The resolution of the 3D printer allowed for very detailed recreation of the toolmark [E4] making
368
4.0. DISCUSSION
370The current study had three primary aims. First, to compare toolmarks created in two contrasting experimental 371
set ups; one highly controlled and the other a real-world simulated stabbing [Section 4.1]. Second, to evaluate 372
and compare a range of imaging and 3D visualisation methods to identify and measure toolmark properties 373
[Section 4.2]. Third, to statistically explore toolmark properties measured to determine whether they could be 374
used to infer knife type or knife properties such as blade edge width [Section 4.3]. 375
376
4.1. Toolmark Creation 377
In Experiment 1 14 cut marks were produced on dry ribs using a mechanical drop tower. This method was 378
relatively simple, fast and allowed control of the force and location of each knife impact on the bone. It was 379
clear that the cut marks produced by this method were very consistent in size and shape and this can be seen 380
above [Fig. 12. & Fig. 13.]. Cut marks created by the two knife types were very distinct both qualitatively and 381
quantitative displaying almost textbook examples of idealised V and Y shapes produced by the two blades. 382
However, the authors suggest that extrapolating results from these idealised toolmarks is unlikely to be useful. 383
384
In Experiment 2, 64 toolmarks were generated under more real-world conditions using human agents and pig 385
torsos. The cut marks were very different to those created in Experiment 1 where a mechanical drop rig was 386
used. Cut marks in Experiment 2 were more variable in size and shape even when created with the same knife 387
- this is in line with Ferllini’s (2012) [23] simulated real-world study. However, this more ecologically valid 388
method was notably more time consuming in both set up and bone extraction and resulted in substantial data 389
attrition. Initially 320 cut marks were planned with the expectation that some of these would be lost or not be 390
appropriate for analysis (such as cleft or puncture marks). However, knife breakages and defleshing errors 391
resulted in a useable set of 132 cut marks across 42 ribs. After filtering out cleft and puncture marks, 64 incision 392
cut mark were eventually micro-CT scanned with an additional 16 undergoing destructive SEM imaging. This 393
attrition of data throughout the process demonstrates one difficulty of conducting this type of research. 394
Nevertheless, the resulting toolmarks do allow for more ecologically valid and generalisable findings. 395
396
Care was taken in Experiment 2 to simulate as many factors relevant to real world stabbings as possible. For 397
example, the knives sourced were representative of the typical knives carried by the public on the streets of the 398
UK. Hunt and Cowling (1991) reported that 55% of fatal stabbings were committed using a kitchen knife and 399
26% with a folding knife [77]. Sharp force trauma studies typically create cut marks from 2-3 newly purchased 400
kitchen knives which typically have fewer edge defects [23, 25-28]. The current study used knifes confiscated 401
from the public as catalogued by the Physical Protection Group of the Metropolitan Police, UK [52]. [Fig. 3.]. 402
Volunteers were relatively free to stab anywhere on the sample thereby allowing natural stabbing mechanics 404
and both overhead and underarm stab motions were used. However, the skin tension of the pig torsos as a 405
results of multiple stabs would have likely influenced the penetrating force of the knife and therefore cut marks 406
created later may have been different to those made at the start. Nevertheless, it is worth considering however 407
that fatal stabbings usually involve more than one puncture of the skin. Of course, better simulation could have 408
been achieved using human samples rather than pig although this comes with its own practical and ethical 409
concerns and on balance, human tissue was not required for this study. 410
411
4.2. Imaging Methods 412
Micro-CT was an effective imaging method for capturing and visualising knife toolmarks. These observations 413
were consistent with the previous literature and it was concluded that quantitative measures of toolmark 414
geometry would be possible with micro-CT as demonstrated. Objective measurements of each toolmark 415
property described [Fig. 2.] were obtained easily (e.g., typically less than 30 second per measurement) and the 416
authors note that there was little room for interpretation error when measuring these toolmark properties. This 417
supports previous work by Pelletti et al (2017) [10] who demonstrated high inter-rater reliability when 418
measuring saw mark properties with micro-CT. In the present study all three inter-observer reliability tests 419
indicate that agreement for assessing toolmark shape is more reliable when using micro-CT images compared 420
to light microscopy. This is most likely due to the ability to create virtual cross-sections of the toolmarks using 421
micro-CT which allows for clear 2D images of the cut mark shape. Although the observers were only given static 422
2D images of the toolmarks, one might suspect that being able to fully manipulate the view and cross-sections 423
of a micro-CT scanned toolmark would further aid reliability across practitioners when judging toolmark shape. 424
However, it should be noted that although agreement between observers was high when judging toolmark 425
shape, it was never perfect. Unlike the toolmark shapes in Experiment 1 which were very well defined, 426
toolmarks in Experiment 2 were much more variable making quantitative assessments more difficult. Despite 427
micro-CT being able to improve agreement, qualitative assessment of cut mark shape is unlikely to be as 428
effective as quantitative measures such as toolmark width. This point may deserve further exploration given 429
the implication for forensic evidence that incorporates toolmark shape judgement. 430
Unlike previous imaging methods, micro-CT also allowed for the measurement of wall angle and floor radius 431
and allowed for virtual cross sections of cut marks to be generated for shape examination. Wall angle and floor 432
radii were found to be useful properties for distinguishing between knife type and predicting knife properties. 433
Observing and categorising cut mark shape from micro-CT cross sections was trivial, particularly from the set of 434
toolmarks created by the mechanical drop tower. Experiment 2 demonstrated that this was still the case when 435
toolmarks were created under more realistic conditions and statistically tested the level of agreement between 436
Micro-CT also allowed the creation of highly detailed 3D models for merging with other data sets. Samples in 438
this study were defleshed before imaging to allow for other imaging methods, such as SEM and light microscopy, 439
to take place. However, for micro-CT scanning alone this is not necessary as samples can remain intact with 440
tissue during imaging. This can sometimes pose a challenge with physically larger samples as the distance 441
between the emitter and detector are proportional to the spatial resolution of the scan – larger objects result 442
in lower resolutions. The authors recommend where possible resolutions of 50µm or less to achieve optimal 443
detail within the toolmark. Recent advances in micro-CT technology make it possible to obtain resolutions below 444
one micronmeter as well as perform ‘local zooming’ with larger samples. This is particularly useful for toolmarks 445
on long bones as significantly greater resolution can be achieved. Micro-CT scans take around 2-4 hours each 446
depending on the scanning parameters - in the present study this equated to weeks of scanning. Studies with a 447
greater number of toolmarks may wish to consider batch scanning multiple samples to reduce the resource 448
required. In live forensic cases it has become clear to the authors that decisions regarding what should be 449
scanned are crucial to allow unneccessary scans to be filtered out. Overall, given the clear benefits of micro-CT 450
imaging in forensic cases and the growing number of facilities with this technology avalibale, the authors 451
suggest that further toolmark studies should apply this imaging method. 452
453
We note that wall striations could not be reconstructed from the micro-CT scans most likely due to their fine 454
structure which are smaller than the micro-CT resolutions used (10-30μm). Therefore, Scanning Electron 455
Microscopy was used to determine the presence and diagnostic properties of wall striations for knife mark 456
analysis. However, wall striations were only present in 44% of cut marks and rarely on both cut mark walls 457
limiting their potential use. It is possible that fine striation marks created during knife impact were removed 458
during the chemical defleshing process, however, given that some striation marks were clearly present, this 459
suggestion is difficult to verify without further research. Given the small sample size, no further analysis using 460
these striations was performed. For imaging striation marks, SEM was clearly superior to micro-CT and therefore 461
could act as a complimentary analysis method. Imaging of striations has primarily been done in saw mark 462
analysis where toolmarks are wider. As cut mark widths from knives are smaller SEM can only be used to image 463
wall striations if the cut mark is separated and hence destroyed. Such destructive testing of potential evidence 464
is often undesirable and given striation were not always visible, we support using this technique in forensic 465
cases only as a last resort. 466
467
Initial work by Sansoni et al (2009) [36] suggested that laser scanning could be a useful tool for toolmark analysis 468
of saw and knife marks. Findings from Experiment 1 cannot speak to the appropriateness of laser scanning for 469
saw mark analysis, they do suggest that laser scanning is not appropriate for knife marks. Upon reviewing 470
This larger width and smoothness was not observed in our experiment and may explain why laser scanning was 472
much less optimal compare to previous studies. If knife mark width can sometimes pose restrictions on when 473
laser scanning can be used optimally, the authors suggest it may be limited for knife mark analysis. Although 474
laser scanning is clearly a useful method for other forensic applications, the authors do not recommend it for 475
knife mark analysis as many toolmark properties will unlikely be captured. 476
477
4.3. Toolmark Analysis 478
This study employed a variety of statistical tests appropriate for exploring the diagnostic value of quantitative 479
toolmark properties for the determination of knife type. To summaries: i) Knife type (serrated or plain) had a 480
statistically significant effect of cut mark width, wall angle, floor radius and shape. ii) Knife type can be correctly 481
estimated from cut mark width and floor radius. However, unlike cut mark width and floor radius, wall angle 482
does not provide significant predictive power for determining knife type. iii) Knife edge thickness is highly 483
correlated with cut mark width and this relationship can be used to estimate knife edge thickness. Floor radius 484
however does not significantly correlate with knife edge angle (sharpness). iv) Knife impact trajectory is highly 485
correlated with cut mark face angle and this relationship can then be used to estimate knife impact trajectory. 486
All together this suggests that toolmark properties, when measured from micro-CT, can be a powerful forensic 487
method for estimating knife type and properties as well as the trajectory used at knife impact. 488
489
Clearly statistical exploration of the quantitative toolmark properties obtained from micro-CT scans of the 490
toolmarks shows promise. Cut mark width, shape, wall angle and floor radius, the latter being a new toolmark 491
property suggested in this study, were all diagnositic properties of blade serration. In line with previous 492
literature however, cut mark width still appears to be the most diagnositic property when investigating at the 493
knife type level (serrated or plain) with wall angle also significantly contributing. However, as experiment 2 494
resulted in a small sample of cut marks per individual knife (Knife 1 = 0 marks, Knife 2 = 3 marks, Knife 3 = 7, 495
Knife 4 = 23, Knife 6 = 8, Knife 7 = 11, Knife 8 = 8, Knife 9 = 4) it was not appropriate in the present study to 496
statistically explore individual knife differences. This is something that will need addressing in further work that 497
attempts to assess knife toolmark diagnosticity. Finally, the authors recommend applying the quantitative and 498
statistical methods presented here to the analysis of micro-CT saw marks. 499
5.0
CONCLUSIONS
501To our knowledge, this is the first study to investigate the potential of using micro-CT to facilitate quantitative 502
statistical analysis of knife toolmarks in bone. The current study aimed to evaluate a range of toolmark analysis 503
imaging methods and determine whether these methods can identify toolmark properties that allow for the 504
statistical determination of knife type from toolmarks made on bone during a simulated stabbing. Although the 505
authors consider this study to have a small sample size, it builds on initial work into quantitative toolmark 506
analysis of knife marks with a focus on micro-CT as the imaging tool. Micro-CT is an effective 3D non-destructive 507
method for visualizing and extracting useful toolmark properties whilst also providing additional information 508
compared to microscopy. Micro-CT data can also be fused with other imaging methods such as medical CT or 509
photography to generate high fidelity 3D models that allow for visualisation, 3D printing and forensic 510
exploration. We found that inter-observer reliability when judging cut mark shape from micro-CT is good and 511
higher than that obtained with light microscopy data suggesting that micro-CT allows for more consistent 512
qualitative toolmark classification. Unlike micro-CT, SEM can reveal bony striation marks on the wall of knife 513
toolmarks which can be used to infer blade serration, however in this sample, striations were not present in all 514
of the samples. Quantitative toolmark analysis from micro-CT data can reveal statistical relationships between 515
toolmarks and be used to estimate the knives used to create them. Specifically, knife type can be correctly 516
determined from cut mark width and wall angle. Knife edge thickness was correlated to cut mark width and 517
therefore cut mark width can be used to estimate knife edge thickness. Knife impact trajectory was correlated 518
to cut mark face angle and therefore face angle can be used to estimate knife impact trajectory. Finally, knife 519
toolmarks created by mechanical means on dry pig bones differed qualitatively from those created under more 520
real-world conditions and therefore further toolmark analysis work is needed with more real-world conditions. 521
Follow up studies should take quantitative approaches to toolmark analysis and we suggest micro-CT as an 522
REFERENCES
524
1 United Nations Office on Drugs and Crime. (2011). 2011 Global Study on Homicide: Trends, Contexts, Data (Global Study on Homicide: trends, Contexts, Data, 2011.). United Nations Office on Drugs and Crime.
2 Chaplin, R, Flatley, J and Smith, K. (2011) Findings from the British Crime Survey and police recorded crime (Second Edition) Crime in England and Wales 2010/11. London: Home Office.
3 Black, S., & Ferguson, E. (Eds.). (2016). Forensic anthropology: 2000 to 2010. CRC Press.
4
Murdock, J. J., Cavallo, J., Kreiser, J., Meyers, C., Morris, B., Sibert, B., ... & Warniment, D. (1990). Theory
of identification, range of striae comparison reports and modified glossary definitions—an AFTE criteria
for identification committee report. AFTE J, 22(3), 275-279.
5 Byers, S. N. Introduction to Forensic Anthropology. Third.
6 Symes, S. A. (2010). Knife and saw toolmark analysis in bone: a manual designed for the examination of criminal mutilation and dismemberment. Mercyhurst College.
7 Saville, P. A., Hainsworth, S. V., & Rutty, G. N. (2007). Cutting crime: the analysis of the “uniqueness” of saw marks on bone. International journal of legal medicine, 121(5), 349-357.
8 Marciniak, S. M. (2009). A preliminary assessment of the identification of saw marks on burned bone. Journal of forensic Sciences, 54(4), 779-785.
9 Pelletti, G., Viel, G., Fais, P., Viero, A., Visentin, S., Miotto, D., Cecchetto, G., & Giraudo, C. (2017).
Micro-computed tomography of false starts produced on bone by different hand-saws. Legal Medicine, 26, 1-5.
10
Pelletti, G., Cecchetto, G., Viero, A., Fais, P., Weber, M., Miotto, D., ... & Giraudo, C. (2017). Accuracy,
precision and inter-rater reliability of micro-CT analysis of false starts on bones. A preliminary validation
study. Legal Medicine, 29, 38-43.
11
Alunni-Perret, V., Muller-Bolla, M., Laugier, J. P., Lupi-Peégurier, L., Bertrand, M. F., Staccini, P., ... &
Quatrehomme, G. (2005). Scanning electron microscopy analysis of experimental bone hacking trauma.
Journal of Forensic Science, 50(4), JFS2003213-6.
12 Tucker BK, Hutchinson DL, Gilliland MFG, Charles TM, Daniel HJ, Wolfe LD. Microscopic characteristics of hacking trauma. Journal of forensic sciences. 2001;46(2):234-40.
13 Lynn KS, Fairgrieve SI. Macroscopic Analysis of Axe and Hatchet Trauma in Fleshed and Defleshed Mammalian Long Bones*. Journal of forensic sciences. 2009;54(4):786-92.
14
Thali, M. J., Taubenreuther, U., Karolczak, M., Braun, M., Brueschweiler, W., Kalender, W. A., & Dirnhofer,
R. (2003). Forensic microradiology: micro-computed tomography (Micro-CT) and analysis of patterned
injuries inside of bone. Journal of forensic sciences, 48(6), 1336-1342.
15 Shaw, K. P., Chung, J. H., Chung, F. C., Tseng, B. Y., Pan, C. H., Yang, K. T., & Yang, C. P. (2011). A method
16
Bolliger, S. A., Thali, M. J., Ross, S., Buck, U., Naether, S., & Vock, P. (2008). Virtual autopsy using imaging:
bridging radiologic and forensic sciences. A review of the Virtopsy and similar projects. European
radiology, 18(2), 273-282.
17
Capuani, C., Rouquette, J., Payré, B., Moscovici, J., Delisle, M. B., Telmon, N., & Guilbeau-Frugier, C. (2013).
Deciphering the elusive nature of sharp bone trauma using epifluorescence macroscopy: a comparison
study multiplexing classical imaging approaches. International journal of legal medicine, 127(1), 169-176.
18 Thompson, T. J. U., & Inglis, J. (2009). Differentiation of serrated and non-serrated blades from stab marks
in bone. International journal of legal medicine, 123(2), 129-135.
19 Bello, S. M., & Soligo, C. (2008). A new method for the quantitative analysis of cutmark
micromorphology. Journal of Archaeological Science, 35(6), 1542-1552.
20
Bartelink, E. J., Wiersema, J. M., & Demaree, R. S. (2001). Quantitative analysis of sharp-force trauma: an
application of scanning electron microscopy in forensic anthropology. Journal of Forensic Science, 46(6),
1288-1293.
21 Love, J. C., Derrick, S. M., Wiersema, J. M., & Peters, C. (2012). Validation of tool mark analysis of cut costal
cartilage. Journal of forensic sciences, 57(2), 306-311.
22 Stępień, P. (2010). Micro-geometrical characteristics of the cutting edge as the intersection of two rough
surfaces. Wear, 269(3), 249-261.
23 Ferllini, R. (2012). Macroscopic and microscopic analysis of knife stab wounds on fleshed and clothed
ribs. Journal of forensic sciences, 57(3), 683-690.
24
Page, M., Taylor, J., & Blenkin, M. (2011). Forensic identification science evidence since Daubert: Part II—
Judicial reasoning in decisions to exclude forensic identification evidence on grounds of reliability. Journal
of forensic sciences, 56(4), 913-917.
25 Bello, S. M., Parfitt, S. A., & Stringer, C. (2009). Quantitative micromorphological analyses of cut marks
produced by ancient and modern handaxes. Journal of Archaeological Science, 36(9), 1869-1880.
26 Tegtmeyer, C. (2012). A comparative analysis of serrated and non-serrated sharp force trauma to
bone (Doctoral dissertation).
27 Boschin, F., & Crezzini, J. (2012). Morphometrical analysis on cut marks using a 3D digital
microscope. International Journal of Osteoarchaeology, 22(5), 549-562.
28 Bailey, J. A., Wang, Y., Van De Goot, F. R., & Gerretsen, R. R. (2011). Statistical analysis of kerf mark
measurements in bone. Forensic science, medicine, and pathology, 7(1), 53-62.
29 Cerutti, E., Magli, F., Porta, D., Gibelli, D., & Cattaneo, C. (2014). Metrical assessment of cutmarks on bone: