© 2019, IRJET | Impact Factor value: 7.211 | ISO 9001:2008 Certified Journal
| Page 4415
Simulation and Experimental Analysis of Blower for Performance
Improvement using Coanda Effect
AKSHAY DESHMUKH
1, AJABE AJIT GAUTAM
2, CHAVHAN ROHAN VINOD
3, MANE SUBODH
4, A. S.
KULKARNI
51,2,3,4
Dept. of Mechanical Engineering, Dr. D.Y Patil Institute of Technology, Maharashtra, India
5
Assistant Professor, Dept. of Mechanical Engineering, Dr. D.Y Patil Institute of Technology, Maharashtra, India
---***---Abstract -Coanda effect has been an interesting topic for research for scientist for years. Coanda effect is the tendency of the fluid to get attached to the adjacent surfaces while the air is flowing is passing along the wall boundary. This phenomenon of Coanda effect is being used in this project to increase the volume flow at the outlet of the blower. This article presents the simulation and experimental analysis of the project for the modification of the blower using Coanda effect. The project was conducted to get improved higher volume flow rate at outlet of the blower and get analysis of Coanda effect for various surfaces. The CATIA software was used to draw 3D model for the simulation and the simulation analysis was conducted in ANSYS FLUENT. The practical analysis was done with help of proper setup and equipments under atmospheric pressure. The result of both simulation and practical are presented in form of graphical representation of pressure, velocity and outlet discharge distribution along the distance below. The motive of the article was to get higher outlet discharge using the principle of Coanda effect and article justifies the use of Coanda effect to get the higher amount of discharge at the outlet of the blower.
Key Words: Coanda Effect, surface adherence, negative pressure, blower discharge, air flow.
1. INTRODUCTION
The Coanda effect is defined as a phenomenon in which fluid jet has the tendency to attach to a curved wall surface. In free surroundings, a jet of fluid enters and mixes with its surroundings as it flows away from a nozzle. When a surface is brought close to the jet, this restricts the entry of jet in that region. A pressure difference across the jet occurs and the jet is deflected closer to the surface eventually attaching to it. Even if the surface is curved far away from the initial direction, the jet tends to remain attached. This result are often accustomed amendment the jet direction. In doing thus, the speed at which the jet is commonly considerably augmented compared therewith of a similar free jet
CAD models for various surfaces were drawn using CATIA software. By using model from the CATIA software simulation of flow of air on different angles of surfaces was performed using ANSYS software.
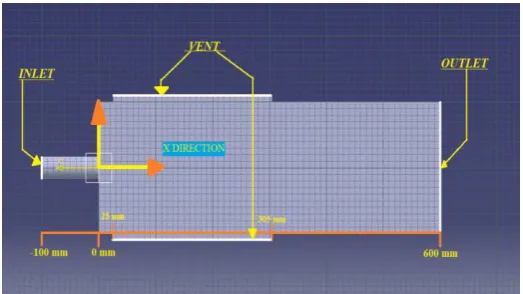
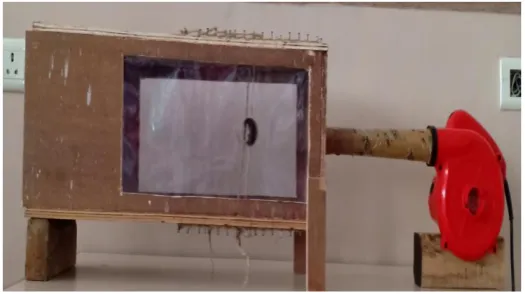
The practical analysis was done with proper equipped instruments. Air flow from the blower was made to pass over different flat surfaces inclined at various standard angles with vents to get the extra air at the outlet. The angles were increased of flat surface, where the flow was passed over upper surface. Due to Coanda Effect, fluid flow adheres along the angled surface resulting in negative pressure near the space. This made air get sucked through the vents from atmosphere. The fluid flow gets added to main stream flow thereby giving more discharge at outlet. Different angles were tested and same procedure was followed for each angle. Different cylindrical surfaces were also tested. For this, both vents top and bottom were open. Here flow along curved cylindrical surface takes place. When cylinder kept centrally aligned to flow of blower the fluid flow was moving out upwards as we increase the diameter of cylinder. As cylinder created obstruction to main stream flow, this deflected flow randomly. Anemometer was used for measuring fluid velocity at different places like blower suction, vents and outlet discharge.
2. LITERATURE REVIEW
© 2019, IRJET | Impact Factor value: 7.211 | ISO 9001:2008 Certified Journal
| Page 4416
made as a means of delaying flow separation and vortexgenerator for improving overall perform.[6] Analysis of air flow about convex wall at different angles velocity, and length were done. Performance of flying vehicle is improved by using numerical formula of Coanda effect. [7]
[image:2.595.301.569.53.234.2]3. SIMULATION
Fig. 3.1 Drafted model
[image:2.595.35.297.184.331.2]3.1 45O angled surface
Fig. 3.2 Velocity streamline for the 45O angled surface
Fig. 3.3 Static Pressure vs. Distance along vent section
Fig 3.4 Velocity Magnitude vs. Distance along vent section
In 45O angled surface case some amount of turbulence is
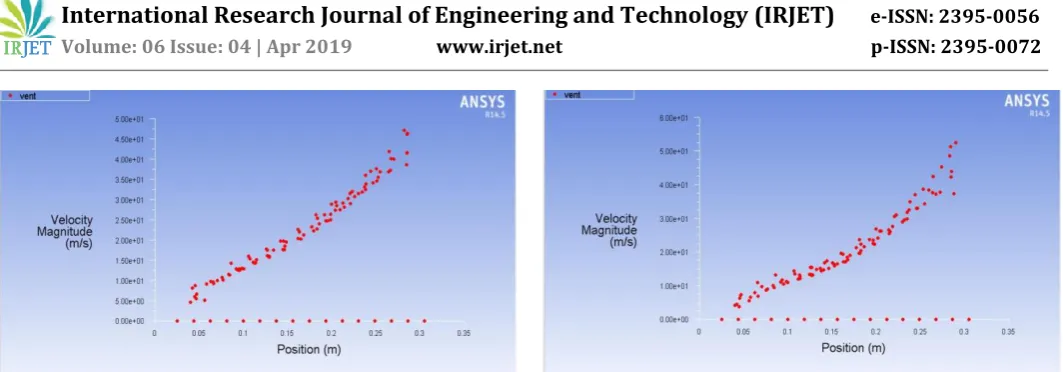
created at the inlet section. It is seen static pressure decreases with increment in x-direction in Fig 3.3. 1.8% pressure drop is absorbed at the vent. Velocity magnitude increases with increase in distance along x-axis as shown in Fig 3.4. The increase in velocity is 8.59%.
[image:2.595.308.569.371.511.2]3.2 60Oangled surface
[image:2.595.35.294.382.532.2]Fig. 3.5 Velocity streamline for the 60Oangled surface
[image:2.595.288.565.543.688.2] [image:2.595.37.292.558.707.2]© 2019, IRJET | Impact Factor value: 7.211 | ISO 9001:2008 Certified Journal
| Page 4417
Fig. 3.7 Velocity Magnitude vs. Distance along vent section
For 60O angled surface, turbulence is created at inlet section
and near the outlet section. The velocity of fluid flow is more in this case. Static pressure decreases gradually at 1.9% with increment along x-axis is shown in Fig 3.6. Velocity magnitude increases with increment along x-axis at 9.39%, shown in Fig 3.7.
[image:3.595.227.551.372.520.2]3.3. 75O angled surface
Fig. 3.8 Velocity streamline for the 75Oangled surface
[image:3.595.39.318.373.520.2]Fig. 3.9 Static Pressure vs. Distance along vent section
Fig. 3.10 Velocity Magnitude vs. Distance along vent section
In 75O angled surface, more turbulence is observed than 45O
and 60O. Static pressure decreases gradually with increment
along x-axis. The pressure drop about the surface is 2.5%, as shown in Fig 3.9. Velocity magnitude increases at 18% slowly, with increment along x-axis is shown in Fig 3.10.
[image:3.595.36.567.549.697.2]3.4 90O angled surface
Fig. 3.11 Velocity streamline for the 90Oangled surface
© 2019, IRJET | Impact Factor value: 7.211 | ISO 9001:2008 Certified Journal
| Page 4418
Fig. 3.13 Velocity Magnitude vs. Distance along vent section
In 90O angled flat surface is available for the adherence to the
flowing fluid so that more negative pressure is created. Static pressure decreases with increment along x-axis at 2.4%, as shown in Fig 3.12. Change of velocity at the vent area has been plotted in Fig 3.13. The velocity increases at 20.77% along the x direction.
4. EXPERIMENTAL SETUP
Sr.
No Parts Name Specification
1 Blower Air Volume = 2.3 m3/min
Power Input=500 W
2 Anemometer Velocity limit= [0.4 - 30 m/sec]
3 Wooden Box Box Dimension [600×200×180]mm
4 Nozzle Circular Hole Diameter [Ø35 mm]
5 Cylindrical
Surface Two cylindrical surfaces 1. Ø35 mm
2. Ø45 mm
6 Flat Surfaces Surface with angles of 450, 600, 750
and 900.
Fixed surface length = 150mm
Movable surface length = 117 mm
Fig, 4.1 Experimental Set-Up with angled flat surface
[image:4.595.307.570.334.481.2]Wooden Box having curved surface of fixed surface length = 150 mm and movable surface length = 117 mm with blower to provide airflow.
Fig. 4.2 Experimental Set-Up with cylindrical surface
Wooden Box having cylindrical surface of diameter (Ø) = 35 mm with blower to provide air flow.
[image:4.595.311.560.562.716.2]5. RESULT AND DISCUSSION
© 2019, IRJET | Impact Factor value: 7.211 | ISO 9001:2008 Certified Journal
| Page 4419
Fig 5.1 represents the plot of interior pressure for all surfaceangles. The surface is providing negative pressure for all the angles. This drop in the pressure is creates suction in the system, resulting in greater outlet discharge.
Fig 5.2 Variationof pressure for all angled surfaces pressure at the vent section
[image:5.595.35.288.147.282.2]The drop in the pressure about the surface is also creating negative pressure at the vent area. Fig 5.1 and Fig 5.2 shows significant pressure drop about the surface.
Fig 5.3 Variation of pressure for all angled surfaces velocity of air at vent section
The vent area suffers drop in the pressure due to suction of air and the velocity of air at the vent increase as it adheres on the surface. This increase in the velocity is observed in both simulation and the practical results.
Fig 5.4 Variation of pressure at interior section for cylindrical surfaces
Fig 5.5 Variation of pressure at vent section for cylindrical surfaces
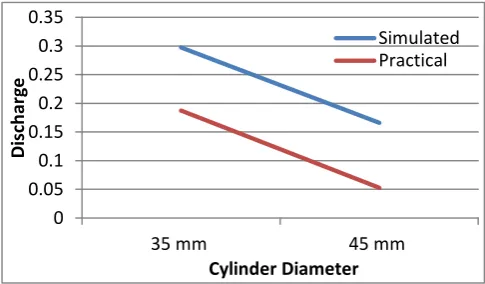
The interior pressure and the pressure at the vent, for both the curved cylinder surface drop about the surface again providing suction pressure for the atmospheric pressure, the plot for both pressure drops is shown in Fig 5.4 and Fig 5.5. But as we increase the diameter of the cylindrical surface the effect was seen decreasing.
0 0.05 0.1 0.15 0.2 0.25 0.3 0.35
35 mm 45 mm
D
isch
ar
ge
Cylinder Diameter
[image:5.595.312.555.370.512.2]Simulated Practical
Fig 5.6 Outlet discharge of cylindrical surface for Simulated vs. Practical
Fig 5.6 shows decrement in outlet discharge with increment in cylinder diameter.
0 0.05 0.1 0.15 0.2 0.25 0.3
45 degree 60 degree 75 degree 90 degree
di
sc
ha
rg
e
Angle
simulated
[image:5.595.37.287.371.500.2]practical
[image:5.595.52.552.595.741.2]© 2019, IRJET | Impact Factor value: 7.211 | ISO 9001:2008 Certified Journal
| Page 4420
As we increase the angle of the surface, the discharge at the [image:6.595.35.289.137.289.2]outlet increases. This is due to adhesion of fluid on the surface, resulting in negative pressure.
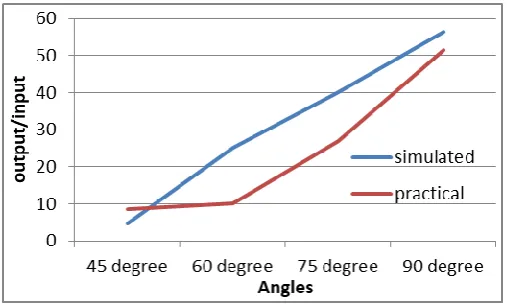
Fig 5.8 Output/Input for all angled surfaces
From Fig.5.8, it is observed that suction created due to adhesion of fluid, increases with increase in angle.
5. CONCLUSION
This study expresses the behavior of the air flow with respect to the surfaces which were analyzed. For the study of curved surfaces two cylindrical surfaces with different diameter and surfaces with different angles were studied. Simulated and the practical analysis were performed to get the behavior of the air profile about all the surfaces. It is observed that increase in the diameter of the cylindrical surface the outlet discharge decreases largely as it starts providing obstruction to the flow. But for the angled surfaces, with increase the angle, the outlet discharge was increased due to much better adhesion of fluid on the surface. Hence the Coanda effect providing greater negative pressure in the system as we increase the angle, thus creates suction at the vents and increasing discharge at outlet.
REFERENCES
[1] Aldona Skotnika – Siepsiak, ― Hysteresis of the Coanda Effect‖, Journal of Fluids Engineering Research, (
March 10, 2017)
[2] Md. RezaurRahman , Department of Mechanical Engineering, Khulna University of Engineering & Technology, Bangladesh , (2018)
[3] Florin Frunzulica, Daniel Crunteanu, ― Directional control of a jet using the Coanda effect, American Institute of Physics, (2016)
[4] Julian Tan Kok Ping, ― Coanda effect test Bench (CoETB) – Design Enhancement of the Coanda craft‖, IEEE University of Malaysia, (Oct-11)
[5] Mirae Kim, Hun Dong Kim , ― Flow characteristics of 3D curved wall jets on Cylinder , Journal of fluid Engineering ( June 2017)
[6] J.M.Lee ,M.Y.Cho, ― Effect of Coanda Nozzle Clearance On The Flow Characteristics Of Air Amplifer, Graduate School Of Mechanical Engineering ,Sungkyunkwan Korea (2016)