Protein kinase N1 critically regulates cerebellar
development and long-term function
Stephanie zur Nedden, … , Gottfried Baier, Gabriele
Baier-Bitterlich
J Clin Invest.
2018;
128(5)
:2076-2088.
https://doi.org/10.1172/JCI96165
.
Increasing evidence suggests that synapse dysfunctions are a major determinant of several
neurodevelopmental and neurodegenerative diseases. Here we identify protein kinase N1
(PKN1) as a novel key player in fine-tuning the balance between axonal outgrowth and
presynaptic differentiation in the parallel fiber–forming (PF-forming) cerebellar granule cells
(Cgcs). Postnatal
Pkn1
–/–animals showed a defective PF–Purkinje cell (PF-PC) synapse
formation. In vitro,
Pkn1
–/–Cgcs exhibited deregulated axonal outgrowth, elevated AKT
phosphorylation, and higher levels of neuronal differentiation-2 (NeuroD2), a transcription
factor preventing presynaptic maturation. Concomitantly,
Pkn1
–/–Cgcs had a reduced
density of presynaptic sites. By inhibiting AKT with MK-2206 and siRNA-mediated
knockdown, we found that AKT hyperactivation is responsible for the elongated axons,
higher NeuroD2 levels, and reduced density of presynaptic specifications in
Pkn1
–/–Cgcs.
In line with our in vitro data,
Pkn1
–/–mice showed AKT hyperactivation, elevated NeuroD2
levels, and reduced expression of PF-PC synaptic markers during stages of PF maturation
in vivo. The long-term effect of
Pkn1
knockout was further seen in cerebellar atrophy and
mild ataxia. In summary, our results demonstrate that PKN1 functions as a developmentally
active gatekeeper of AKT activity, thereby fine-tuning axonal outgrowth and presynaptic
differentiation of Cgcs and subsequently the correct PF-PC synapse formation.
Research Article
Neuroscience
Find the latest version:
Introduction
Protein kinase N1 (PKN1/PRK1) is the most abundantly expressed isoform of the PKN family in the central nervous system and accounts for 0.01% of total brain protein (1). It is widely studied for its involve-ment in cancer (2); however, surprisingly little is known about the brain-specific function of this kinase, even though it was first isolated from human hippocampal cDNA in 1994 (3) and is partic-ularly enriched in certain brain areas (4). In human neurons PKN is mainly localized to juxtanuclear, cytoplasmic, dendroplasmic, and pre- and postsynaptic compartments (5).
PKN1 is a serine/threonine kinase and belongs to the protein kinase C superfamily, sharing a characteristic C-terminal catalytic domain (3, 6) that requires phosphorylation by PDK-1 for activa-tion. The N-terminal regulatory domain confers binding and reg-ulation by RhoA/B/C, Rac1 (7), fatty acids, and phospholipids (8). Activation of PKN1 is also achieved by caspase-3–mediated cleav-age, resulting in a constitutively active protein product missing the regulatory N-terminus (9). This form of deregulated PKN1 activa-tion occurs during apoptosis (10) and has been linked to various
insults to the brain (11–14). We have previously reported that PKN1 is part of a purine-nucleoside signaling cascade involved in the protection of hypoxic neuronal cultures and cell lines in vitro (15, 16). However, despite those in vitro reports and evidence on the generation of a constitutively active fragment, the physiological function of PKN1 in the nervous system in vivo is not yet known.
Using Pkn1–/– animals (17), this work set out to clarify the role of PKN1 in the brain. We focused on the cerebellum, which has a central role in motor control and coordination and is also the brain area with the highest PKN1 expression levels (4). The lengthy pro-cess to achieve cerebellar maturity makes it particularly suscep-tible to developmental abnormalities, which may finally result in neurodegeneration and disabilities such as cerebellar ataxia (18). Two excitatory afferents converge onto Purkinje cells (PCs), the only output neurons of the cerebellum: climbing fibers (CFs) from inferior olivary nuclei, and parallel fibers (PFs) from cerebellar granule cells (Cgcs). A hallmark in cerebellar development is the correct formation of the PF-PC synapse (19), which is important for the segregation of CF and PF territories (20, 21) and cerebellar long-term function (22). PF-PC synaptic dysfunctions have been implicated in models of spinocerebellar ataxias 1, 3, 5, and 27 and Friedreich’s ataxia as well as autism spectrum disorders (19, 23). Considering the high expression levels of PKN1 in Cgcs and PCs (4), we investigated the effect of Pkn1 deletion on the formation of PF-PC as well as CF-PC synapses during cerebellar development.
Our results demonstrate that during cerebellar development PKN1 functions as a gatekeeper of AKT activity and subsequently Increasing evidence suggests that synapse dysfunctions are a major determinant of several neurodevelopmental and
neurodegenerative diseases. Here we identify protein kinase N1 (PKN1) as a novel key player in fine-tuning the balance between axonal outgrowth and presynaptic differentiation in the parallel fiber–forming (PF-forming) cerebellar granule cells (Cgcs). Postnatal Pkn1–/– animals showed a defective PF–Purkinje cell (PF-PC) synapse formation. In vitro, Pkn1–/– Cgcs
exhibited deregulated axonal outgrowth, elevated AKT phosphorylation, and higher levels of neuronal differentiation-2 (NeuroD2), a transcription factor preventing presynaptic maturation. Concomitantly, Pkn1–/– Cgcs had a reduced density of
presynaptic sites. By inhibiting AKT with MK-2206 and siRNA-mediated knockdown, we found that AKT hyperactivation is responsible for the elongated axons, higher NeuroD2 levels, and reduced density of presynaptic specifications in Pkn1–/– Cgcs.
In line with our in vitro data, Pkn1–/– mice showed AKT hyperactivation, elevated NeuroD2 levels, and reduced expression of
PF-PC synaptic markers during stages of PF maturation in vivo. The long-term effect of Pkn1 knockout was further seen in cerebellar atrophy and mild ataxia. In summary, our results demonstrate that PKN1 functions as a developmentally active gatekeeper of AKT activity, thereby fine-tuning axonal outgrowth and presynaptic differentiation of Cgcs and subsequently the correct PF-PC synapse formation.
Biology Laboratory, John Vane Science Centre, Barts Cancer Institute, Queen Mary University of London, London, United Kingdom. 6Francis Crick Institute, London, United Kingdom. 7Division of Cancer
Studies, King’s College London, London, United Kingdom.
Conflict of interest: The authors have declared that no conflict of interest exists. License: This work is licensed under the Creative Commons Attribution 4.0 Inter-national License. To view a copy of this license, visit http://creativecommons.org/ licenses/by/4.0/.
prepared from P13–P15 WT and Pkn1–/– animals. Recordings were performed at room temperature to avoid intrinsic PC firing (25), and therefore ePSCs mainly reflect PF synapse activity (26, 27). Interestingly, Pkn1–/– PCs showed reduced ePSC frequencies (Fig-ure 1E) but similar ePSC amplitudes (Supplemental Fig(Fig-ure 1D), indicating differences in the number of functional synapses but not in presynaptic quantal content or postsynaptic receptors. Like-wise, Pkn1–/– cerebellar slices had a reduced inhibitory PSC (iPSC) input (Supplemental Figure 1E), which might also be caused by a defective PF-ML interneuron synapse formation.
We next tested the expression of the PF-PC synaptic markers cerebellin 1 (Cbln1), a protein excreted by Cgcs and important for PF-PC synapse stabilization (22, 28), and δ2 glutamate receptor (GluD2), the PC postsynaptic receptor binding to extracellular Cbln1 (29). Consistently with a defective PF-PC synapse forma-tion, Cbln1 expression levels were lower in P15 Pkn1–/– cerebella (Figure 1, F and G). GluD2 expression levels were, however, only marginally affected (Figure 1, F and H), suggesting a Cgc-specific defect. We next screened in vitro Cgcs for differences in presynap-tic maturation and axonal outgrowth properties, since the correct balance between axonal growth and presynaptic differentiation is an essential part of synapse formation (30).
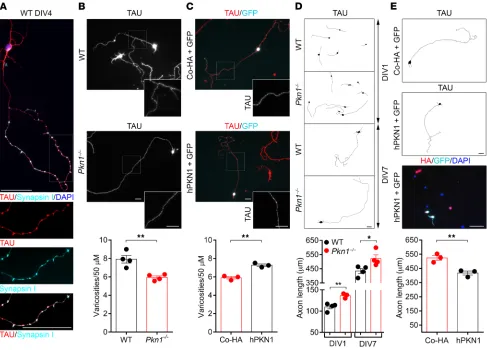
PKN1 regulates axonal outgrowth and the density of presynaptic sites in Cgcs in vitro. We first analyzed mature Cgc cultures (4–7
days in vitro [DIV]) for differences in presynaptic sites, which appear as “en passant swellings” (31) along the axon. These var-icosities show colocalization of TAU and the presynaptic marker synapsin I (Figure 2A). In Pkn1–/– Cgcs transfected with HA-tagged human PKN1 (hPKN1), HA staining was found around the nucleus, in dendrites, and along those en passant swellings of the axon (Sup-plemental Figure 2, A and B). Interestingly, mature Pkn1–/– Cgc cultures had a reduced density of presynaptic sites (Figure 2B), an effect that could be rescued by reintroduction of hPKN1 (Figure 2C). Pkn1 knockout also resulted in deregulated axonal outgrowth, as seen in elongated axons of Pkn1–/– Cgcs throughout the entire culture period (Figure 2D). The enhanced axonal outgrowth was reduced to WT levels in Pkn1–/– Cgcs transfected with hPKN1 (Fig-ure 2E). These results point toward elongated axonal outgrowth at the expense of presynaptic differentiation in Pkn1–/– Cgcs. We therefore next screened Cgc protein extracts for differences in PKN1 downstream signaling molecules involved in presynaptic differentiation and axonal outgrowth.
Pkn1 knockout results in enhanced AKT phosphorylation and NeuroD2 expression in Cgcs in vitro. An important regulator of
axo-nal outgrowth is the protein kinase AKT (32), and PKN1 has been previously suggested to negatively regulate AKT activity (33), for example downstream of the B cell antigen receptor (34). We found that Cgcs from Pkn1–/– mice showed significantly higher endogenous AKT phosphorylation levels at T308 and S473 (Sup-plemental Figure 2C). The mean phospho-AKT (p-AKT) T308 (Figure 3A) and p-AKT S473 (Supplemental Figure 2D) intensity of
Pkn1–/– Cgcs was consistently reduced in hPKN1-transfected cells, but not in GFP-transfected cells (Supplemental Figure 2E), show-ing that the higher AKT phosphorylation was specifically caused by the absence of PKN1. We next tested whether Pkn1 knockout– mediated AKT hyperactivation is the cause of elongated axonal outgrowth, by incubating Cgcs with the potent AKT inhibitor protein levels of the transcription factor neuronal differentiation-2
(NeuroD2), thereby fine-tuning axonal outgrowth and presynaptic differentiation of Cgcs. Accordingly, Pkn1 deletion results in dis-rupted PF-PC synapse formation and defective CF elimination, as seen in a reduced expression of the PF-PC synaptic marker cere-bellin 1 (Cbln1), persistent multiple CF innervation, and reduced spontaneous PC activity. The long-term effect of Pkn1 deletion was further seen in cerebellar atrophy and mild ataxia in adult
Pkn1–/– animals. Despite the rapidly increasing literature on AKT signaling and neurodevelopment, this is, to our knowledge, the first report linking developmental AKT activity with NeuroD2 levels and cerebellar synapse formation, and we identify PKN1 as a regulator of this pathway.
Results
Deletion of Pkn1 leads to a defective PF-PC synapse formation and PC activity. We first analyzed CF growth, as an indicator of a
function-ing PF-PC synapse formation, by stainfunction-ing of cerebellar sections of postnatal day 8 (P8)–P15 WT and Pkn1–/– animals with the CF- specific marker vesicular glutamate transporter 2 (VGlut2) (20). Early during cerebellar development, PC somata are innervated by multiple CFs. From P9 onward a single “winner” CF starts dendritic translocation and expands its territory (20). Perisomatic CF synapse elimination occurs in an early, PF-independent phase (~P7–P11) and a late phase (~P12–P17), which, similar to the prox-imal dendritic restriction of CF innervation, strictly depends on a functioning PF-PC synapse (21). There were no differences between WT and Pkn1–/– animals in VGlut2-stained CF terminals at P8, where they were mainly found around the PC somata (Figure 1, A and B). However, as compared with WT animals, cerebella of P15
Pkn1–/– mice showed an enhanced distal extension of CF terminals into PF territory (Figure 1, A and B) and a defective perisomatic CF elimination (Figure 1, A and C). Western blot analysis further revealed that the ratio of VGlut2 to the PF-specific marker vesicu-lar glutamate transporter 1 (VGlut1) (20) dropped from P8 to P15 in WT animals but stayed the same in Pkn1–/– animals (Supplemental Figure 1A; supplemental material available online with this article; https://doi.org/10.1172/JCI96165DS1), further showing imbal-ances in CF/PF innervation. VGlut1 expression was consistently lower in Pkn1–/– animals during development (Supplemental Figure 1A). Starting at P15, we detected dendritic thickening of Pkn1–/– PCs that coincided with the defective CF growth (Supplemental Fig-ure 1B). At these early developmental stages, those defects did not translate into altered cerebellar morphology of Pkn1–/– mice. WT and Pkn1–/– mice showed a similar cerebellar size, foliation pattern, and thickness of the external granule layer (EGL), internal granule layer (IGL), and molecular layer (ML) (Supplemental Figure 1C).
To reveal potential CF synapse elimination deficits in Pkn1–/– animals, we measured CF-induced excitatory postsynaptic currents (ePSCs) in PCs in acute slices prepared from P15–P17 animals (24). With gradually increasing stimulus intensities, the majority of ePSCs of WT PCs were obtained in an all-or-none fashion, while the majority of ePSCs of Pkn1–/– PCs occurred at 2 or more discrete steps (Figure 1D). This indicates a more frequent occurrence of multiple CF innervation in Pkn1–/– mice.
NeuroD2 levels (Figure 3E). Additionally, we detected enhanced Cbln1 expression upon inhibition of AKT (Supplemental Figure 3C). MK-2206 had similar effects in Pkn1–/– Cgcs (Supplemen-tal Figure 3D). Furthermore, Pkn1–/– Cgcs showed a trend toward reduced Cbln1 levels (Supplemental Figure 3E). To further val-idate those results, we next suppressed AKT expression in order to see whether the observed phenotype of Pkn1–/– Cgcs could be restored to WT levels.
siRNA-mediated knockdown of Akt123 restores axonal length, NeuroD2 expression levels, and the density of presynaptic sites in Pkn1–/– Cgcs to WT levels. WT and Pkn1–/– Cgcs were transfected with siRNAs targeting Akt123 or control nontargeting siRNAs and stained for AKT. Akt123 siRNAs significantly reduced pan-AKT expression at DIV1 and DIV4 (Figure 4A and Supplemental Figure 4, A and B). The concentration of Akt siRNAs was chosen to accomplish a significant decrease in AKT without adverse effect on cell viability. Knockdown of Akt123 significantly reduced the enhanced axonal length of Pkn1–/– Cgcs at DIV1 (Figure 4B). Sim-MK-2206 (Supplemental Figure 3A). Sim-MK-2206 reduced the axonal
length of Pkn1–/– Cgcs to WT levels (Figure 3B), establishing PKN1 as a regulator of axonal length upstream of AKT.
Interestingly, we found that mature Pkn1–/– Cgc cultures had higher NeuroD2 protein levels (Figure 3C). Transfection of Pkn1–/– Cgcs with hPKN1, but not with GFP (Supplemental Figure 3B), reduced the mean NeuroD2 intensity in immunofluorescence stain-ings (Figure 3D), establishing PKN1 as a negative regulator of D2 levels. This fits well with our observation of a defective spacing of presynaptic sites in Pkn1–/– Cgcs (Figure 2B), since NeuroD2 is a tran-scription factor preventing presynaptic differentiation, whose over-expression reduces the density of presynaptic sites in Cgcs (30). Since AKT has been shown to enhance the activity of several transcription factors regulating NeuroD2 expression, such as neuro genin 1 and neuronal differentiation-1 (NeuroD1) (35, 36), we next tested whether AKT regulates NeuroD2 protein levels in Cgcs.
[image:4.585.36.545.54.378.2]In protein extracts of WT Cgcs at DIV1 treated with MK-2206 for 24 hours, we found that MK-2206 dose-dependently reduced
Figure 1. Pkn1–/– mice show a defective PF-PC synapse formation during development. (A) Cerebellar vermis sections of P8–P15 animals (n = 4–12). Arrows
mark distal and perisomatic varicosities of VGlut2-stained CFs. Scale bar: 50 μm. (B) The ratio of the VGlut2-stained CF innervation depth (μm) to the ML thickness (μm) was analyzed [1-way ANOVA with Newman-Keuls multiple-comparisons test, F(3,27) = 16.7, P < 0.0001, post-test *P < 0.05, **P < 0.01, ***P < 0.001; n = 4 WT, 4 Pkn1–/– animals for P8, n = 12 WT, 11 Pkn1–/– animals for P15 from 5–8 litters per group]. (C) The score of PC perisomatic VGlut2
staining in P15 animals [χ2 test = 4.286, P = 0.0384, n = 5 WT, 5 Pkn1–/– animals from 5 litters per group]. (D) CF-induced ePSCs were recorded from PCs in
acute slices. With increasing stimulation strength, ePSCs were obtained in an all-or-none fashion (single CF) or in 2 or more discrete steps (multiple CFs) [χ2 test = 9.68, P = 0.0019, n = 23 WT, 23 Pkn1–/– cells from 7 P15–P17 animals per group]. (E) Spontaneous PC ePSC frequencies [2-tailed unpaired t test with
Welch’s correction, t(5) = 2.865, *P = 0.0352, n = 6 WT, 4 Pkn1–/– cells from 3–5 P13–P15 animals per group]. (F) Western blot analysis of Cbln1 and GluD2
levels (n = 3–4). (G and H) Analysis of the Cbln1/tubulin ratio (G) [2-tailed unpaired t test, t(5) = 3.365, *P = 0.0200, n = 3 WT, 4 Pkn1–/– extracts from 3–4
animals per group] and GluD2/tubulin ratio (H) [2-tailed unpaired t test, t(5) = 1.016, P = 0.3561, n = 3 WT, 4 Pkn1–/– extracts from 3–4 animals per group] in
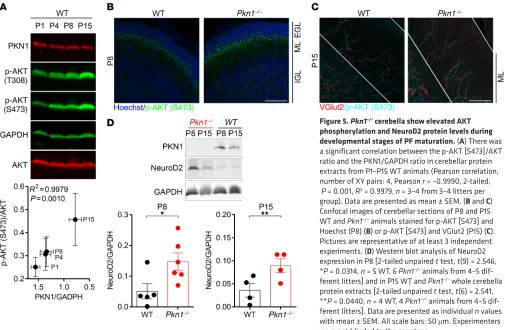
ping and AKT phosphorylation increasing during development (Figure 5A). Concomitantly we found higher AKT phosphory-lation in Pkn1–/– cerebella protein lysates (Supplemental Figure 5A) and in immunofluorescence stainings (Figure 5, B and C). AKT phosphorylation levels were particularly increased in areas and developmental stages of axonal outgrowth and maturation of Cgcs and dendritic outgrowth and maturation of PCs. At P8 Pkn1–/– animals showed higher AKT phosphorylation in the PF-forming Cgcs of the premigratory EGL, where Cgcs start extending axons, as well as in the IGL (Figure 5B). At P15, higher AKT phosphorylation was found in the IGL and in PC dendrites (Figure 5C). In agreement with greater AKT activity, we found increased NeuroD2 protein levels in Pkn1–/– cerebellar protein extracts (Figure 5D). There were no differences in AKT phos-phorylation or NeuroD2 levels in adult animals (Supplemental ilarly, elevated NeuroD2 levels in Pkn1–/– Cgcs were restored to
WT levels upon Akt123 knockdown (Figure 4C) and accompanied by an increased density of presynaptic sites (Figure 4D). Knock-down of Akt123 also resulted in an enhanced expression of Cbln1 in WT (Supplemental Figure 4C) and Pkn1–/– Cgcs (Supplemental Figure 4D). These data confirm our previous findings that PKN1- mediated modulation of AKT is crucial for the balance between axonal outgrowth, NeuroD2/Cbln1 expression, and presynaptic differentiation. We therefore next tested AKT phosphorylation and NeuroD2 expression during in vivo development in WT and
Pkn1–/– animals.
Cerebellar alterations in Pkn1–/– mice coincide with
develop-mentally enhanced AKT phosphorylation and NeuroD2 expres-sion in vivo. Protein lysates prepared from P1–P15 WT cerebella
showed an inverse correlation between PKN1 expression
drop-Figure 2. Pkn1–/– Cgcs have a reduced density of presynaptic sites and enhanced axonal outgrowth. (A) In WT Cgcs, TAU-stained axonal en passant
swellings colocalized with the presynaptic marker synapsin I (images were taken at DIV4 and are representative of at least 3 separate experiments in WT and Pkn1–/– Cgcs). (B) The number of en passant swellings (varicosities) per axonal section was analyzed in WT and Pkn1–/– Cgcs at DIV7 [2-tailed unpaired
t test, t(6) = 4.413, **P = 0.0045, n = 4 WT, 4 Pkn1–/– Cgc preparations from 4 litters per group]. (C) Pkn1–/– Cgcs were transfected with GFP together with a
control HA-plasmid (Co-HA) or human HA-tagged PKN1 (hPKN1), and varicosities per axonal section were analyzed at DIV7 in GFP-expressing/TAU-stained Cgcs [2-tailed unpaired t test, t(4) = 7.147, **P = 0.002, n = 3 from 3 litters]. (D) Axonal length after DIV1 [2-tailed unpaired t test, t(5) = 4.431, **P = 0.0068, n = 4 WT, 3 Pkn1–/– Cgc preparations from 3–4 litters per group] and DIV7 [2-tailed unpaired t test, t(6) = 2.692, *P = 0.0360, n = 4 WT, 4 Pkn1–/– Cgc
prepara-tions from 4 litters per group] in TAU-stained Cgcs. (E) Pkn1–/– Cgcs were transfected with GFP together with Co-HA or hPKN1, and axonal length at DIV7 was
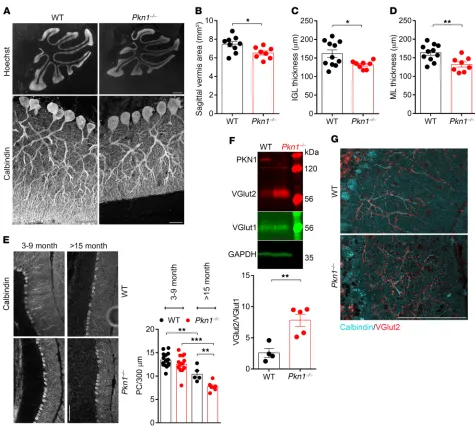
[image:5.585.50.537.57.407.2]ML (Figure 6, A and D). The facts that the proliferative layer of the EGL in young animals was similar between both genotypes (Supplemental Figure 6A) and that there were no ectopic NeuN- positive cells in the ML of adult Pkn1–/– cerebella (Supplemental Figure 6B) rule out a defective proliferation/migration of Pkn1–/– Cgcs as the underlying mechanism. In further agreement with a defective PF-PC synapse formation, we saw no significant PC degeneration in 3- to 9-month-old animals, but we found a late- onset loss of PCs in Pkn1–/– mice older than 15 months (Figure 6E).
Adult Pkn1–/– mice still showed abnormal CF innervation, as seen in a significantly higher ratio of VGlut2/VGlut1 protein lev-els (Figure 6F) and increased VGlut2 staining (Figure 6G). In WT animals, VGlut2-stained CF terminals showed a reduction in the number of varicosities from the proximal part of the PC dendrite to the distal part (Figure 6G and Supplemental Figure 6C). This was not seen in Pkn1–/– animals, where the number of varicosities remained the same throughout the entire innervation depth of CFs (Figure 6G and Supplemental Figure 6C). Additionally, PCs of adult Pkn1–/– animals still had thicker dendrites (Supplemental Figure 6D), showing that Pkn1 knockout–mediated defects of CF elimination and dendritic outgrowth persist throughout life. Figure 5, B and C), showing a development-specific effect of
Pkn1 knockout on AKT and NeuroD2.
These exciting results show, for the first time to our knowledge, that PKN1 controls AKT phosphorylation and NeuroD2 expres-sion during cerebellar development in vivo, thereby explaining the defective PF-PC synapse formation and reduced Cbln1 expression levels upon Pkn1 knockout.
Interestingly, we also found that the enlarged dendritic cali-ber of Pkn1–/– PCs could be reduced to WT levels upon incubation of organotypic slices with the AKT antagonist MK-2206, showing that PKN1 also controls PC dendritic caliber upstream of AKT (Supplemental Figure 5D). Therefore, we cannot exclude a PC- dependent defect, due to dendritic thickening upon Pkn1 knock-out, that further weakens PF-PC synapse formation.
[image:6.585.41.540.57.343.2]Adult Pkn1–/– animals show cerebellar degeneration. Several other studies have related a defective PF-PC synapse formation to a degeneration of Cgcs and a late-onset loss of PCs (22, 37). As compared with WT mice, adult (3–9 months old) Pkn1–/– mice still displayed a similar cerebellar foliation pattern, but Pkn1–/– animals had smaller cerebella, as seen in a smaller sagittal vermis areas (Figure 6, A and B), with a thinner IGL (Figure 6, A and C) and
Figure 3. Pkn1 knockout results in elevated AKT phosphorylation and NeuroD2 protein levels in Cgcs in vitro. (A) Phospho-AKT (p-AKT) [T308] intensity
was measured in untransfected Pkn1–/– Cgcs and Pkn1–/– Cgcs expressing human HA-tagged PKN1 (hPKN1) [8–22 transfected cells were analyzed per
exper-iment; 2-tailed paired t test, t(2) = 5.365, *P = 0.033, n = 3 from 3 litters]. (B) Cgc axonal length was measured at DIV1 after 24 hours of treatment with the AKT inhibitor MK-2206 (1 or 5 μM) in TAU-stained Cgcs [1-way ANOVA with Newman-Keuls multiple-comparisons test, F(5,15) = 26.97, P < 0.0001, post-test **P < 0.01, ***P < 0.001; n = 3–4 WT, 3–4 Pkn1–/– Cgc preparations from 3–4 litters per group]. (C) NeuroD2 expression levels were analyzed in Cgcs
at DIV6–8 [2-tailed unpaired t test, t(11) = 3.228, **P = 0.008, n = 7 WT, 6 Pkn1–/– Cgc preparations from 6–7 different litters]. Representative
WIS-Neuro-Math–analyzed output images are shown. (D) NeuroD2 intensity was measured at DIV4 in untransfected Pkn1–/– Cgcs and Pkn1–/– Cgcs expressing hPKN1
Behavioral phenotyping of adult Pkn1–/– mice reveals an ataxia-like
phenotype. Considering the important role of the cerebellum in
bal-ance and motor control, we tested a cohort of adult (4–9 months) WT and Pkn1–/– mice in a set of refined motor behavior tests.
Pkn1–/– mice showed an abnormal performance in the vertical pole test. While the majority of WT mice turned around and climbed down, most Pkn1–/– mice fell down, slid sideways, or froze on the pole (Figure 7A), indicating balance and motor coordination prob-lems. In line with this, Pkn1–/– mice were slower than WT mice in crossing a horizontal beam (Figure 7B) and showed more slips and balance coordination problems than WT mice in the ledge test
[image:7.585.45.540.56.453.2](Fig-ure 7C). Moreover, Pkn1–/– mice exhibited hind-limb clasping, a sign of neurodegeneration (38), with most animals having one hind limb partly retracted toward the body (Figure 7D). While the grip strength in the wire hang test was not different between the groups, the hind-limb grip duration was significantly reduced in Pkn1–/– mice, with most mice turning in circles and not being able to grab the wire properly (Figure 7E). Footprint analysis further indicated that Pkn1–/– mice preferred tip toe walking and showed a reduced toe spread score (Figure 6F). General locomotion in the open field test was similar between WT and Pkn1–/– mice (Supplemental Fig-ure 7A). Likewise, anxiety-related behavior tested in the elevated
Figure 4. siRNA-mediated Akt knockdown reduces axonal length and NeuroD2 protein levels and increases the density of presynaptic sites in Pkn1–/–
Cgcs. (A) siRNAs targeting Akt123 reduce pan-AKT expression after DIV1. Pictures are representative of 5 separate experiments. For analysis at DIV1 and
DIV4 in WT and Pkn1–/– Cgcs, see Supplemental Figure 4, A and B. (B) siRNAs targeting Akt123 significantly reduce axonal length of Pkn1–/– Cgcs at DIV1
[1-way ANOVA with Newman-Keuls multiple-comparisons test, F(3,16) = 20.78, P < 0.0001, post-test ***P < 0.001, n = 5 WT, 5 Pkn1–/– Cgc preparations
from 3–5 litters per group]. Axons were stained with TAU. Representative WIS-NeuroMath–analyzed output images are shown. (C) siRNAs targeting Akt123 significantly reduce NeuroD2 intensity in WT and Pkn1–/– Cgcs at DIV4 [1-way ANOVA with Newman-Keuls multiple-comparisons test, F(3,16) = 18.73,
P < 0.0001, post-test *P < 0.05, ***P < 0.001; n = 5 WT, 5 Pkn1–/– Cgc preparations from 3–5 litters per group]. (D) Presynaptic sites (varicosities) were stained
with TAU and synapsin I. Insets represent higher-magnification single- and double-labeled examples of axonal varicosities (indicated by arrows). White varicosities in double-labeled insets demonstrate TAU and synapsin I colocalization. siRNAs targeting Akt123 significantly increase the density of presynap-tic sites in Pkn1–/– Cgcs at DIV4 [1-way ANOVA with Newman-Keuls multiple-comparisons test, F(3,16) = 16.62, P < 0.0001, post-test ***P < 0.001, n = 5 WT, 5
Pkn1–/– Cgc preparations from 3–5 litters per group]. All data are presented as individual n values with mean ± SEM. Scale bars: 50 μm, except in inset in D:
plus maze was not affected by Pkn1 knockout (Supplemental Fig-ure 7B). Therefore, these behavioral tests revealed that Pkn1–/– mice show normal locomotor activity but have problems with balance and motor coordination and display signs of mild ataxia, such as hind-limb clasping and gait abnormalities. Interestingly, the behavioral abnormalities of Pkn1–/– mice start before an obvious PC loss (Figure 6E), suggesting synaptic dysfunctions and Cgc degen-eration rather than PC degendegen-eration as the underlying mechanism.
Discussion
Data presented here shed light on the largely unknown brain-specific functions of PKN1. We demonstrate that PKN1 is an important gatekeeper of intrinsic AKT activity during cerebellar development in vivo. We propose a mechanism by which PKN1-mediated AKT inhibition during PF growth (P4– P15) results in a reduction of NeuroD2 levels and a subsequent increase in presynaptic specifications and Cbln1 expression in Cgcs, which is essential for a correct PF-PC synapse formation and cerebellar long-term function.
Accordingly, Pkn1–/– animals have an impaired developmental regression of CFs, persistent multiple CF innervation, and a reduced spontaneous ePSC frequency of PCs, all indicative of a defective PF-PC synapse formation (Figure 1). Spontaneous PC activity in vitro is highly temperature sensitive and is inhibited at room tem-perature (25); therefore ePSCs recorded in our setting most likely arise from extrinsic input. Since the ratio of PF to CF synapses in the PC is on the order of 150:1 (39), it is generally assumed that
most spontaneous ePSCs reflect PF activity (26, 27). Defective CF elimination and reduced spontaneous PC activity are also seen in animals lacking the Cbln1 or GluD2 gene, both of which are needed for a correct PF-PC synapse formation (22, 28, 37). Interestingly, we found a reduced Cbln1 expression in Pkn1–/– animals, while GluD2 levels were only marginally affected, pointing toward a presynaptic Cgc-specific defect in PF-PC synapse formation.
[image:8.585.39.544.57.387.2]Using in vitro Cgc cultures, we could show that Pkn1 knockout leads to enhanced AKT phosphorylation and subsequently higher NeuroD2 protein levels. Cbln1 and NeuroD2 levels are reciprocally regulated by AKT in vitro, with decreased NeuroD2 and increased Cbln1 levels upon AKT inhibition, further showing that in Cgcs AKT is involved in controlling presynaptic differentiation. Subse-quently, Pkn1 knockout results in enhanced axonal outgrowth and reduced presynaptic differentiation in Cgcs in vitro, both of which could be restored to WT levels upon inhibition of AKT. In line with our in vitro data, Pkn1–/– animals showed pronounced AKT phos-phorylation and higher NeuroD2 levels at developmental stages critical for PF growth and synapse maturation. Throughout cer-ebellar development NeuroD2 is expressed only in Cgcs and ML interneurons, not in PCs (40, 41), and owing to the relatively low ML interneuron numbers compared with Cgcs, our analysis of protein extracts mainly reflects Cgc protein levels. NeuroD2 levels are particularly high during phases of axon growth in which it pre-vents premature presynaptic maturation, but are degraded with increasing developmental maturation in order to drive presynap-tic differentiation (30). Accordingly, NeuroD2 expression is tightly
Figure 5. Pkn1–/– cerebella show elevated AKT phosphorylation and NeuroD2 protein levels during
developmental stages of PF maturation. (A) There was
a significant correlation between the p-AKT [S473]/AKT ratio and the PKN1/GAPDH ratio in cerebellar protein extracts from P1–P15 WT animals (Pearson correlation, number of XY pairs: 4, Pearson r = –0.9990, 2-tailed, P = 0.001, R2 = 0.9979, n = 3–4 from 3–4 litters per group). Data are presented as mean ± SEM. (B and C) Confocal images of cerebellar sections of P8 and P15 WT and Pkn1–/– animals stained for p-AKT [S473] and
Hoechst (P8) (B) or p-AKT [S473] and VGlut2 (P15) (C). Pictures are representative of at least 3 independent experiments. (D) Western blot analysis of NeuroD2 expression in P8 [2-tailed unpaired t test, t(9) = 2.546, *P = 0.0314, n = 5 WT, 6 Pkn1–/– animals from 4–5
dif-ferent litters] and in P15 WT and Pkn1–/– whole cerebella
protein extracts [2-tailed unpaired t test, t(6) = 2.541, **P = 0.0440, n = 4 WT, 4 Pkn1–/– animals from 4–5
expressing both proteins (43); therefore we cannot exclude that despite higher NeuroD2 protein levels in Pkn1–/– cerebella, the lack of PKN1 additionally affects NeuroD2 function. However, the fact that Pkn1–/– Cgcs show a reduced density of presynaptic sites, a typi-cal effect of NeuroD2 (30), points toward normal NeuroD2 activity. Many neurological disorders have been linked with aberrant AKT signaling caused by germline mutations of certain tumor suppressor genes such as phosphatase and tensin homolog (Pten) or tuberous sclerosis proteins 1 and 2 (Tsc2/Tsc1) (44–46). Inter-estingly, a partial knockout of disabled homolog 2–interacting controlled, since an increase in NeuroD2 decreases cell-intrinsic
neuronal excitability (42). Our data offer pioneering evidence on a developmentally regulated PKN1-AKT axis that controls NeuroD2 levels and subsequently the precise balance between axonal growth and presynaptic differentiation of Cgcs. Deletion of
Pkn1 therefore interferes with the correct PF-PC synapse
forma-tion (Figures 1–5) and results in cerebellar atrophy in adult animals (Figures 6 and 7).
The truncated C-terminal fragment of PKN1 enhances Neuro-D2-mediated transcription in vitro and in mammalian cells
over-Figure 6. Adult Pkn1–/– mice show cerebellar shrinkage and late-onset PC degeneration. (A) Size differences of adult WT and Pkn1–/– cerebella (3–9
months), as seen in Hoechst-stained sagittal vermis sections and calbindin-stained ML pictures (representative images of 8–11 separate experiments). (B–D) Analysis of the cerebellar vermis area (B) [2-tailed unpaired t test, t(15) = 2.510, *P = 0.0236, n = 9 WT, 8 Pkn1–/– animals from 4–6 litters per group], the
IGL thickness (C) [2-tailed unpaired t test with Welch’s correction, t(12) = 2.772, *P = 0.0169, n = 11 WT, 8 Pkn1–/– animals from 4–5 litters per group], and the
ML thickness (D) [2-tailed unpaired t test, t(17) = 3.210, **P = 0.0051, n = 11 WT, 8 Pkn1–/– animals from 4–5 litters per group] in 3- to 9-month-old animals.
(E)PC number in 3- to 9-month-old and 15- to 22-month-old animals [1-way ANOVA with Newman-Keuls multiple-comparisons test, F(3,38) = 23.12, P < 0.0001, post-test **P < 0.01, ***P < 0.001; n = 5–15 WT, 7–15 Pkn1–/– animals]. (F) Cerebellar protein extracts from 3- to 9-month-old animals were
ana-lyzed for the VGlut2/VGlut1 ratio [2-tailed unpaired t test, t(7) = 4.138, **P = 0.0044, n = 4 WT, 5 Pkn1–/– animals from 4 litters per group]. (G) Calbindin- and
[image:9.585.54.529.51.477.2]sion (P4–P15; Supplemental Figure 5A and Figure 5) may serve as a direct explanation for this discrepancy. Despite the rapidly increasing literature on AKT signaling and neurodevelopment, this is, to our knowledge, the first report linking developmental AKT activity with NeuroD2 levels and PF-PC synapse formation, and we offer PKN1 as a regulator of this pathway. The detailed elu-cidation of the molecular mechanism of AKT-mediated increase in NeuroD2 protein levels, such as whether AKT enhances D2 expression via enhancement of neurogenin 1 or NeuroD1 tran-scriptional activity (35, 36, 51) or else protects its proteolytic deg-radation, remains to be solved in future investigations.
Another well-characterized effect of a defective PF-PC syn-apse formation is a late-onset degeneration of Cgcs and PCs (22, protein (Dab2ip), a molecule that shifts the balance of PI3K/AKT–
mediated cell survival toward apoptosis signal–regulating kinase 1–mediated (ASK1-mediated) apoptosis, has a similar phenotype to Pkn1–/– mice (47). Dab2ip-knockdown mice show aberrant PC dendrite maturation and a defective balance of CF/PF synaptic markers. Pkn1–/– mice also show some overlapping features with mice with a deletion of Pten (48–50). These include increased AKT phosphorylation, abnormal axonal outgrowth, enhanced presynaptic spacing, dendritic thickening, reduction of ML thick-ness, degeneration of PCs, and deficits in motor coordination (48–50). However, Pkn1–/– and Pten–/– phenotypes differ in other aspects, such as brain enlargement and enlarged cell somata. The tight developmental regulation of PKN1-mediated AKT
suppres-Figure 7. Adult Pkn1–/– animals have problems with balance and motor coordination. A cohort of adult (4–9 months) WT and Pkn1–/– animals was examined
for motor deficits in a set of behavioral tests. (A) Adult mice were tested in the vertical pole task [χ2 test (3) = 42.33, P < 0.0001, n = 11 WT, 12 Pkn1–/– animals
from 4–6 litters per group]. Data are presented as mean percentage. (B) Animals were tested in the balance beam test [2-tailed unpaired t test with Welch’s correction, t(15) = 2.328, *P = 0.0334, n = 11 WT, 12 Pkn1–/– animals from 4–6 litters per group]. (C) Animals were scored in the ledge test [χ2 test (1) = 7.441, P = 0.0064, n = 11 WT, 12 Pkn1–/– animals from 4–6 litters per group]. (D) Animals were scored for hind-limb clasping [χ2 test (2) = 8.767, P = 0.0125, n = 11 WT, 12 Pkn1–/– animals from 4–6 litters per group]. (E) In the wire hang test, the grip strength, as determined by the latency to fall [2-tailed unpaired t test, t(21)
= 0.1352, P = 0.8938, n = 11 WT, 12 Pkn1–/– animals from 4–6 litters per group] and hind-limb grip duration [2-tailed unpaired t test, t(19) = 2.724, *P = 0.0135,
n = 9 WT, 12 Pkn1–/– animals from 4–6 litters per group], was assessed. (F) Footprints were scored for tip toe walking [χ2 test (1) = 9.763, P = 0.0018, n = 11 WT, 12 Pkn1–/– animals from 4–6 litters per group] and toe spread [χ2 test (2) = 6.345, P = 0.0419, n = 11 WT, 12 Pkn1–/– animals from 4–6 litters per group]. Data in B
[image:10.585.41.540.53.447.2]the mice could walk on the whole foot (paw and toes) and then scored the gait for how they preferred to walk (tip toes or whole foot). We cal-culated the toe spread score by assigning values between 0 (narrowest spread) and 2 (widest spread).
Paraformaldehyde perfusion. Mice were deeply anesthetized by an overdose of thiopental (150 mg/kg), and brains were fixed by tran-scardial perfusion with PBS (50 mM PBS, pH 7.2; 2 minutes) followed by 4% paraformaldehyde (PFA) in PBS (10 minutes).
Preparation of cerebellar granule cells. Cgcs were prepared as described previously (58). Cells were kept in Neurobasal medium (Thermo Fisher Scientific) supplemented with 1% penicillin/ streptomycin/glutamine (Sigma-Aldrich), 2% B-27 (Thermo Fisher Scientific), and an additional 20 mM KCl. Coverslips and dishes were coated with poly-l-ornithine or poly-l-lysin (2 hours to overnight;
Sigma-Aldrich), and for coverslips laminin (10 μg/ml; Sigma-Aldrich)
was subsequently added for 2–3 hours at 37°C. MK-2206 (Santa Cruz Biotechnology) was added 2–3 hours after preparation.
Transfections of cerebellar granule cells. Nucleofection (Lonza) of
Cgcs was performed as described previously (59) with 5 μg plasmid
DNA and, if indicated, together with 3 μg pmax GFP plasmid (Lonza)
using program G-013. Human PKN1 (hPKN1) was purchased from GeneCopoeia and subcloned into the mammalian expression vector
pEF-neo. For Lipofectamine transfections, 2 μl Lipofectamine (Thermo
Fisher Scientific) and 0.9 μg plasmid DNA were mixed with
Neuro-basal medium and added to coverslips for 6–8 hours. The medium was then exchanged for the preconditioned culture medium, and cells were analyzed after 48 hours. Akt123 and control siRNAs were purchased from Dharmacon. For siRNA transfections, 101 nM of each Akt siRNA (303 nM in total) and 303 nM control, nontargeting siRNAs were transfected with program G-013 or program O-005, both of which yielded similar results. Using higher siRNA concentrations resulted in cell death upon Akt knockdown (data not shown). Trans-fections of the same Cgc preparation with 2 different programs were counted as separate experiments.
Cryosectioning. P1, P4, P8, P15, and adult brains were fixed in 4% PFA for 2.5 hours (P1, P4, and P8), for 5 hours (P15), overnight (adult brains), or by PFA perfusion. Brains were incubated in a sucrose gradient (10% sucrose for 2 hours, 20% sucrose overnight, and 30% sucrose for a minimum of 2 days), embedded in OCT compound (Thermo Fisher Scientific), and stored at –80°C until analysis. Twenty-micrometer-thick sections were cut with a cryostat (CM1950, Leica), transferred onto lysine-coated coverslips (Sigma-Aldrich), and allowed to dry for 2 hours at room temperature for further analysis or stored at –20°C. In order to
ensure comparable results, age-matched WT and Pkn1–/– sections were
prepared on the same day and transferred onto the same coverslip. Immunofluorescence staining. Cells were fixed (4% PFA 15 minutes, methanol 30 seconds at –20°C), permeabilized (0.3% Triton X-100, 15 minutes), and blocked (1% BSA, 2% goat serum, 1 hour). For cerebellar sections, permeabilization was 30 minutes and a higher blocking solu-tion was used (10% goat serum, 2% BSA, 1 hour). For VGlut2 and p-AKT T308 staining of cerebellar sections, we performed antigen retrieval in a 10-mM sodium citrate buffer, pH 6, with 0.05% Tween-20 (100°C for 10 minutes). Primary antibodies (diluted in 0.1% Triton X-100, 1% BSA, 2% goat serum in PBS) were added at 4°C overnight. After wash-ing in PBS, secondary antibodies (goat anti-rabbit–Alexa Fluor 488 and goat anti-mouse–Alexa Fluor 555) were added for 2–4 hours at room temperature. Coverslips/sections were washed in PBS and embedded
37). In agreement with that, we show that the long-term effect of
Pkn1 knockout results in cerebellar shrinkage and PC degeneration
and is accompanied by gait abnormalities, hind-limb clasping, and motor coordination problems (Figures 6 and 7), reminiscent of mild cerebellar ataxia (18). Interestingly, recent studies have connected microdeletions on chromosome 19p13.12, including PKN1, to human cerebellar hypoplasias and psychomotor delays (52–55). It has there-fore been suggested that one or more of the genes on chromosome 19p13.12 have a role in the control of movements (55), and our results establish PKN1 as a promising new candidate gene for this.
Methods
Further information can be found in Supplemental Methods, available online with this article; https://doi.org/10.1172/JCI96165DS1.
Animals. The generation of Pkn1-knockout mice (Pkn1–/– mice) has
been described recently (17). Mice were backcrossed to C57BL/6N for
more than 8 generations. C57BL/6N WT and C57BL/6N Pkn1–/– animals
were derived from the same heterozygous crosses and then bred sepa-rately, but kept under the same housing and experimental conditions in the same room. C57BL/6N were derived from The Jackson Laboratory.
Behavioral phenotyping. Experiments were performed in a cohort
of adult (3–9 months) WT (n = 11) and Pkn1–/– (n = 12) animals between
8 am and 1 pm.
Hind-limb clasping. Mice were lifted for 10–20 seconds by grasp-ing of their tail, and movement of hind limbs was scored as previously described (56). Hind-limb clasping was assessed 3 times; the mean score was calculated and rounded up or down to the full score. In case of 0.5 or 1.5 the score was downgraded to 0 or 1.
Ledge test. For the ledge test, mice were lifted from their home cage and placed on another cage ledge, as described previously (56). The test was repeated twice, and the mean score of both performances was calculated and rounded up or down to the full score. In case of 0.5 or 1.5 the score was downgraded to 0 or 1.
Pole climb. The task for the mice in this test was to turn around and climb down from the top of a vertical pole (1 cm diameter, 60 cm height) within 120 seconds. The behavior on the pole (climbing down, sliding down sideways, freezing on the column for more than 120 sec-onds, or falling down) was assessed in 3 different trials, and the per-centage of each behavior for each mouse was analyzed.
Beam walk. Motor coordination and balance were assessed by mea-surement of the ability of the mice to traverse a narrow 18-mm-wide, 9-mm-high, 2-m-long beam. Mice were placed in the middle, 70 cm above the ground. Illumination was set to 150 lux. The latency to tra-verse the beam to the safety platform was recorded for 2 trials, and the mean was calculated.
Wire hang. The animal was placed on a wire cage lid, which was then inverted and suspended above the home cage after a modified method (57). The cage lid was kept at 40 cm above a cage filled with soft material. The latency for each animal to release the grip with a cutoff time of 150 seconds as well as the hind-limb grip duration was recorded. The latter was performed on video recordings of 9 WT and 12 Pkn1–/– animals.
Patch pipettes were pulled from borosilicate capillaries (GB120F-10, Science Products) with a Sutter P-1000 puller; the resistance was
typically 2–5 MΩ when filled with internal solution consisting of (in
mM): K-gluconate, 132; EGTA/KOH, 1; MgCl2, 2; NaCl, 2; HEPES/
KOH, 10; Mg-ATP, 2; GTP, 0.5. The pH was adjusted to 7.2–7.25 with KOH, and the osmolality was 280–285 mOsm/kg. Recordings were obtained using a Multiclamp 700B amplifier and displayed with pClamp (Molecular Devices). In whole-cell configuration (holding potential –70 mV), series resistances were typically around 10–15
MΩ. Cells were allowed to equilibrate for 10 minutes before
record-ing. Evoked CF inputs were triggered with a stimulation electrode
filled with aCSF (resistance ~0.5 MΩ) that was placed 50–70 μm
away from the recorded PC soma in the granule cell layer. The unipo-lar square pulses with durations of 0.2 milliseconds were delivered at 0.1 Hz via a constant current stimulus isolator (World Precision Instruments A365). Stimulation current amplitudes were between 5
μA and 100 μA. At least 3 discrete steps above triggering threshold
with a step size of 10 μA were recorded in each cell. The CF synaptic
inputs to the PCs were recorded at room temperature at a holding potential of –70 mV, low-pass-filtered at 10 kHz, and sampled at 20 kHz. Data analysis was done in Matlab (Mathworks), and traces were analyzed by 2 different blinded experimenters. Spontaneous ePSCs and iPSCs were recorded at room temperature, low-pass-filtered at 10 kHz, and sampled at 20 kHz; traces were low-pass-filtered after recordings at 1–4 kHz and analyzed with Clampfit module in pClamp.
Western blotting. Protein extracts and Western blotting were performed as described previously (59). Primary antibodies were added overnight in 5% BSA in TBS-T at 4°C, and secondary anti-bodies (LI-COR) or HRP-tagged antianti-bodies were added for 90 min-utes in 5% milk in TBS-T. After washing in TBS-T, membranes were imaged and analyzed with Odyssey Infrared Imager (LI-COR) or ECL detection as described previously (63).
Antibodies. Clone numbers, where known, and catalog num-bers are provided in parentheses. The p-AKT T308 antibody (catalog SAB4300043, further validated with MK-2206 in Cgcs; not shown) was from Sigma-Aldrich. The following antibodies were from Cell Signaling: ERK1/2 (catalog 9102), GAPDH (D16H11, catalog 5174), HA-Tag (C29F4, catalog 3724), NeuN (D4G40, catalog 24307), p-AKT S473 (Western blotting, D9E, catalog 4060), p-ERK1/2 (catalog 9101), pan-AKT (Western blotting, 40D4, catalog 2920), synapsin-I (D12G5,
catalog 5297), and TAU (Tau46, catalog 4019). α-Tubulin (DM1A,
cat-alog ab80779), calbindin (catcat-alog ab11426), calbindin (CB-955, catcat-alog ab82812), cerebellin 1 (EPR13649, catalog ab181379), Ki-67 (catalog ab15580), p-AKT S473 (immunofluorescence staining, EP2109Y, cat-alog ab81283, further validated with MK-2206 in Cgcs; not shown), AKT1/2/3 (immunofluorescence staining and Western blotting, EPR16798, catalog ab179463), and VGlut2 (8G9.2, catalog ab79157) were from Abcam. HA.11 (clone 16B12, catalog MMS-101P) was from antibody solution. Confocal images of at least 3 independent
experi-ments taken at the same exposure time are shown.
Analysis of cerebellar morphology. All analyses were performed in the cerebellar vermis area of cerebellar lobule IV/V in a blinded man-ner using ImageJ. The mean vermis area was calculated from 2–6 sec-tions per animal. The IGL thickness (3–5 measurements of 2–5 secsec-tions per animal) and ML thickness (3–5 measurements of 2–5 sections per animal) were measured at the thickest part of cerebellar lobule IV/V. The VGlut2/ML ratio was determined by 4–14 measurements of 1–2 sagittal sections per animal. Perisomatic VGlut2 staining was scored by 2 experimenters in 1–2 confocal images per animal.
Measurement of axonal length and presynaptic spacing. Cgcs grown on laminin-coated coverslips were fixed at indicated time points and stained for TAU. Pictures were manually cleaned from background noise using ImageJ. Incomplete neurons as well as neurons with axons that crossed other axons (in that case the neuron with the shorter axon or the one that crossed more than 2 other axons was deleted) were erased. A minimum of 70 cells per coverslip (DIV1) and 20 cells per coverslip (DIV7) and a minimum of 21 GFP-positive transfected cells were analyzed with WIS-NeuroMath (60, 61). The number of
presyn-aptic varicosities per 50-μm axonal section was determined by 1–4
measurements per axon from 24–42 cells per preparation.
Measurement of p-AKT and NeuroD2 intensity in transfected
cerebel-lar granule cells. Pkn1–/– Cgcs grown on laminin were Lipofectamine-
transfected with hPKN1 on DIV5 and fixed and stained for HA and p-AKT T308 on DIV7. For NeuroD2 intensity measurements,
nucle-ofection was used to introduce hPKN1 in Pkn1–/– Cgcs immediately
after preparation, and cells were then kept for DIV4 on laminin-coated coverslips. Cells were fixed and stained for NeuroD2 and HA. Images were taken with a widefield (Axio, Zeiss) microscope, and mean p-AKT or NeuroD2 levels were measured with ImageJ in the transfected (HA-positive) cell and the surrounding untransfected cells. Between 8 and 32 transfected cells were analyzed and averaged per experiment. The average p-AKT or NeuroD2 intensity in untransfected cells was calculated from 3–15 cells surrounding the transfected cells per picture.
Electrophysiology. The age for spontaneous ePSC recordings was
P13–P15 (WT average age of 13.7, Pkn1–/– mice average age of 15), and
for CF-induced ePSCs, P15–P17 (WT average age of 15.7, Pkn1–/– mice
average age of 15.2). Animals were anesthetized (isoflurane) and decapitated. Brains were gently removed and immediately chilled (~0°C) in high-glucose artificial cerebrospinal fluid (HiGluc-aCSF)
containing (in mM): NaCl, 125; NaHCO3, 26; d-glucose, 25; KCl, 2.5;
NaH2PO4, 1.43; CaCl2, 2; MgCl2, 1. The aCSF pH was adjusted to 7.4
with a saturating carbogen mix (95 O2/5% CO2). Parasagittal
cere-bellar slices 300 μm thick were cut along the vermis with a vibratome
(Leica VT1200S) in ice-cold HiGluc-aCSF. Slices were thereafter allowed to recover for at least 30 minutes in HiGluc-aCSF and
Other Scientific Purposes (ETS no. 123) (BMWFW-66.011/0040-WF/ V/3b/2016). Every effort was made to minimize the number of animals used. The study was designed in compliance with Animal Research: Reporting of In Vivo Experiments (ARRIVE) guidelines. Blinding was always performed by a third party, and every figure legend clearly states whether analysis was performed in a blinded or nonblinded manner.
Author contributions
GBB and SzN developed the study concept and design. SzN per-formed immunoblotting, immunohistochemistry, and cell and slice culture experiments. RE and SzN performed studies on cere-bellar morphology. FF and GB performed recombinant DNA work. AJMC and PJP contributed the Pkn1–/– mice. CS designed and SzN, CS, RE, and GBB performed the animal behavior experiments. LZ, HS, and AK performed the electrophysiological experiments. SzN and GBB supervised the project and wrote the manuscript with critical input from all authors. GBB was the responsible coordina-tor of the project. All authors approved the manuscript.
Acknowledgments
We thank K. Thuille, T. Gruber, M. Klose, N. Posch, C. Stichlberger, M. Offterdinger, M. Kind for technical support, and B. Benedetti and C. Bandtlow for helpful discussions. We thank M.J. Woolley for sty-listic and editorial assistance. This study was funded by the Austrian Science Fund (P26002-B24 to GBB; P30324-B21 to GB; P30430 to CS; P29359 to AK) and the Christian Doppler Society (to GB).
Address correspondence to: Gabriele Baier-Bitterlich, Medi-cal University of Innsbruck, Biocenter, Division of Neurobio-chemistry, Innrain 80-82, 6020 Innsbruck, Austria. Phone: 43.512.9003.70289; Email: [email protected].
Covance. VGlut1 (catalog 48-2400), goat anti-rabbit–Alexa Fluor 488 (catalog A11070), and goat anti-mouse–Alexa Fluor 555 (catalog A21425) were purchased from Thermo Fisher Scientific, and GluD2 (D-9, catalog sc-393437) and NeuroD2 (G-10, catalog sc-365896) were from Santa Cruz Biotechnology. PKN1 (clone 49/PRK1, catalog 610687) was from BD Transduction Laboratories. The secondary antibodies for the Odyssey Infrared Imager, IRDye 680RD (catalog 926-68072) and IRDye 800CW (catalog 926-32211), were obtained from LI-COR.
Statistics. No statistical methods were used to predetermine sample sizes, but our sample sizes are similar to those reported in previous publications and typically had a statistical power sufficient to detect differences on the order of our effect sizes. Normal distribu-tions of data were presumed but not formally tested; equal variances were tested, and if they were not met, an unpaired 2-tailed t test with Welch’s correction was used. All data are presented as individual n values with or as mean ± SEM. For behavioral and histochemical analysis, n values refer to different animals from at least 3 differ-ent litters. For all cell culture experimdiffer-ents, n values refer to animals from different litters or transfections. For comparison of 2 indepen-dent groups, a 2-tailed unpaired t test was used, and for comparison of 2 dependent groups, a 2-tailed paired t test was used. For com-parison of 3 or more groups, a 1-way ANOVA with Newman-Keuls multiple-comparisons test was used, and for comparison of 2 vari-ables of 2 groups, a 2-way ANOVA was used. For comparison of
non-continous data (i.e., behavior, CF innervation), a χ2 test was used.
P values smaller than 0.05 were considered as statistically signifi-cant. All analyses were performed in GraphPad Prism 5 and 7.
Study approval. For all studies using adult animals, male mice were used, and all procedures were approved by the Austrian Animal Exper-imentation Ethics Board in compliance with the European Convention for the Protection of Vertebrate Animals Used for Experimental and
1. Mukai H, et al. PKN3 is the major regulator of angiogenesis and tumor metastasis in mice. Sci
Rep. 2016;6:18979.
2. Ostrovskyi D, et al. Tofacitinib and analogs as inhibitors of the histone kinase PRK1 (PKN1).
Future Med Chem. 2016;8(13):1537–1551.
3. Mukai H, Ono Y. A novel protein kinase with leu-cine zipper-like sequences: its catalytic domain is highly homologous to that of protein kinase C.
Bio-chem Biophys Res Commun. 1994;199(2):897–904.
4. Hashimoto T, Mukai H, Kawamata T, Taniguchi T, Ono Y, Tanaka C. Localization of PKN mRNA in the rat brain. Brain Res Mol Brain Res. 1998;59(2):143–153.
5. Kawamata T, et al. A protein kinase, PKN, accu-mulates in Alzheimer neurofibrillary tangles and associated endoplasmic reticulum-derived ves-icles and phosphorylates tau protein. J Neurosci. 1998;18(18):7402–7410.
6. Palmer RH, Ridden J, Parker PJ. Cloning and expression patterns of two members of a novel protein-kinase-C-related kinase family. Eur J
Biochem. 1995;227(1–2):344–351.
7. Flynn P, Mellor H, Palmer R, Panayotou G, Parker PJ. Multiple interactions of PRK1 with RhoA. Functional assignment of the Hr1 repeat motif. J Biol Chem. 1998;273(5):2698–2705. 8. Mukai H. The structure and function of PKN, a
protein kinase having a catalytic domain
homolo-gous to that of PKC. J Biochem. 2003;133(1):17–27. 9. Mukai H, et al. Translocation of PKN from the
cytosol to the nucleus induced by stresses. Proc
Natl Acad Sci U S A. 1996;93(19):10195–10199.
10. Takahashi M, Mukai H, Toshimori M, Miyamoto M, Ono Y. Proteolytic activation of PKN by caspase-3 or related protease during apoptosis. Proc Natl Acad Sci U S A. 1998;95(20):11566–11571.
11. Manser C, et al. Deregulation of PKN1 activity disrupts neurofilament organisation and axonal transport. FEBS Lett. 2008;582(15):2303–2308. 12. Sumioka K, et al. Induction of a 55-kDa PKN
cleavage product by ischemia/reperfusion model in the rat retina. Invest Ophthalmol Vis Sci. 2000;41(1):29–35.
13. Ueyama T, et al. Generation of a constitutively active fragment of PKN in microglia/macrophages after middle cerebral artery occlusion in rats. J Neurochem. 2001;79(4):903–913.
14. Okii N, et al. Fragmentation of protein kinase N (PKN) in the hydrocephalic rat brain. Acta
Histo-chem CytoHisto-chem. 2007;40(4):113–121.
15. Thauerer B, zur Nedden S, Baier-Bitterlich G. Vital role of protein kinase C-related kinase in the formation and stability of neurites during hypoxia. J Neurochem. 2010;113(2):432–446. 16. Thauerer B, Zur Nedden S, Baier-Bitterlich
G. Protein Kinase C-Related Kinase (PKN/
PRK). Potential key-role for PKN1 in protection of hypoxic neurons. Curr Neuropharmacol. 2014;12(3):213–218.
17. Quétier I, et al. Knockout of the PKN family of Rho effector kinases reveals a non-redundant role for PKN2 in developmental mesoderm expansion. Cell Rep. 2016;14(3):440–448. 18. Cendelin J. From mice to men: lessons from
mutant ataxic mice. Cerebellum Ataxias. 2014;1:4. 19. Hoxha E, Tempia F, Lippiello P, Miniaci MC.
Modulation, plasticity and pathophysiology of the parallel fiber-Purkinje cell synapse. Front
Synaptic Neurosci. 2016;8:35.
20. Ichikawa R, Sakimura K, Watanabe M. GluD2 endows parallel fiber-Purkinje cell synapses with a high regenerative capacity. J Neurosci. 2016;36(17):4846–4858.
21. Watanabe M, Kano M. Climbing fiber synapse elimination in cerebellar Purkinje cells. Eur J
Neurosci. 2011;34(10):1697–1710.
22. Hirai H, et al. Cbln1 is essential for synaptic integrity and plasticity in the cerebellum. Nat
Neurosci. 2005;8(11):1534–1541.
23. Lin H, et al. Early VGLUT1-specific parallel fiber synaptic deficits and dysregulated cerebellar circuit in the KIKO mouse model of Friedreich ataxia. Dis Model Mech. 2017;10(12):1529–1538. 24. Kano M, et al. Persistent multiple climbing fiber
vivo. J Neurosci. 2008;28(23):5920–5930. 28. Uemura T, et al. Trans-synaptic interaction of
GluRδ2 and Neurexin through Cbln1 mediates synapse formation in the cerebellum. Cell. 2010;141(6):1068–1079.
29. Matsuda K, et al. Cbln1 is a ligand for an orphan glutamate receptor δ2, a bidirectional synapse organizer. Science. 2010;328(5976):363–368. 30. Yang Y, et al. A Cdc20-APC ubiquitin signaling
pathway regulates presynaptic differentiation.
Science. 2009;326(5952):575–578.
31. Shepherd GM, Raastad M, Andersen P. Gen-eral and variable features of varicosity spacing along unmyelinated axons in the hippocam-pus and cerebellum. Proc Natl Acad Sci U S A. 2002;99(9):6340–6345.
32. Dajas-Bailador F, Bantounas I, Jones EV, Whit-marsh AJ. Regulation of axon growth by the JIP1-AKT axis. J Cell Sci. 2014;127(pt 1):230–239. 33. Wick MJ, Dong LQ, Riojas RA, Ramos FJ, Liu
F. Mechanism of phosphorylation of protein kinase B/Akt by a constitutively active 3- phosphoinositide-dependent protein kinase-1.
J Biol Chem. 2000;275(51):40400–40406.
34. Yasui T, et al. Protein kinase N1, a cell inhibitor of Akt kinase, has a central role in quality control of germinal center formation. Proc Natl Acad Sci
U S A. 2012;109(51):21022–21027.
35. Wang L, et al. Neurogenin 1 mediates eryth-ropoietin enhanced differentiation of adult neural progenitor cells. J Cereb Blood Flow Metab. 2006;26(4):556–564.
36. Darshit BS, Ramanathan M. Activation of AKT1/ GSK-3β/β-catenin-TRIM11/survivin pathway by novel GSK-3β inhibitor promotes neuron cell sur-vival: study in differentiated SH-SY5Y cells in OGD model. Mol Neurobiol. 2016;53(10):6716–6729. 37. Zanjani HS, Vogel MW, Mariani J. Deletion of the
GluRδ2 receptor in the hotfoot mouse mutant causes granule cell loss, delayed Purkinje cell death, and reductions in Purkinje cell dendritic tree area. Cerebellum. 2016;15(6):755–766.
41. Miyata T, Maeda T, Lee JE. NeuroD is required for differentiation of the granule cells in the cerebellum and hippocampus. Genes Dev. 1999;13(13):1647–1652.
42. Chen F, et al. The transcription factor NeuroD2 coordinates synaptic innervation and cell intrinsic properties to control excitability of cortical pyramidal neurons. J Physiol (Lond). 2016;594(13):3729–3744.
43. Shibata H, et al. Interaction of PKN with a neuron- specific basic helix-loop-helix transcription factor, NDRF/NeuroD2. Brain Res Mol Brain Res. 1999;74(1-2):126–134.
44. Lasarge CL, Danzer SC. Mechanisms regulating neuronal excitability and seizure development following mTOR pathway hyperactivation. Front
Mol Neurosci. 2014;7:18.
45. Orlova KA, Crino PB. The tuberous sclerosis complex. Ann N Y Acad Sci. 2010;1184:87–105. 46. Franke TF. PI3K/Akt: getting it right matters.
Oncogene. 2008;27(50):6473–6488.
47. Qiao S, Kim SH, Heck D, Goldowitz D, LeDoux MS, Homayouni R. Dab2IP GTPase activating protein regulates dendrite development and synapse number in cerebellum. PLoS One. 2013;8(1):e53635.
48. Cupolillo D, et al. Autistic-like traits and cer-ebellar dysfunction in Purkinje cell PTEN knock-out mice. Neuropsychopharmacology. 2016;41(6):1457–1466.
49. Backman SA, et al. Deletion of Pten in mouse brain causes seizures, ataxia and defects in soma size resembling Lhermitte-Duclos disease. Nat
Genet. 2001;29(4):396–403.
50. Kwon CH, et al. Pten regulates neuronal soma size: a mouse model of Lhermitte-Duclos dis-ease. Nat Genet. 2001;29(4):404–411. 51. Vojtek AB, et al. Akt regulates basic
helix-loop-helix transcription factor-coactivator complex formation and activity during neuronal differen-tiation. Mol Cell Biol. 2003;23(13):4417–4427. 52. Bonaglia MC, et al. Genotype-phenotype
55. Dale RC, Grattan-Smith P, Nicholson M, Peters GB. Microdeletions detected using chromosome microarray in children with suspected genetic movement disorders: a single-centre study. Dev
Med Child Neurol. 2012;54(7):618–623.
56. Guyenet SJ, Furrer SA, Damian VM, Baughan TD, La Spada AR, Garden GA. A simple com-posite phenotype scoring system for evaluating mouse models of cerebellar ataxia. J Vis Exp. 2010;(39):1787.
57. Bonetto A, Andersson DC, Waning DL. Assess-ment of muscle mass and strength in mice.
Bonekey Rep. 2015;4:732.
58. zur Nedden S, Doney AS, Frenguelli BG. Modulation of intracellular ATP determines adenosine release and functional outcome in response to metabolic stress in rat hippocampal slices and cerebellar granule cells. J Neurochem. 2014;128(1):111–124.
59. zur Nedden S, Tomaselli B, Baier-Bitterlich G. HIF-1α is an essential effector for purine
nucleoside-mediated neuroprotection against hypoxia in PC12 cells and primary cerebellar gran-ule neurons. J Neurochem. 2008;105(5):1901–1914. 60. Galun M, Basri R, Brandt A. Multiscale edge
detection and fiber enhancement using differ-ences of oriented means. In: IEEE internation-al conference on computer vision, 2007. http:// ieeexplore.ieee.org/document/
4408920/. Accessed April 6, 2018.
61. Rishal I, et al. WIS-NeuroMath enables versatile high throughput analyses of neuronal processes.
Dev Neurobiol. 2013;73(3):247–256.
62. Benedetti B, Benedetti A, Flucher BE. Loss of the calcium channel β4 subunit impairs parallel fibre volley and Purkinje cell firing in cerebellum of adult ataxic mice. Eur J Neurosci. 2016;43(11):1486–1498.
![Figure 1. Pkn1mark distal and perisomatic varicosities of VGlut2-stained CFs. Scale bar: 50 animals per group] and GluD2/tubulin ratio (P15 animals](https://thumb-us.123doks.com/thumbv2/123dok_us/9422849.445583/4.585.36.545.54.378/figure-perisomatic-varicosities-vglut-stained-animals-tubulin-animals.webp)

![Figure 4. siRNA-mediated Akt10 from 3–5 litters per group]. Axons were stained with TAU](https://thumb-us.123doks.com/thumbv2/123dok_us/9422849.445583/7.585.45.540.56.453/figure-sirna-mediated-akt-litters-group-axons-stained.webp)
![Figure 7. Adult Pkn1correction, n= 0.1352, and from 4–6 litters per group]. Data are presented as mean percentage](https://thumb-us.123doks.com/thumbv2/123dok_us/9422849.445583/10.585.41.540.53.447/figure-adult-correction-litters-group-data-presented-percentage.webp)
