A New Partitioning Method in Frequency Analysis
of the Retinal Images for Human Identification
*
Masoud Sabaghi, S. Reza Hadianamrei, Ali Zahedi, Maziyar Niyakan Lahiji
Nuclear Science and Technology Research Institute (N.S.T.R.I), Tehran, Iran.
Email: {msabaghi, rhadian}@aeoi.org.ir, [email protected], [email protected]
Received August 8th, 2011; revised September 10th, 2011; accepted September 25th, 2011.
ABSTRACT
Retinal image is one of the robust and accurate biometrics methods to recognize a person. In this article we present a new biometric identification system based on Fourier transform and angular partitioning of the spectrum. In this method, at first, the optical disc is localized using template matching technique and used for rotating the retinal image into the reference position. It compensates the rotation effects which might occur during the scanning process. Fourier transform coefficient and angular partitioning of these coefficients are used for the purpose of feature definition in our method. The extract features are rotation invariant and robust against noise. Finally we employ Euclidean distance for feature matching. The proposed algorithm was tested using 40 images from DRIVE database and experimental results showed the efficiency of the proposed algorithm for the identification of retinal images with noise and rotation.
Keywords: Biometric, Retina, Image Processing, Frequency Analysis, Partitioning
1. Introduction
Biometric is the use of distinctive biological or behave- ioral characteristics to identify people. Biometric systems are now being used in large national and corporate secu- rity projects, and their effectiveness rests on an under- standing of biometric system and data analysis [1]. Some of the common identifications method include: voice, fingerprint, face, hand geometry, facial thermo gram, iris, retina [2]. Little changes in vessels’ pattern during the lifetime, high security, more reliability and stability are the important features which exist in retinal image [2,3]. These traits make retina as a robust approach in person identification. Different algorithms have been utilized for human identification. In [4] vessels’ pattern is extracted and then 2 level Daubechies wavelet is used for decom- position and extraction of wavelet energy as a feature. In [5] we presented an approach based on localizing the optical disc using Haar wavelet and active Contour mo- del which is used for rotation compensation. Ten we used Fourier-Mellin transform coefficients and complex mo- ment magnitudes of the rotated retinal image for feature definition. In [3] vessel’s pattern is extracted and the vessels in the vicinity of optical disc is selected, and then whit (or with?) polar transformation the vessels in Carte- sian coordinate trans form into the polar coordinate.
Multi scale analysis was used for separating the vessels into the groups of large, medium and small. Finally, the angle between the vessel and the horizontal axis is calc- ulated for feature vector construction. Ortega et al. [6] used a fuzzy circular Hough transform to localize the optical disc in the retinal image. Then, they defined feat- ure vectors based on the ridge endings and bifurcations from vessel obtained from a crease model of the retinal vessels inside the optical disc. For matching, they ado- pted a similar approach as in [7] to compute the parame- ters of a rigid transformation between feature vectors which gives the highest matching score. This algorithm is more computationally efficient in comparison with the algorithm presented in [7]. However, the performance of the algorithm has been evaluated using a very small dat- abase including only 14 subjects.
As mentioned before, pre-processing based on blood vessel extraction increases the computational cost of the algorithm. In this paper, a new robust feature extraction method without any pre-processing phase has been pro- posed to reduce computational time and complexity. This proposed method is based on angular partitioning of the frequency spectrum information of retinal image by a new special structure. In our method, we have used angular partitioning with the special structure on magnitude and phase spectrum of retinal image for feature extraction.
ribes the Anatomy of the retina. In Section 3, the method for localizing the optic disc and removing rotation effect is discussed. Sections 4 represents Fourier transform coe- fficient and partitioning this coefficient to obtain feature vector. Experimental results appear in Section 5 and we conclude the paper in Section 6.
2. Retinal Anatomy
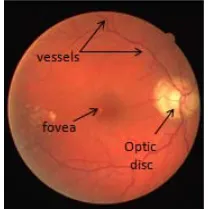
The retina is a multi-layered sensory tissue that lines the back of the eye. It contains millions of photoreceptors that capture light rays and convert them into electrical impulses. These impulses travel along the optic nerve to the brain where they are turned into images. Optic disc is brighter than the other parts of the retina and is normally circular in shape and has a diameter of almost 3 mm. It is also the entry and exist point for nerves entering and leaving the retina to and from the brain. Fovea or the “yellow spot” is a very small area at the center of retinal that is most sensitive to light and is responsible for our sharp central vision [5]. Blood vessels are continuous pa- tterns with little curvature, branch from optic disk and have tree shape on the surface of retina. The mean diam- eter of the vessels is about 250 μm [3]. Figure 1 shows the surface anatomy of retina.
3. Compensation of Undesired Rotation
Before Because of anatomic movement during imaging process, some rotation occurr in retinal images. These rotations cause some problem in feature extraction and matching phase of retinal image recognition. To achieve a robust method, rotation compensation is needed. [image:2.595.332.528.247.302.2]To determine the rotation angle of the retinal image, at first, optical disc has been localized by template match- ing technique. Template matching is a technique in digi- tal image processing for finding small parts of an image which match a template image. The basic method of template matching uses a correlation mask (template), tailored to a specific feature of the search image, which we want to detect. In this case, the template is the optic disc and the search image is the green part of retinal im- age. For this purpose, the green plane of retinal image is used and a template image is considered. The template
Figure 1. Retinal anatomy.
image is constructed by selecting a rectangular region around the optical disc. The template is generated by av- eraging rectangular region containing OD in our retinal image database [3]. Retinal image is correlated to the template image to find the brightest region in the retina, as shown in Figure 2. This point is an approximation of the center of the optical disc position [8].
In the second step, the center of the optical disc and the image center of the mass are used to determine the re- quired rotation angle and then the undesired rotation of the scanned image of retina is compensated by applying the opposite rotation. To locate the image center of the mass for an M N image, the following equation is used:
1 1 1 1 , , M N x y M N x yxf x y
x
f x y
1 1 1 1 , , M N x y M N x yyf x y
y
f x y
(1)After the localization of OD and the center of mass points, we calculate the angle between the baseline and the line passing these two points as shown in Figure 3. We then compensate for the rotation by applying the op-posite rotation into input image.
4. Feature Extraction
After Our proposed feature extraction method is based on Fourier transform of retinal images and a special parti-tioning of Fourier spectrum. The block scheme for fea-ture extraction of retinal image is shown in Figure 4. First, without any preprocessing, Fourier transform has been applied to raw retinal images. Two-dimensional discrete Fourier transform of input image is calculated using the following equation [9]:
1 1
2π0 0
1
, M N , e j ux M vy N
x y
F u v f x y
MN
(2)Where f(x,y) is image intensity of size M N and the variable u and v are the frequency variables [8]. Fourier spectrum and phase angle are defined as following:
2
2
1/ 2, , ,
F u v R u v I u v (3)
, 1
, , I u vu v tg
R u v
y
(4)Where R(u,v) an I(u,v) are the real and imaginary parts of F(u,v), respectively.
Then we used Fourier spectrum and phase angle in-formation. The Fourier spectrum energy and the sum of the phase angle are, respectively, defined as:
2 2 1 1 2 , l kx l y k
E F x
[image:2.595.120.224.601.706.2]Figure 2. Template matching technique for optical disc lo-calization (a) original image (b) template (c) correlated im-age.
Figure 3. The result of rotation compensation (a) retinal image after localizing the center of mass and optical disc (b) the calculated angle (c) compensation for image rotation.
Figure 4. Complete flow diagram for feature extraction process in the proposed system. (a) Retinal image after ro-tation compensation (b) Fourier spectrum (c) phase angle (d) partitioning the Fourier spectrum and phase angle (e) cal-culate energy of Fourier spectrum and the sum of the phase angle in per partition (e) future vector construction.
So the feature vector is as:
(E,) (6) The energy spectrum and the sum of the angles reflect the strength of the images’ details in different frequen-cies. The details of retinal images are in the blood ves-sels.
As we mentioned above, the vectors computed from “Equation (6)” are global features of a blood vessel. These features extracted from the whole images do not preserve the information concerning the special location of different details, so their ability to describe a retina is weak [4].
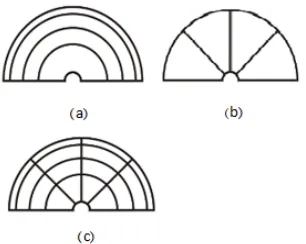
To solve this problem, we introduce a new partitioning based on dividing the Fourier spectrum and phase angle into several half circles with the same centre which is the centre of spectrum that include segments with same area and same degree arc as shown in Figure 5. Purposed partition in this method (Figure 5(c)) includes a combi-nation of two partitions shown in Figure 5(a) and Figure 5(b). As shown in Figure 5(a), the spectrum and phase angle are divided into different ranges of high and low frequency information. Whereas the thick vessels are of low frequency patterns and the thin vessels are of high frequency patterns, thus this partitioning shows the crite-rion of the thickness of the vessels, and while Figure 5(b) that includes the same frequency range, has information about vessels in different directions, Figure 5(c) has in-formation about the thickness and the direction of the vessels.
The pixels near the centre of the spectrum are of no value because these pixels include only low frequency information of the image that depends on average gray level of the image. Also the pixels that have a distance of more than 105 pixels from the centre of the spectrum do not carry any useful information. Because of the symm- etrical property of the spectrum, partitioning for feature extraction only includes the upper half circle of the spec- trum and the lower half circle have been neglected to decrease the dimension of feature vector.
2 2
1 1
2
,
l k
x l y k
E F x y
u v,
The magnitude spectrum and phase angle of image were divided into N parts with the same area called parti- tion as described previously. The radius of the selected half circle ranged from 5 to 105 pixels. The number of the partitions can be varied for the best result. After par- titioning the spectrum image of the retina, the energy and sum of the phase angle of each partition was used for constructing the feature vector. Finally, the vector is no- rmalized by total energy and sum of the phase. This no- rmalized vector is named Fourier spectrum and phase Feature (FSPF). Our proposed identification system in-cludes the following phases. In the registration phase of the persons, a number of images are scanned from each person, then after rotation compensation of the captured retinal image, FSPF of all image are extracted and regis-tered in a Data Base.
Figure 5. Partitioning process. (a) Partitioning for selecting the different ranges of frequency information. (b) Parti-tioning for vessels information in different direction. (c) Final partition includes the combination of the partitions in Figures 5(a) and (b).
5. Experimental Results
The proposed algorithm was tested on a database of 160 retinal images from 40 subjects. For each subject we use 4 images. First image is noisy one and two next images were rotated images by a random angle. White Gaussian noise is added to the original images to generate a noisy image and the 4th image is a noisy and rotated one. Im- ages are green channel of input color image. To employ the proposed method, each Fourier spectrum and phase angle of retinal image included 4 nested half circles and each half circle was divided into parts with 45 degree angle, and therefore, each spectrum of the retinal image was divided into 16 parts and feature vector had 32 ele- ment. These numbers of partitions were selected after making 8, 12, 16, 24 partitions.
[image:4.595.96.249.88.210.2]The proposed method is evaluated by a test routine as follow: Euclidean distance between each retinal feature vector and all of the others in feature vector data base were calculated. Identified person is determined as corr- esponding a minimum distance. To evaluate the rejection ability of the proposed method, we import 20 images from STARE database [10] and 16 images from personal database as reject data, and the system recognizes this entire image as rejects data. Figure 6 shows in-class and out-class histograms to determine this system reliability. The accuracy of the identification process is presented in Table 1. According to the results in table I, we can see the average identification rate with amplitude and phase partitioning is better than amplitude partitioning.
6. Conclusions
In this article, a method is proposed for human identi-fication system based on retinal image processing, using new special partitioning for amplitude and phase of Fou- rier transform. This approach is robust to rotation and noise. In addition, it is simple and has low computational
0 0.01 0.02 0.03 0.04 0.05 0.06 0.07 0.08 0
100 200 300 400 500 600 700 800 900
DISTANCE
P
R
O
B
A
B
IL
IT
Y
D
E
N
S
IT
Y
AMPLITUDE & PHASE
GENUINE
IMPOSTOR
[image:4.595.307.539.295.343.2]Figure 6. In-class and out-class histograms.
Table 1. Comparison between results of identification.
Identification Noise (20 db)
Average identification rate with amplitude
partitioning
Average identification rate with amplitude and phase
partitioning without noise 96% 100%
with noise 92% 100%
complexity. Feature vector generated in this method has useful information about vessel density and vessels di-rection in the image.
REFERENCES
[1] T. Dunstone and N. Yager, “Biometric System and Data Analysis,” Springer, New York, 2008, pp. 529-548.
[2] S. Nanavati, M. Thieme and R. Nanavati, “Biometrics Identity Verification in a Networked World,” John Wiley & Sons, Inc., New York, 2002.
[3] H. Farzin, H. A. Moghaddam and M. S. Moin, “A Novel Retinal Identification System,” EURASIP Journal on Advances in Signal Processing, Vol. 2008, 2008, Article
ID: 280635.
[4] M. Shahnazi, M. Pahlevanzadeh and M. Vafadoost, “Wavelet Based Retinal Recognition,” 9th International Symposium on Signal Processing and Its Applications
(ISSPA), Sharjah, February 2007, pp. 1-4.
[5] H. Tabatabaee, A. Milani-Fard and H. Jafariani, “A Novel Human Identifier System Using Retina Image and Fuzzy Clustering Approach,” Proceedings of the 2nd IEEE In-ternational Conference on Information and Communica-tion Technologies (ICTTA06), Damascus, April 2006, pp.
1031-1036.
[6] M. Ortega, C. Marino, M. G. Penedo, M. Blanco and F. Gonzalez, “Biometric Authentication Using Digital Reti-nal Images,” Proceedings of the 5th WSEAS International Conference on Applied Computer Science (ACOS06),
Hangzhou, April 2006, pp. 422-427.
Learning and Cybernetics (ICMLC05), Guangzhou,
Au-gust 2005, pp. 4493-4498.
[8] R. C. Gonzalez and R. E. Woods, “Digital Image Proc-essing,” Pearson Education Inc., New Delhi, 2003, pp. 548-560.
[9] J. Staal, M. D. Abramoff, M. Niemeijer, M. A. Viergever and B. van Ginneken, “Ridge-Based Vessel Segmentation in Colorimages of the Retina,” IEEE Transactions on
Medical Imaging, Vol. 23, No. 4, 2004, pp. 501-509. doi:10.1109/TMI.2004.825627
[10] A. Hoover, V. Kouznetsova and M. Goldbaum, “Locating Blood Vessels in Retinal Images by Piecewise Threshold Probing of a Matched Filter Response,” IEEE Transac-tions on Medical Imaging, Vol. 19, No. 3, 2000, pp.