ISSN Print: 2153-1234
DOI: 10.4236/jis.2019.101001 Dec. 4, 2018 1 Journal of Information Security
Implementation of Network Intrusion
Detection System Using Soft Computing
Algorithms (Self Organizing Feature Map and
Genetic Algorithm)
Joël T. Hounsou, Thierry Nsabimana, Jules Degila
Institut de Mathématiques et de Sciences Physiques, Porto-Novo, Benin, Université d’Abomey Calavi
Abstract
In today’s world, computer network is evolving very rapidly. Most public or/and private companies set up their own local networks system for the purpose of promoting communication and data sharing within the compa-nies. Unfortunately, their data and local networks system are under risks. With the advanced computer networks, the unauthorized users attempt to access their local networks system so as to compromise the integrity, confi-dentiality and availability of resources. Multiple methods and approaches have to be applied to protect their data and local networks system against ma-licious attacks. The main aim of our paper is to provide an intrusion detec-tion system based on soft computing algorithms such as Self Organizing Fea-ture Map Artificial Neural Network and Genetic Algorithm to network intru-sion detection system. KDD Cup 99 and 1998 DARPA dataset were employed for training and testing the intrusion detection rules. However, GA’s tradi-tional Fitness Function was improved in order to evaluate the efficiency and effectiveness of the algorithm in classifying network attacks from KDD Cup 99 and 1998 DARPA dataset. SOFM ANN and GA training parameters were discussed and implemented for performance evaluation. The experimental results demonstrated that SOFM ANN achieved better performance than GA, where in SOFM ANN high attack detection rate is 99.98%, 99.89%, 100%, 100%, 100% and low false positive rate is 0.01%, 0.1%, 0%, 0%, 0% for DoS, R2L, Probe, U2R attacks, and Normal traffic respectively.
Keywords
SOFM, Intrusion Detection Systems, False Positive Rate, Detection Rate, KDD Cup 99, GA
How to cite this paper: Hounsou, J.T., Nsabimana, T. and Degila, J. (2019) Im-plementation of Network Intrusion Detec-tion System Using Soft Computing Algo-rithms (Self Organizing Feature Map and Genetic Algorithm). Journal of Information Security, 10, 1-24.
https://doi.org/10.4236/jis.2019.101001
Received: October 14, 2018 Accepted: December 1, 2018 Published: December 4, 2018
Copyright © 2019 by authors and Scientific Research Publishing Inc. This work is licensed under the Creative Commons Attribution International License (CC BY 4.0).
DOI: 10.4236/jis.2019.101001 2 Journal of Information Security
1. General Introduction
In computer security field, an attacker or a hacker can be understood as an un-authorized user attempts to penetrate the security defenses and gain access to the network system in order to violate the integrity, confidentiality and availability of resources. The hackers constantly invent new attacks and disseminate them over the internet [1]. Securing network is a delicate step to protect a company from the most common risks emanating from the Internet as well as from its own local network system. To prevent attacks or to reduce their severity, many solutions exist but no one can be considered satisfactory and complete [2].
An Intrusion Detection System (IDS) is currently a powerful tool used in many companies, institutions, universities and so for to protect their computer systems or/and computer networks from dangerous risks. It is divided into two parts such as Host based IDS and Network based IDS. Network based IDS mon-itoring all the traffic packets incoming and outgoing through the Internet, whe-reas Host based IDS is deployed locally on each host computer and monitoring only the host on which it is installed [3]. And then, there are two general catego-ries of IDSs [4]: misuse detection and anomaly based. Misuse detection systems are most widely used and they detect intruders with known patterns. The signa-tures and patterns used to identify attacks consist of various fields of a network packet, like source address, destination address, source and destination ports or even some key words of the payload of a packet. These systems exhibit a draw-back in the sense that only the attacks that already exist in the attack database can be detected, so this model needs continuous updating, but they have a virtue of having very low false positive rate. Anomaly detection systems identify devia-tions from normal behaviour and alert to potential unknown or novel attacks without having any prior knowledge of them. They exhibit higher rate of false alarms, but they have the ability of detecting unknown attacks and perform their task of looking for deviations much faster.
Self Organizing Feature Map Artificial Neural Network (SOFMANN) is un-supervised learning algorithm. For that reason, no human assistance needed during the training process. It is used in varied domains like in computer secu-rity as detector module. It can detect both known and novel attacks. Each sample data point from the input data space is shown in parallel to all the neurons in the SOM, and the winner is chosen to be the neuron that responds best [5]. It is a delicate algorithm used for visualization and presentation of complex data. It converts the input nodes from high dimensional to the low dimensional output nodes (1-D, 2-D or 3-D).
DOI:10.4236/jis.2019.101001 3 Journal of Information Security
process performed in nature, i.e. crossover and mutation [6].
GA is chosen because of some of its nice properties, e.g., robust to noise, no gradient information is required to find a global optimal or sub-optimal solu-tion, self-learning capabilities, etc. Using GAs for network intrusion detection has proven to be a cost-effective approach [7] [8] [9] [10]. Moreover, Self Orga-nizing Feature Maps (SOFM) is chosen among the soft computing algorithms because it is proven technique for automated clustering and visual organization and anomaly detection in IDS.
Our main aim is to provide an intrusion detection system based on soft com-puting algorithms such as Self Organizing Feature Map Artificial Neural Net-work and Genetic Algorithm to netNet-work intrusion detection system so as to clas-sify four categories of network attacks including normal traffic namely DOS, Probe, R2L, U2L and Normal. KDD Cup 99 and 1998 DARPA dataset were ap-plied for training and testing the intrusion detection rules. The traditional Fit-ness Function of Genetic Algorithm was also improved for performance evalua-tion. The experimental results shown good detection rate and law false positive rate for different attack types trained and tested with SOFM, whereas GA has maintained very high detection rate for different attack types but with high false positive rate which leads to very poor accuracy of anomaly detection system.
The main contribution of this work is to demonstrate the performance of the SOFM artificial neural network compared with the GA in the detection rate comparison of different attack types, including normal traffic.
The remainder of the paper is articulated into seven sections: Section 2 dis-cusses problem statement. Section 3 presents a brief overview of Self Organizing Feature Map Artificial Neural Network (SOFMANN) and Genetic Algorithm (GA). Section 4 describes related works. Section 5 demonstrates our proposed Network Intrusion Detection System Framework. Section 6 presents the experi-mental results and Section 7 presents the conclusion and future work.
2. Problem Statement
DOI: 10.4236/jis.2019.101001 4 Journal of Information Security
of anomaly detection system and high false negative rate generated by Misuse or Signature detection method due to the inability of detecting unknown attacks.
3. Brief Overview of Self Organizing Feature Map Artificial
Neural Network and Genetic Algorithm
3.1. Brief Overview of Self Organizing Feature Map Artificial
Neural Network
Self Organizing Feature Map is a type of neural network. Neural network is clas-sified into two types of learning namely unsupervised and supervised learning. Unsupervised learning comprises two categories of Algorithms namely Self Or-ganizing Feature Map (SOFM) and Adaptive Resonance Theory (ART), whereas Supervised learning comprises Radial Basis Function (RBF) and Multi Layer Perceptron Algorithms. The SOFM is an unsupervised learning algorithm be-cause no human assistance needed during the learning process. The main role of the SOFM is to transform high dimensional of the input vector randomly chosen to low dimensional (1-D or 2-D). The SOFM algorithm is first developed by Teuvo Kohonen, Finnish Professor in 1982 known as Kohonen SOFM. It is de-signed for visualization and representation of huge amount of data, where hu-man brain can easly undastand. And then, the structure of the SOFM is a single feed forward network [11], where each input vector is directory connected to each neuron in the Map. But the neurons in the Kohonen Map are not linked to each other. The number of the input dimensions is usually higher than the out-put dimensions. It is used in various applications namely image processing, voice recognition, speech recognition, spatial data mapping, data compression, pattern recognition, text mining and so on [12].
The Self Organizing Feature Map is a competitive learning algorithm, where each neuron in the Map competes so that the neuron which responds better is selected as the Best Matching Unit (BMU) or winning neuron. The neurons which are around the winner, is called neighborhood. The weights of the neu-rons close to the winning neuron are also adjusted but the magnitude of the change depends on the physical distance from the winning neuron and it is also decreased with the time [13]. Six stage of the learning process are listed and briefly described below:
Stage 1: Each neuron’s weights in the network of x dimension is randomly
initialized;
Stage 2: The randomly selected input vectors from huge amount of training datasets are fred to SOFM network;
Stage 3: The Euclidean Distance between the input vectors and neuron’s
weights are computed to determine the winning neuron or Best Matching Unit (BMU).
DOI:10.4236/jis.2019.101001 5 Journal of Information Security
with the weight vector closest to the input vector is labeled as BMU [14]. To do that, we have two points such as I I I
(
1, , ,2 In)
known as input vector and(
1, , ,2 n)
W W W W known as weight vector of each neuron. The Euclidean Dis-tance is computed as follows:
(
) (
2)
2(
)
21 1 2 2
n n n n
D= I W− = I W− + I W− ++ I W− (1)
Stage 4: The radius of the neighborhood closer to the winning neuron or
BMU has the chance to be computed but the farthest one from the Best Matching Unit has no chance to be calculated.
The size of the neighborhood decreases progressively with n Epoch. All of the neurons around this radius are labeled neighbors of the winning neuron. To de-termine the neighborhood in the SOFM network which are closer the BMU, ra-dius must be computed as follows:
( )
0exp(
)
r t =r −t
λ
(2)where r(t) means the width of the lattice in time t, r0 means the width of the
lattice in time t0, t means a time or an iteration of the epoch and
λ
means aconstant time t (current time).
Stage 5: Both the Best Matching Unit neuron and its neighborhood weights
are adjusted in order to respond better. The closest neurons within the neighborhood are more adjusted than the furthest neurons;
(
1)
( )
( ) ( ) ( )
(
( )
)
W t+ =W t + Θ t K t I t −W t (3)
where t means the time and K means the learning rate at time t, which decreases progressively in time. And then, the weight at time t + 1 is set to neighborhood nodes from the current instant weight W(t), plus a fraction K(t), the difference between the current weight of “W(t)” neuron and the input vector called I(t), adjusted (theta) based on distance from the BMU [15].
In Equation (3) the learning rate at time t can be calculated using an exponen-tial decay function.
( )
0exp(
)
K t =K −t
λ
(4)In Equation (3), represents the amount of influence that the distance from one node to the BMU has on their learning, in the current time instant is calculated using Gaussian curve [15].
( )
t exp(
D2 2r t2( )
)
Θ = − (5)
where D is a distance from one neuron to the winning neuron and r is the radius of the neighborhood. The function also decreases progressively in time.
Stage 6: Go to Stage 2 if the number of epochs is not reached.
3.2. Brief Overview of Genetic Algorithm
Genetic Algorithm is an optimization technique using an evolutionary process
DOI: 10.4236/jis.2019.101001 6 Journal of Information Security
where initial population is randomly generated. Each population is now eva-luated to find out the best results based on the predefined criteria. For that rea-son, the fitness value of each population or chromosomes are determined using the Fitness Function. The best fitness values are kept and the worst are prunned from the top list. The best individual populations are selected and undergo crossover and mutation to reproduce new children. This new children knwon as new population is applied for the next generation. The process continues until the number of generations or epochs has been terminated. Figure 1 showed the Genetic Algorithm process.
As displayed in Figure 1, Genetic Algorithm (GA) consists of three operators namely selection, crossover or recombination and mutation.
3.3. Data Structure
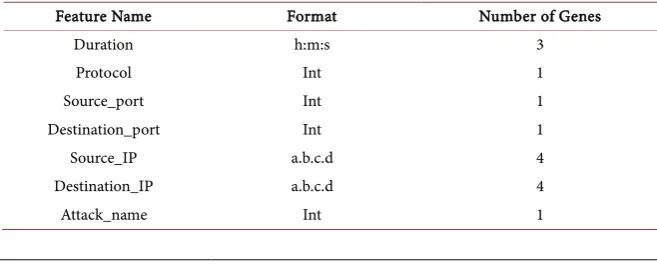
[image:6.595.269.476.363.559.2]In Genetic Algorithm data structure is represented as chromosome. The rules to match the attacks are randomly generated and are encoded as an integer array with seven attributes, as displayed in Table 1. The first six attributes of the chromosome match the condition A of an attack. The seventh attribute identifies the attack type that the first six attributes identify when they match. The same data representation is also used by Ms.Lata Jadhav [16].
Figure 1. Genetic algorithm diagram.
Table 1. Selected attributes.
Feature Name Format Number of Genes
Duration h:m:s 3
Protocol Int 1
Source_port Int 1
Destination_port Int 1
Source_IP a.b.c.d 4
Destination_IP a.b.c.d 4
[image:6.595.208.537.608.742.2]DOI:10.4236/jis.2019.101001 7 Journal of Information Security
Before evaluating the individual population from training dataset, the rules to match the attack types must be constructed correctly in order to classify suc-cessfull abnormal behaviours and normal traffic. And thus, Too many wildcards in the constructed rules are forbidden because they sometime block the connec-tions and lead to very poor accuracy. The gene representation follows the simple rule if A then B, where if the first six attributes are logically and-ed together are true (A), then the rule matches the attack (B) [16]. The rule used to classify net-work connection in training data as well as U2R attack rlogin is explained below:
if (Duration = “0:0:14” and Protocol = “rlogin” and Source_port = 1022 and Destination_ port = 513 and Source_ip = “192.168.1.30” and Destination_ip = “192.168.0.20”) then Attack_name = “rlogin”.
The above rule shows that if a network packet is originated from source IP address 192.168.1.30 and source port 1022, and sent to destination IP address 192.168.0.20 and destination port 513 using the protocol rlogin, and the connec-tion duraconnec-tion is 0:0:14 second, then it is a network attack of type rlogin.
3.4. The Existing and Improved Traditional Fitness Function
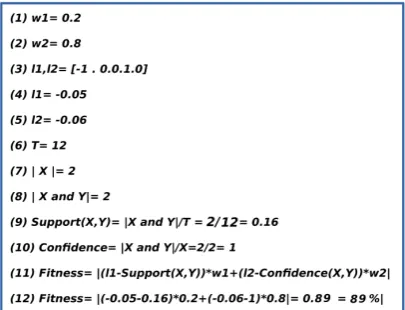
Traditional Fitness Function was defined by Man Leung Wong and Kwong Sak Leung (2000) [17]. It is based on the support-confidence framework and It is a performance measure used to determine the fitness value of individuals in the population. The best individuals in the population are selected according to the predefined fitness value threshhold. The fitness value is evaluated by determin-ing how many attack connections the rule matches [18]. The traditional Fitness Function is built with two weights parameters such as w1 and w2 with default values 0.2, 0.8 respectively. Those weights are used to control the balance be-tween the confidence and support during the training. This traditional Fitness Function generates in one hand the rules with low fitness value and the other hand with good fitness value.
To increase the fitness value of the generated rules, we have proposed two pa-ramaters such as l1 and l2 known as lifts. The lifts l1 and l2, whose values are in the range of [−1.0.0.1.0], are used to increase the fitness value of the rules used in classifying the attack types, and used also to control the balance between the support and confidence. The generated rule with less fitness value has no chance to identify attack types. On the contrary, the rules with high fitness value have the chance in identifying attack types successful. Figure 2 shows the existing traditional Fitness Function, whereas Figure 3 shows the improved traditional Fitness Function. An experimental assessment of this improved traditional Fit-ness Function is presented in Section 6.1.
1) The existing traditional Fitness Function:
N: Total number of network connection rules in the training dataset; |A|: Number of rules match the condition A;
DOI: 10.4236/jis.2019.101001 8 Journal of Information Security
Figure 2. Existing traditional fitness function perfomed on support-confidence and weights.
Figure 3. The improved traditional fitness function perfomed on support-confidence, weights and lifts.
2) The Improved traditional Fitness Function
T: Total number of connection rules in the training dataset; |X|: Number of connections matching the condition X; |X and Y|: Connection matching rule if X then Y;
w1, w2: weights used to balance or control two terms: support and confi-dence;
l1, l2: lifts used to increase the fitness value of rules and to balance the sup-port-confidence. lift values is in the range of [−1.0.0.1.0].
Table 2 displays a sample of a population individual rule t matching against a training dataset. We need to compute the fitness value using the two formulas carried out on Figure 2 and Figure 3. And thus, the training data and popula-tion individual rule t are displayed on Table 2. The condition part of the first 14 network features of the rule 4 and 11 in the training data match a population in-dividual t. Moreover, the rule of 4 and 11 match the outcome part of 15 network features, where It indicates the classification of attack type.
The obtained results trained with the existing traditional Fitness Function is displayed on Figure 4 and the obtained results trained with the improved tradi-tional Fitness Function is shown on Figure 5.
However, after computation of fitness value using both formulas, the fitness value of 90.6% found using the improved traditional Fitness Function is greater than the fitness value of 83.2% obtained using the existing traditional Fitness Function. It was concluded that the best population individual’s fitness value obtained from the improved traditional Fitness Function has chance to identify attack types successfully. For that reason, this improved trational Fitness Func-tion will be applied in our experiments to generate best rules used in identifying malicious attacks from the KDD Cup 99 and 1998 DARPA dataset.
3.5. Crossover and Mutation Operators
DOI:10.4236/jis.2019.101001 9 Journal of Information Security
[image:9.595.272.475.254.409.2]Figure 4. Computation of fitness value for population individual rule t trained with the existing traditional Fitness Function.
Figure 5. Computation of fitness value for population individual rule t trained with the improved traditional Fitness Function.
Table 2. Sample of a population individual rule t matching against a training dataset.
ID DURATION PROTOCOL SRC PORT PORT DST SRC IP DST IP ATTACK NAME
H M S 0 1 2 3 0 1 2 3
1 0 1 126 telnet 1754 23 192 168 1 30 192 168 0 20 - 2 0 0 0 htp 1784 80 192 168 1 30 192 168 0 40 phf 3 0 0 0 finger 240 79 192 168 1 30 192 168 0 40 port-scan 4 0 0 14 rlogin 1022 513 192 168 1 30 192 168 0 20 rlogin 5 0 0 2 rsh 1023 1021 192 168 1 30 192 168 0 20 rcp 6 0 0 38 telnet 1042 23 192 168 1 30 192 168 0 20 - 7 0 0 1 smtp 43494 25 192 168 0 40 192 168 1 30 - 8 0 0 1 smtp 43493 25 192 168 0 40 192 168 1 30 - 9 0 1 1 telnet 1769 23 192 168 1 30 192 168 0 20 - 10 0 0 22 telnet 1906 23 192 168 1 30 192 168 0 20 guess 11 0 0 14 rlogin 1022 513 192 168 1 30 192 168 0 20 rlogin 12 0 0 4 telnet 1914 23 192 168 1 30 192 168 0 20 telnet
Population Individual rule
[image:9.595.204.538.474.747.2]DOI: 10.4236/jis.2019.101001 10 Journal of Information Security
In the crossover operation, the best population individuals undergo crossover operator, where population individuals randomly selected involved in swapping genes of two parents with one an another to form two new children from each pair of parents. Crossover probability for a pair of parents were used in our ex-periments for performance evaluation of our implemented system. In Genetic Algorithm, there are three categories of crossover namely one point crossover, two point crossover and uniform crossover. Two point crossover technique will be used in our experiments. Figure 6 shows a sample of crossover operator.
2) Individual Mutation Operator
Mutation operator participates in modifying one or more genes value of single population individual due to the repeated use of crossover operator. For our ex-periment, mutation probability was employed. Figure 7 shows a sample of mu-tation operator carried out on single population individual.
4. Related Work
[image:10.595.212.535.459.562.2]An Intrusion Detection System is a powerful tool used to secure company’s data from risks emanating from the public Internet as well as from their own local network system. Too many papers based on an IDS were published and some contributions were given. And thus, multiple soft computing algorithms were also used to support an Intrusion Detection System for reducing False Negative rate and False Positive rate generated by Anomaly detection method and Signa-ture detection method. Most of them are Genetic Algorithms, Self Organizing Feature Maps Neural Network, Fuzzy Logic and so for. When used for intrusion detection, soft computing is a general term for describing a set of optimization and processing techniques that are tolerant of imprecision and uncertainty [19].
Figure 6. Crossover operator carried out on two parents to generate two new children.
[image:10.595.212.537.597.706.2]DOI:10.4236/jis.2019.101001 11 Journal of Information Security
In 2012, Xueying Jiang and Kean Liu [20] described some of the issues of SOM neural network algorithm such as: false alarm rate, false negative rate, training time and give an improved anomaly detection SOM algorithm. They also give the intelligent detection model and the model of the training module, designed the main realization of FPSOM neural network algorithm. The simula-tion experiments were carried out in KDDCUP data sets. In 2009, E. J. Palomo, E. Domnguez, R. M. Luque, and J. Muoz [21] proposed a neural network model based on self organization for detecting intrusions. Growing Hierarchical SOM (GHSOM) was proposed to addresse the limitations of the SOM related to the static architecture of this model. KDD Cup 1999 benchmark was used for train-ing the proposed GHSOM. In 2015, EMIRO DE LA HOZ FRANCO and ANDRES ORTIZ GARCIA [14] provided an implementation of an Intrusion Detection System based on Self Organizing Map and identified a methodology to validate the effectiveness of an Intrusion Detection Systems proposed in three phases (selection, training and classification) using FDR to feature selection and Self Organizing Maps to training-classification. In 2014, Kruti Choksi and Prof. Bhavin Shah [5] presented a survey which focused on IDS using Self Organizing Map and their survey shows that the existing IDS based on SOM have poor de-tection rate for U2R and R2L attacks. To overcome these issues, the improve-ment should be conducted. The normalization technique should be used to im-prove it. During the survey they also found that HSOM and GHSOM are ad-vance model of SOM which have their own unique feature for better perfor-mance of IDS. In 2009, M. Bahrololum, E. Salahi and M. Khaleghi [22] proposed a new approach to design the system using a hybrid of misuse and anomaly de-tection for training of normal and attack packets respectively and the combina-tion of unsupervised and supervised Neural Network (NN) for Intrusion Detec-tion System were used. By the unsupervised NN based on Self Organizing Map (SOM), attacks will be classified into smaller categories considering their similar features. In 2006, Liberios VOKOROKOS and Anton BAL [23] present intrusion detections systems and design architecture of intrusion detection based on neur-al network self organizing map and described base problematic of neurneur-al net-work and intrusion detection system. Their net-work deals with specific design of intrusion detection architecture based on user anomaly behavior.
DOI: 10.4236/jis.2019.101001 12 Journal of Information Security
was used for training and testing purpose. Thus, Ms. Lata Jadhav [16], he im-plemented an IDS using Genetic Algorithm approach to derive the set of classi-fication rules from audit data and traditional fitness function with sup-port-confidence framework was used to measure the quality of each rule. The generated rules were used to detect or identify network intrusions. Experimental results show high detection rates based on Benchmark DARPA dataset.
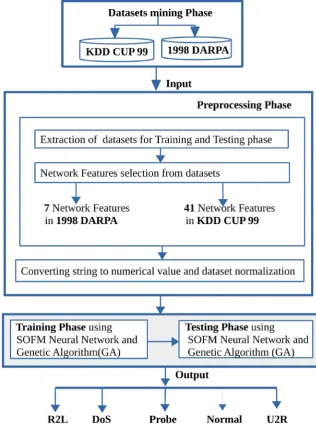
5. Proposed Network Intrusion Detection System
Framework
[image:12.595.212.529.281.711.2]Our proposed Network Intrusion Detection System Framework based on soft computing algorithms (Self Organizing Feature Map Artificial Neural Network and Genetic Algorithm) is split into four phases namely: Datasets mining Phase, Preprocessing Phase, Training and Testing Phase. As displayed in Figure 8.
DOI:10.4236/jis.2019.101001 13 Journal of Information Security
5.1. Datasets Mining Phase
For the first phase of our system, the datasets to be mined with our proposed NIDS are KDD CUP 99 and 1998 DARPA dataset. The KDD CUP 99 is one of the most datasets used to train and to test the intrusion detection rules. The KDD Cup 99 dataset is the subset of 1998 DARPA dataset that was collected by simulation of the operation of a typical USA Air Force Local Area Network (LAN) with multiple attacks classified into four categories: probe, denial of ser-vice, user to root and remote to local. KDD Cup 99 dataset records contain 41 features which fall into four categories: basic, traffic, content and host related ones [25]. And thus, 1998 DARPA Dataset (Defense Advanced Research Projects Agency) was invented in 1998 by MIT Lincoln Labs for the purpose of evaluat-ing intrusion detection systems on offline environment. Moreover, many exist-ing datasets such as KDD 99, DARPA, Kyoto 2006 and other public dataset, are uncontrollable, unmodifiable, and may contain old types of attack [26].
5.2. Preprocessing Phase
Genetic Algorithm (GA) and Self Organizing Feature Maps Neural Network (SOFM) cannot handle symbolic features. For that reason, two subsets training and testing dataset from KDD Cup 99 dataset were picked, the transformation of string to numerical value were carried out, the normalization of the transformed data was done and suitable network features were selected for better accuracy. The preprocessing phase of our proposed system consists of three parts, as can be seen in Figure 8:
Extraction of datasets: Training and testing datasets were picked from KDD
Cup 99 dataset. These two subsets data were used to measure the perfor-mance of GA and SOFM Neural Network in intrusion detection rules.
Converting string to numerical values: The network features containing the
symbolic form named protocol type, Service and Flag were converted to nu-merical values by affecting unique number for each network feature.
Normalization of the numerical values: After conversion to numerical values, we then convert the numerical vector into the binary or normalized (in in-terval [0,1]) [27], this was done 1) to ensure that one feature did not over-power another (for those with large units) and 2) to speed up training and convergence time by using smaller numbers and the precise method is represented by this equation:
( )
(
)
( )
Data_Normalized= X −mean X stddev X (6) where X represents each column in the dataset.
DOI: 10.4236/jis.2019.101001 14 Journal of Information Security
5.3. Training and Testing Phase Using GA and SOFM
The proposed Network Intrusion Detection System based on soft computing al-gorithms SOFM Artificial Neural Network and GA comprises two modules namely Training and testing phase. In the training phase, a set of classification rules are generated from KDD Cup 99 and 1998 DARPA using the SOFM and GA in an offline environment, whereas, in the testing phase, the generated rules are used to classify incoming network connections in the real time environment and once the rules are generated, the intrusion detection is simple and efficient
[6].
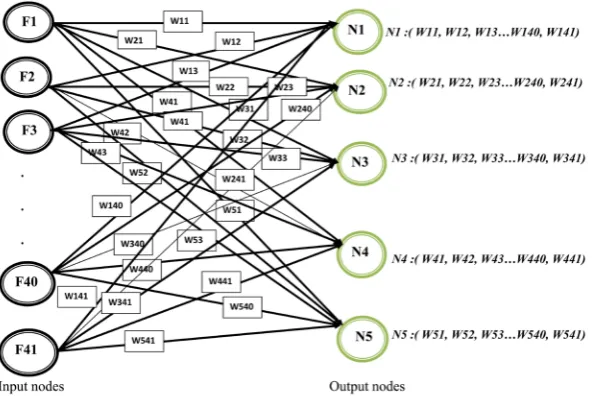
5.4. The Proposed Architecture of SOFM Artificial Neural Network
[image:14.595.227.524.510.708.2]The proposed architecture of Self Organizing Feature Map ANN is displayed in
Figure 9.
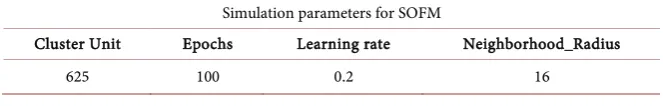
Our proposed architecture of Self Organizing Feature Map artificial neural network consists of two layers namely: an input node and an output node. The input nodes indicates 41 network features from KDD CUP 99 dataset, which are symbolized in short form as F1, F2, F3, ..., F40 and F41 means Feature 1, Feature 2, Feature 3 until Feature 41. In other way, we have 41 dimensions of the input nodes. The output nodes consists of five outputs N1, N2, N3, N4 and N5 known as nodes were to classify five class of attack types including normal traffic name-ly DoS, Probe, R2L, U2L and Normal as classification problem. Each node’s map namely N1, N2, N3, N4 and N5 receives 41 coordinates (w11, w12, w13, ..., w140, w141) and each node’s Map is connected to each input node but node’s Map are not connected to each other in the Kohonen network. The Map dimen-sion was initially set (25,25), epochs were initially set 100, learning rate was in-itially set 0.2 and neighborhood radius was inin-itially set 16. Our proposed SOFM Neural Network was trained for each class of attack types as classification prob-lem in order to evaluate the performance of the algorithm on individual attacks.
DOI:10.4236/jis.2019.101001 15 Journal of Information Security
6. Experimental Results
In this section, we present the obtained results using Genetic Algorithm (GA) and Self Organizing Feature Map Artificial Neural Network trained and tested on KDD Cup 99 and 1998 DARPA. The purpose of our experiments is to show the detection rate, False Positive rate and Classification time comparison for dif-ferent attack types. The experiments were performed on EliteBook 6930p laptop with Intel®coreTM 2 Duo CPU P8600@ 2.40 GHz × 2 and 4 GB of RAM. The
op-erating system was type 64-bit using Debian 9 stretch and hard drive 350 GB. Our system was implemented using Python 2.7.13.
6.1. Performance Measures
To evaluate our system, the two standard metrics of detection rate and false pos-itive rate developed for network intrusions, have been used [6]: Detection rate (DR) is computed as the ratio between the number of correctly detected intru-sions and the total number of intruintru-sions, that is
True Positive DR
False Negative True Positive =
+ (7)
False positive (FP) (also said false alarm) rate is computed as the ratio between the numbers of normal connections that are incorrectly classifies as intrusions and the total number of normal.
False Positive FP
True Negative False Positive =
+ (8)
6.2. Self Organizing Feature Map and Genetic Algorithm Training
Parameters
Table 3 displayed the used Genetic Algorithm training parameters during the traing and testing process of our system. And thus, Table 4 is shown the SOFM training parameters.
6.3. Simulation Outcomes Obtained Using GA and SOFM
[image:15.595.209.536.596.642.2]Our first experiment compares our own solutions generated by our imple-mented GAIDS which applies the improved traditional Fitness Function as
Table 3. GA parameters for performance evaluation.
GA parameters for performance evaluation
w1 w2 Generation number Population size Crossover_Technique
[image:15.595.208.540.676.729.2]0.2 0.8 5000 400 two points crossover
Table 4. Self organizing feature map neural network parameters. Simulation parameters for SOFM
Cluster Unit Epochs Learning rate Neighborhood_Radius
DOI: 10.4236/jis.2019.101001 16 Journal of Information Security
shown on Figure 3 with NetGA [28] which uses traditional fitness function [17] [29] [30], and both are trained with 1998 DARPA training sample dataset bsm. list [31] using the Genetic Algorithm parameters as displayed in Table 3.
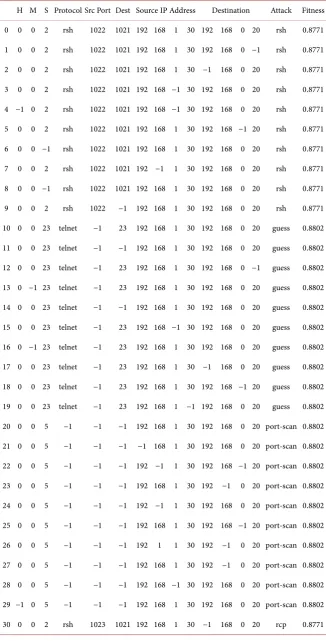
[image:16.595.199.537.193.735.2]Table 5 shows the rules generated by NetGA and Table 6, Table 7 show the rules produced by our Implemented GAIDS. The simulation outcomes pro-duced by NetGA shows that this system was able to print to the standard
Table 5. Outcomes from NetGA [28].
DOI:10.4236/jis.2019.101001 17 Journal of Information Security
Table 6. Outcomes from our implemented GAIDS.
H M S Protocol Src Port Dest Source IP Address Destination Attack Fitness
0 0 0 2 rsh 1022 1021 192 168 1 30 192 168 0 20 rsh 0.8771
1 0 0 2 rsh 1022 1021 192 168 1 30 192 168 0 −1 rsh 0.8771
2 0 0 2 rsh 1022 1021 192 168 1 30 −1 168 0 20 rsh 0.8771
3 0 0 2 rsh 1022 1021 192 168 −1 30 192 168 0 20 rsh 0.8771
4 −1 0 2 rsh 1022 1021 192 168 −1 30 192 168 0 20 rsh 0.8771
5 0 0 2 rsh 1022 1021 192 168 1 30 192 168 −1 20 rsh 0.8771
6 0 0 −1 rsh 1022 1021 192 168 1 30 192 168 0 20 rsh 0.8771
7 0 0 2 rsh 1022 1021 192 −1 1 30 192 168 0 20 rsh 0.8771
8 0 0 −1 rsh 1022 1021 192 168 1 30 192 168 0 20 rsh 0.8771
9 0 0 2 rsh 1022 −1 192 168 1 30 192 168 0 20 rsh 0.8771
10 0 0 23 telnet −1 23 192 168 1 30 192 168 0 20 guess 0.8802
11 0 0 23 telnet −1 −1 192 168 1 30 192 168 0 20 guess 0.8802
12 0 0 23 telnet −1 23 192 168 1 30 192 168 0 −1 guess 0.8802
13 0 −1 23 telnet −1 23 192 168 1 30 192 168 0 20 guess 0.8802
14 0 0 23 telnet −1 −1 192 168 1 30 192 168 0 20 guess 0.8802
15 0 0 23 telnet −1 23 192 168 −1 30 192 168 0 20 guess 0.8802
16 0 −1 23 telnet −1 23 192 168 1 30 192 168 0 20 guess 0.8802
17 0 0 23 telnet −1 23 192 168 1 30 −1 168 0 20 guess 0.8802
18 0 0 23 telnet −1 23 192 168 1 30 192 168 −1 20 guess 0.8802
19 0 0 23 telnet −1 23 192 168 1 −1 192 168 0 20 guess 0.8802
20 0 0 5 −1 −1 −1 192 168 1 30 192 168 0 20 port-scan 0.8802
21 0 0 5 −1 −1 −1 −1 168 1 30 192 168 0 20 port-scan 0.8802
22 0 0 5 −1 −1 −1 192 −1 1 30 192 168 −1 20 port-scan 0.8802
23 0 0 5 −1 −1 −1 192 168 1 30 192 −1 0 20 port-scan 0.8802
24 0 0 5 −1 −1 −1 192 −1 1 30 192 168 0 20 port-scan 0.8802
25 0 0 5 −1 −1 −1 192 168 1 30 192 168 −1 20 port-scan 0.8802
26 0 0 5 −1 −1 −1 192 1 1 30 192 −1 0 20 port-scan 0.8802
27 0 0 5 −1 −1 −1 192 168 1 30 192 −1 0 20 port-scan 0.8802
28 0 0 5 −1 −1 −1 192 168 −1 30 192 168 0 20 port-scan 0.8802
29 −1 0 5 −1 −1 −1 192 168 1 30 192 168 0 20 port-scan 0.8802
DOI: 10.4236/jis.2019.101001 18 Journal of Information Security
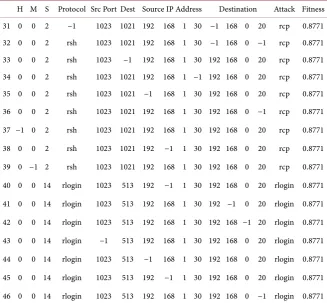
Table 7. Outcomes from our implemented GAIDS continued.
H M S Protocol Src Port Dest Source IP Address Destination Attack Fitness 31 0 0 2 −1 1023 1021 192 168 1 30 −1 168 0 20 rcp 0.8771 32 0 0 2 rsh 1023 1021 192 168 1 30 −1 168 0 −1 rcp 0.8771 33 0 0 2 rsh 1023 −1 192 168 1 30 192 168 0 20 rcp 0.8771 34 0 0 2 rsh 1023 1021 192 168 1 −1 192 168 0 20 rcp 0.8771 35 0 0 2 rsh 1023 1021 −1 168 1 30 192 168 0 20 rcp 0.8771 36 0 0 2 rsh 1023 1021 192 168 1 30 192 168 0 −1 rcp 0.8771 37 −1 0 2 rsh 1023 1021 192 168 1 30 192 168 0 20 rcp 0.8771 38 0 0 2 rsh 1023 1021 192 −1 1 30 192 168 0 20 rcp 0.8771 39 0 −1 2 rsh 1023 1021 192 168 1 30 192 168 0 20 rcp 0.8771 40 0 0 14 rlogin 1023 513 192 −1 1 30 192 168 0 20 rlogin 0.8771 41 0 0 14 rlogin 1023 513 192 168 1 30 192 −1 0 20 rlogin 0.8771 42 0 0 14 rlogin 1023 513 192 168 1 30 192 168 −1 20 rlogin 0.8771 43 0 0 14 rlogin −1 513 192 168 1 30 192 168 0 20 rlogin 0.8771 44 0 0 14 rlogin 1023 513 −1 168 1 30 192 168 0 20 rlogin 0.8771 45 0 0 14 rlogin 1023 513 192 −1 1 30 192 168 0 20 rlogin 0.8771 46 0 0 14 rlogin 1023 513 192 168 1 30 192 168 0 −1 rlogin 0.8771
output the top 30 rules. From the first rule to thirteenth rules, the fitness value is equal to 0%. These rules have no effectiveness in identifying network attacks (DoS, R2L, Probes and U2L). Thus, from fourteenth rules to thirtieth rules, fit-ness values vary between 26.98% and 80.63%. Such rules can identify network attacks (DoS, R2L, Probes and U2L) successful. On the contrary, the rules pro-duced by our implemented GAIDS, was able to print to the standard output 46 top rules. From the index zero to the index 46, we have very high fitness values which vary between 87.71% and 88.24%. These rules generated by GAIDS have effectiveness in identifying network attacks than rules produced by NetGA. Hence, we can conclude that the rules produced by our GAIDS using the im-proved traditional Fitness Function have maintained high fitness value than NetGA. For that reason, it has a powerful in classifying network attacks (DoS, R2L, Probes and U2L).
DOI:10.4236/jis.2019.101001 19 Journal of Information Security
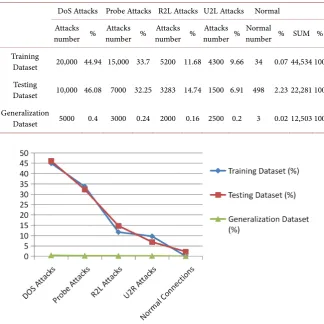
Table 8. Class distribution of experimental on KDD CUP 99 dataset.
DoS Attacks Probe Attacks R2L Attacks U2L Attacks Normal Attacks
number % number % Attacks number % Attacks number % Attacks number % SUM % Normal Training
Dataset 20,000 44.94 15,000 33.7 5200 11.68 4300 9.66 34 0.07 44,534 100 Testing
Dataset 10,000 46.08 7000 32.25 3283 14.74 1500 6.91 498 2.23 22,281 100 Generalization
[image:19.595.209.539.88.414.2]Dataset 5000 0.4 3000 0.24 2000 0.16 2500 0.2 3 0.02 12,503 100
Figure 10.Graph of class distribution of experimental on KDD CUP 99 dataset.
The overall simulation outcomes and their related statistical calculations are displayed in Table 9, Table 10 and Table 11. It is concluded that the Network Intrusion Detection System rules generated by SOFM Artificial Neural Network when trained with KDD Cup 99 can detect for different attack types successful with high attack detection rate and law false positive rate.
Tables 12-14 show that the rules generated by Genetic Algorithm when trained with KDD Cup 99 can successful detect for different attack types in the training dataset namely DoS, Probe, R2L, U2R including normal traffic with very high attack detection rate but with very high false positive rate which may lead to very poor accuracy of anomaly detection system.
DOI: 10.4236/jis.2019.101001 20 Journal of Information Security
Table 9. Training detection rate comparison for different attack types using SOFM on KDD Cup 99.
Attack types and Normal Detection rate (%) False Positive rate (%) Classification Time (s)
DoS 99.98 0.01 7274.78
Probe 100 0 8995.55
R2L 99.89 0.10 14,490.77
U2R 100 0 10,569.26
[image:20.595.211.540.103.211.2]Normal 100 0 10,916.12
Table 10. Testing detection rate comparison for different attack types using SOFM on KDD Cup 99.
Attack types and
Normal connections Detection rate (%) False Positive rate (%) Classification Time (s)
DOS 99.93 0.06 3654.03
Probe 99.86 0.13 3886.96
R2L 99.91 0.08 4304.89
U2R 99.84 0.15 4509.60
[image:20.595.210.539.258.381.2]Normal 99.91 0.08 3876.71
Table 11. Generalization detection rate comparison for different attack types using SOFM on KDD Cup 99.
Attack types and
Normal connections Detection rate (%) False Positive rate (%) Classification Time (s)
DOS 99.96 0.03 2133.17
Probe 100 0 2326.36
R2L 100 0 2652.01
U2R 100 0 1901.46
Normal 100 0 2452.61
Table 12. Training detection rate comparison for different attack types using GA on KDD Cup 99.
Attack types and
Normal connections Detection rate (%) False Positive rate (%) Classification Time (s)
DOS 100 15.1 19,723.99
Probe 100 8.8 2716
R2L 100 11.9 1835.32
U2R 100 0 1181.53
[image:20.595.209.540.428.548.2] [image:20.595.210.538.595.737.2]DOI:10.4236/jis.2019.101001 21 Journal of Information Security
Table 13. Testing detection rate comparison for different attack types using GA on KDD Cup 99.
Attack types and Normal connections Detection rate (%) False Positive rate (%) Classification Time (s)
DOS 100 13.5 1178.15
Probe 100 0.5 175.52
R2L 100 1.14 615.71
U2R 100 9.51 985.83
[image:21.595.58.539.238.343.2]Normal 100 17.58 2336.81
Table 14. Generalization detection rate comparison for different attack types using GA on KDD Cup 99.
Attack types and Normal connections Detection rate (%) False Positive rate (%) Classification Time (s)
DOS 100 10.05 1352.11
Probe 100 7.23 1026.07
R2L 100 15.05 458.03
U2R 100 8.10 435.84
Normal 100 3.04 485.71
Table 15. Detection rate (%) comparisons between GA and SOFM.
Classifier
algorithms Attack types and Normal
Training detection rate Testing detection rate Generalization detection rate DR
(%) FPR (%) Classification Time (s) (%) DR FPR (%) Classification Time (s) (%) DR FPR (%) Classification Time (s)
SOFM
DOS 99.98 0.01 7274.78 99.93 0.06 3654.03 99.96 0.03 2133.17
Probe 100 0 8995.55 99.86 0.13 3886.96 100 0 2326.36
R2L 99.89 0.10 14,490.77 99.91 0.08 4304.89 100 0 2652.01
U2L 100 0 10,569.26 99.84 0.15 4509.60 100 0 1901.46
Normal 100 0 10,916.12 99.91 0.08 3876.71 100 0 2452.61
GA
DOS 100 15.1 19,723.99 100 13.5 1178.15 100 10.05 1352.11
Probe 100 8.8 2716 100 0.5 175.52 100 7.23 1026.07
R2L 100 11.9 1835.32 100 1.14 615.71 100 15.05 458.84
U2L 100 0 1181.53 100 9.51 985.83 100 8.10 435.84
Normal 100 3.05 3612.49 100 17.58 2336.81 100 3.04 485.71
platform and size of the training dataset. In general the obtained results in SOFM have maintained both high detection rate and low false positive rate than GA. But GA has maintained very high detection rate but it suffer from very high false positive rate, for that reason, It leads to very poor accuracy of Anormaly detec-tion system.
7. Conclusion and Future Work
[image:21.595.58.539.375.591.2]DOI: 10.4236/jis.2019.101001 22 Journal of Information Security
for different attack types, in the testing detection rate comparison for different attack types and in the generalization detection rate comparison for different at-tack types using GA and SOFM as classifier algorithms, and KDD Cup 99, 1998 DARPA as a dataset, the Self Organizing Feature Map Artificial Neural Network has maintained very high detection rate with low false positive rate than GA. The obtained results from GA are shown the best detection rate but with the highest false positive rate which can lead to very poor accuracy of Anomaly de-tection system. However, the highest attack dede-tection rate and the lowest false positive rate obtained using SOFM on KDD Cup 99 demonstrated the efficiency and effectiveness of the algorithm in classifying attack types from KDD Cup 99 dataset. For that reason, the SOFM Artificial Neural Network can either classify malicious attacks or normal traffic successful. And thus, the rules produced by our GAIDS using the improved traditional Fitness Function have maintained high fitness value than NetGA. The training speed depends on various factors such as the implementation of the algorithms, conditions of the hardware and software platform and the size of the training dataset. For future work, this work will be extended for other classifier algorithms.
Conflicts of Interest
The authors declare no conflicts of interest regarding the publication of this paper.
References
[1] Ibrahim, L.M., Basheer, D.T. and Mahmod, M.S. (2013) A Comparison Study for Intrusion Database (Kdd99, Nsl-Kdd) Based on Self Organization Map (SOM) Ar-tificial Neural Network. Journal of Engineering Science and Technology, 8, 107-119. [2] Sharma, G.D. and Kumar, V. (2016) Towards Configured Intrusion Detection
Sys-tems. Global Journals Inc., USA, Vol. 16, Version 1.0.
[3] Bunel, P. (2004) An Introduction to Intrusion Detection Systems. SANS Institute, GIAC Security Essentials, Certificate (GSEC), Practical Assignment, Version 1.4c, SANS Conference, London.
[4] Bankovi, Z., Stepanovi, D., Bojani, S. and Nieto-Taladriz, O. (2007) Improving Network Security Using Genetic Algorithm Approach. Computers and Electrical Engineering, 33, 438-451. https://doi.org/10.1016/j.compeleceng.2007.05.010 [5] Ramadas, M., Ostermann, S. and Tjaden, B. (2003) Detecting Anomalous Network
Traffic with Self-Organizing Maps. In: Vigna, G., Kruegel, C. and Jonsson, E., Eds.,
Recent Advances in Intrusion Detection. RAID 2003. Lecture Notes in Computer Science, Vol. 2820, Springer, Berlin, Heidelberg.
https://doi.org/10.1007/978-3-540-45248-5_3
[6] Abdullah, B., Abd-Alghafar, I., Salama, G.I. and Abd-Alhafez, A. (2009) Perfor-mance Evaluation of a Genetic Algorithm Based Approach to Network Intrusion Detection System. 13th International Conference on Aerospace Sciences and Avia-tion Technology, ASAT-13, Military Technical College, Cairo, Egypt, 26-28 May 2009, 1-17.
DOI:10.4236/jis.2019.101001 23 Journal of Information Security [8] Chittur, A. (2001) Model Generation for an Intrusion Detection System Using Ge-netic Algorithms. High School Honors Thesis, Ossining High School. In coopera-tion with Columbia Univ.
[9] Crosbie, M. and Spafford, G. (1995) Applying Genetic Programming to Intrusion Detection. In Working Notes for the AAAI Symposium on Genetic Programming, MIT Press, Cambridge, MA, 1-8.
[10] Li, W. (2004) A Genetic Algorithm Approach to Network Intrusion Detection. SANS Institute, USA, Vol. 15, 209-216.
[11] Oksuz, A. (2007) Unsupervised Intrusion Detection System. Master’s Thesis, Tech-nical University of Denmark, DTU, DK-2800 Kgs. Lyngby, Denmark.
[12] Choksi, K., Shah, B. and Kale, O. (2014) Intrusion Detection System Using Self Or-ganizing Map: A Survey. International Journal of Engineering Research and Appli-cations, 4, 11-16.
[13] Patole, V.A., Pachghare, V.K. and Kulkarni, P. (2010) Self Organizing Maps to Build Intrusion Detection Systems. Journal of Computer Applications, 1.
[14] De La Hoz Franco, E., Ortiz Garcia, A., Ortega Lopera, J., De La Hoz Correa, E. and Mendoza Palechor, F. (2015) Implementation of an Intrusion Detection System Based on Self Organizing Map. Journal of Theoretical and Applied Information Technology, 71.
[15] Sayad, S. (2010) Self-Organizing Maps (SOM). Bahen Centre Information Tech-nology, Toronto, Ontario, Canada.
[16] Jadhav, M.L. and Gaikwad, C.M. (2014) Implementation of Intrusion Detection System Using GA. International Journal of Innovative Research in Electrical, Elec-tronics, Instrumentation and Control Engineering (IJIREEICE), 2, 1733-1736. [17] Wong, M.L. and Leung, K.S. (2000) Data Mining Using Grammar Based Genetic
Programming and Applications. Kluwer Academic Publishers, Dordrecht.
[18] Paliwal, S. and Gupta, R. (2012) Denial-of-Service, Probing and Remote to User (R2L) Attack Detection Using Genetic Algorithm. International Journal of Com-puter Applications, 60, 57-62.
[19] Sunita, S., Chandrakanta, B.J. and Chinmayee, R. (2016) A Hybrid Approach of In-trusion Detection Using ANN and FCM. European Journal of Advances in Engi-neering and Technology, 3, 6-14.
[20] Jiang, X., Liu, K., Yan, J. and Chen, W. (2012) Application of Improved SOM Neur-al Network in AnomNeur-aly Detection. Physics Procedia, 33, 1093-1099.
https://doi.org/10.1016/j.phpro.2012.05.179
[21] Palomo, E.J., Domnguez, E., Luque, R.M. and Muoz, J. (2009) An Intrusion Detec-tion System Based on Hierarchical Self-OrganizaDetec-tion. In: Proceedings of the Inter-national Workshop on Computational Intelligence in Security for Information Sys-tems, Springer, Berlin, Heidelberg, 139-146.
https://doi.org/10.1007/978-3-540-88181-0_18
[22] Bahrololum, M., Salahi, E. and Khaleghi, M. (2009) Anomaly Intrusion Detection Design Using Hybrid of Unsupervised and Supervised Neural Network. Interna-tional Journal of Computer Networks and Communications, 1, 26-33.
[23] Vokorokos, L., Balaz, A. and Chovanec, M. (2006) Intrusion Detection System Us-ing Self OrganizUs-ing Map. Acta Electrotechnica et Informatica, 6, 1-6.
DOI: 10.4236/jis.2019.101001 24 Journal of Information Security [25] Proti, D.D. (2018) Review of KDD Cup’99, NSL-KDD and Kyoto 2006+ Datasets.
Vojnotehniki Glasnik, 66, 580-596.https://doi.org/10.5937/vojtehg66-16670
[26] Alzahrani, S. and Hong, L. (2018) Generation of DDoS Attack Dataset for Effective IDS Development and Evaluation. Journal of Information Security, 9, 225-241.
https://doi.org/10.4236/jis.2018.94016
[27] Amini, M., Jalili, R. and Shahriari, H.R. (2006) RT-UNNID: A Practical Solution to Real-Time Network-Based Intrusion Detection Using Unsupervised Neural Net-works. Computers and Security, 25, 459-468.
https://doi.org/10.1016/j.cose.2006.05.003
[28] Lavender, B.E. (2010) Implementation of Genetic Algorithms into a Network Intru-sion Detection System (netGA), and Integration into NProbe. Thesis Work, Cali-fornia State University, Sacramento.
[29] Gong, R.H., Zulkernine, M. and Abolmaesumi, P. (2005) A Software Implementa-tion of a Genetic Algorithm Based Approach to Network Intrusion DetecImplementa-tion. Pro-ceedings of the 6th International Conference on Software Engineering, Artificial Intelligence, Networking and Parallel/Distributed Computing and 1st ACIS Inter-national Workshop on Self-Assembling Wireless Networks, May 2005, 246–253. [30] Lu, W. and Traore, I. (2004) Detecting New Forms of Network Intrusion Using
Genetic Programming. Computational Intelligence, 20, 475-494.
https://doi.org/10.1111/j.0824-7935.2004.00247.x
[31] https://www.ll.mit.edu/r-d/datasets/1998-darpa-intrusion-detection-evaluation-data
set

![Table 5. Outcomes from NetGA [28].](https://thumb-us.123doks.com/thumbv2/123dok_us/9246153.412332/16.595.199.537.193.735/table-outcomes-from-netga.webp)