http://www.scirp.org/journal/ojg ISSN Online: 2161-7589
ISSN Print: 2161-7570
Mineral Exploration in Rough Mountainous
Area Using Geospatial Technology
(Case Study of Al Hajar Area)
Ali H. Jebril, Mohamed Hafedh M. M. Hamza, Mohamed A. Al-Amri
Department of Geography and Geographic Information Systems, Faculty of Arts, King Abdulaziz University, Jeddah, KSA
Abstract
As acknowledged that the exploration is the first step before reaching the discovery of profitable economic raw materials. However, it is also representing a high risk financially because it is possible that the areas discovered is not economically worthwhile, at that time the stakeholder will confront difficult return their exploration expenses. Therefore, the exploration process ex-ecuted in multiple stages before increasing expenses for the detection. The business of mineral exploration, one of high cost investment especially if it was in rugged mountain areas, which is difficult to reach and has a very high cost of access, consequentially increased the exploration costs. The reasons for doing this research in rough mountainous area using geospatial technology, can be justified to be valuable, time-saving and cost-reducing. Therefore, we can see that one of the solid factors that helped the study is using of GIS technology in the rough terrain area, which strongly and effec-tively contributes to the display of spatial information and linking the study, and analysis of the information collected by using GIS programs. Subsequently, its benefits minimizing exploration costs, and selecting tar-gets with confidence and effective field work. Most of the data related to the operations of mineral exploration have a spatial nature. So, GIS has the ca-pability for storage, updating, revising, displaying, retrieving, processing, manipulating and integrating of different geo-spatial data. By ending of this study, we will be able to save time and money and increase profitability and efficacy.
Keywords
Mineral Exploration, Geochemistry, Geophysics, GIS, Risk, Decision Making, Soil, Al Hajar-Bishah-KSA
How to cite this paper: Jebril, A.H., Hamza, M.H.M.M. and Al-Amri, M.A. (2018) Mineral Exploration in Rough Mountainous Area Using Geospatial Technology (Case Study of Al Hajar Area). Open Journal of Geology, 8, 1195-1216.
https://doi.org/10.4236/ojg.2018.813072
Received: December 1, 2018 Accepted: December 26, 2018 Published: December 29, 2018
Copyright © 2018 by author(s) and Scientific Research Publishing Inc. This work is licensed under the Creative Commons Attribution International License (CC BY 4.0).
http://creativecommons.org/licenses/by/4.0/ Open Access
1. Introduction
The working with minerals, their prospecting and exploration, mining and use is one of the most ancient human activities, which has been developed during the last 5000 years into an industry, with modern methods and tools. The meaning of exploration is the discovery of a still unknown mineral resource [1]. Explora-tion, could lead to finding more natural resources that can be used by the nation for economic gain, bolstering its Gross Domestic Product (GDP). Private com-panies that used the resources would have to pay the government in order to mine/pump the resources, which would increase revenue for the government and either allow for more government services or lower taxation. Increased amounts of raw materials on the market would lower prices for all consumers
[2]. On the other hand, successful mineral exploration strategy requires identifi-cation of some of the risk sources, and considering them in the decision-making process, so that controllable risk can be reduced. Risk is defined as chance of failure or loss [3]. Therefore, risk reduction can be addressed in three funda-mental ways: 1) increasing the number of examinations; 2) increasing success probabilities; and 3) changing success probabilities per test by learning [4].
During this work, several scientific methods and achievements are used, which include earth sciences on the first place; then basic sciences like chemistry
[5], and physics; and also advanced tools like statistics or remote sensing. The exploration is a process of collecting information. The starting point is a hypo-thetic geological-economic model; the end result is the detailed knowledge of the critical parameters of an ore-body through its exploitation. The techniques are somewhat similar to other intelligence tasks from reconnaissance to providing evidences [6]. Thus, the success ratio is also similar; not every exploration leads to discovery of an ore body; some of them remain hidden in spite of repeated costly exploration efforts. The exploration is a game in which several stake-holders take part [7]. A necessary in the investor is who takes the risk and provides funds for the works. Exploring is not possible without the consent of the land-owner, who has the surface rights of the area where the work is being done. The mineral wealth is in most cases publicly owned, and the state represents this ownership rights. Correspondingly, the operator, who carries out the explora-tion work, should provide the professional expertise necessary for the success. The earth-science engineer is part of the professional team. He plays major role in selecting the exploration targets, does the sampling and mapping, collects the geological information, and finally evaluates the results and provides the neces-sary input parameters for the mining development process [1].
The objective of this study, we focused on using of GIS technology in the rough terrain area through display and interpret the spatial information, geo-chemistry, geophysics and GIS spatial analysis, to achieve the desired goal by completing the stages of operations in a less space, resulting in the achievement of the objectives in this study area, through minimizing exploration costs, re-ducing risk and increasing profitability.
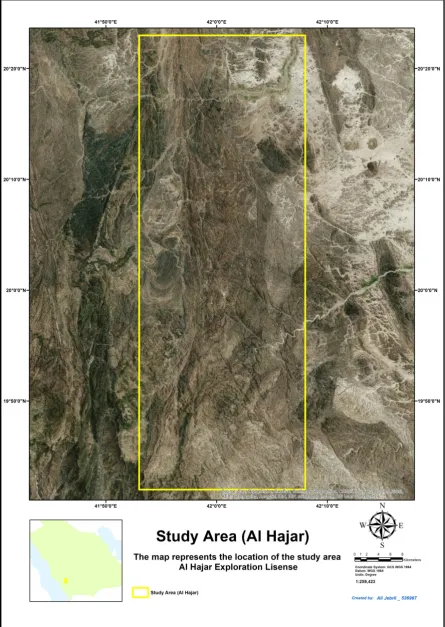
2. Study Area
Al Hajar license is one of MA’ADEN’s exploration licenses in Saudi Arabia as shown in Figure 1. The license is within the southern part of the Saudi Arabian Shield, about 350 km (550 km of road) southeast of Jeddah City, in the Asir province; approximately 100 km south of the town of Al Bahah City. The license covers an area of about 1969 Km2 and encloses several precious and base metal
occurrences. Historically, the license attracted several regional geological map-ping and mineral prospecting expeditions due to its potential geological setting for precious and base metals and the numerous ancient artisanal gold and copper.
3. Methodology
The parameters and methodology of the research started with the gathering the data from different sources to explore for mineral deposits. Then, we will go through the steps of the mineral exploration. By using different datasets from a variety of sources and select the datasets of the study area, we will define the geological features based on the geological background and concepts that indi-cate to an area of mineralization. Afterward, we will interpret the information to help us making an appropriate decision. So, different data types were used to study Al Hajar area, which is one of MA’ADEN’s Company exploration licenses in Saudi Arabia. The methods and techniques use during the process of mineral exploration, depending on gathering the data from different sources, to explore for mineral deposits, for instance the geological map was provided by the United States Geological Survey (USGS) [8]. As well, we have used the Electromagnetic (HTEM) Survey done by on 28 March 2013 [9]; this data can come from various sources using various formats provided by MA’ADEN. Then, to display and in-terpret this information quickly and easily, we have used the software ArcGIS defining regions of interest, from the geological map and geophysical survey. With the Geographic Information System (GIS), we have defined the geological features based on the geological background, and concepts that indicate to an area of mineralization using the coordinate system World Geodetic System (WGS 1984) as the standard geodetic reference system [10]. The interpretation of this information will help us making an appropriate decision, as indicated in the flowchart below for each step:
Figure 1. Location map of (Al Hajar) exploration license in Saudi Arabia map.
4. Data Description
Different data types were used in this study. First methods and techniques use during the process of mineral exploration, depending on gathering the data from different sources to explore for mineral deposits. Accordingly, Data exploration is an informative search, used by data consumers to form true analysis from the information gathered [11]. Often data is gathered in a non-rigid or controlled manner in large bulks. For true analysis, this unorganized bulk of data needs to be narrowed down. This is where data exploration is used to analyze the data and information from the data to form further analysis. Data often converges in a central warehouse called a data warehouse. This data can come from various sources using various formats. Therefore, to display and interpret this informa-tion quickly and easily, we have used the software ArcGIS.
4.1. Geology
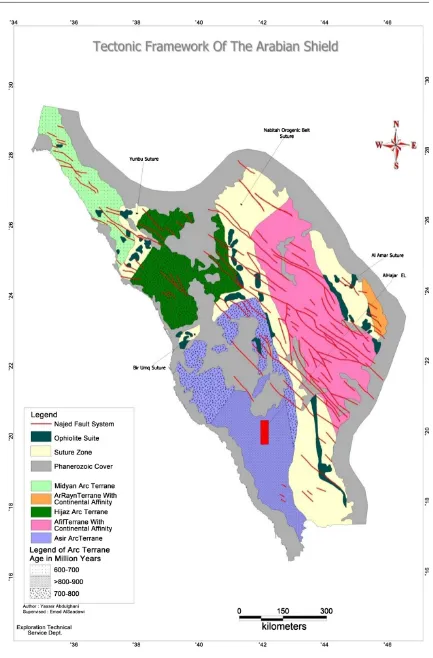
The study area of Al Hajar deposit lies within Asir Terrane of the southern shield of Saudi Arabia. The Southern shield comprises an area of approximately 220,000 km2 the Geological map located in the Arabian Shield covers an area
over 650,000 km2 in western and south-western part of the Arabian Peninsula
and covers about 25% of the area of Saudi Arabia as shown in Figure 2. We have added in the geology map the Points Location Saudi Geological Survey (MODS) data main information distributed on Hajar exploration license, the reference number of the MODS, the locality name, commodity, exploration type, date and bibliography and including the MODS coordinates [12] (Tables 1-3).
4.2. Geophysical Survey
The most effective geophysical method has been used in volcanogenic massive sulphide (VMS) exploration both on regional and local scales is electromagnetic (EM) (Slack 2012). Therefore, We have used the Electromagnetic (HTEM) Survey by Fugro (CGG) Ltd. Production on the study area survey commenced on 03 February 2013 and was completed on 28 March 2013. HELITEM Survey was de-signed by Fugro Airborne Surveys contracted with Ma’aden Company (Prelimi-nary; interpretation [9]. The heliborne survey was flown over the entire Al Hajar license at a line spacing of 200 m, with infill at 100 m line spacing over selected areas at Al Hajar (dB/dt) which is the ratio between the amount of change in am-plitude of the magnetic field (dB) and the time it takes to make that change (dt). Because changing magnetic fields can induce electrical fields, EM response at early (A), mid (B) and late (C) time channels and red green blue (RGB) combination of 3 channels. Interpretation of the survey was documented by the geophysics [9]. Details about Electromagnetic (HTEM) Survey shown in Table 4 and the sum-mary of kilometers and coordinates demonstrates in the Table 5.
4.3. Geochemistry
The two main factors that need to be addressed in the interpretation of stream
Figure 2. Tectonic map of the Arabian Shield showing terranes and suture zones (Jackson 1985).
Table 1. Ag MODS information at Al Hajar EL.
MODS Commodity Exploration Date Locality Name Long. X Lat. Y
1104 Ag, Au Occurrence 1979 Al Gherayah 41 57 15 20 20 37
1106 Ag, Cu, Zn Ancient Mine 1972 Abu Sidrah 41 58 00 20 18 20
[image:7.595.54.539.189.454.2]1113 Ag, Pb, Cu Ancient Mine 1973 Wadi Ibn An Naa 41 56 30 20 11 45
Table 2. Au MODS information at Al Hajar EL.
MODS Commodity Exploration Date Locality Name Long. X Lat. Y
20 Au, Pb, Be Prospect 1971 Wadi Ranyah 41 58 00 20 15 00
27 Au, F, Cu, Pb, Zn Occurrence 1965 Ablah 41 55 00 20 10 00
639 Au, Cu, Zn, Gossan, Ag Prospect 1971 Jadmah 41 58 00 19 59 00
649 Au, Ag (Cu, Zn, Pyrite) Prospect/Drilling 1973 Al Hajar 42 01 00 19 58 00
649 Au, Ag (Cu, Zn, Pyrite) Prospect/Drilling 1976 Al Hajar 42 01 00 19 58 00
649 Au, Ag (Cu, Zn, Pyrite) Prospect 1970 Al Hajar 42 01 03 19 58 48
649 Au, Ag (Cu, Zn, Pyrite) Prospect 1970 Al Hajar 42 01 03 19 58 48
1075 Au, Ag Ancient Mine 1973 Assous 41 57 29 20 10 20
1100 Au, Gossan Occurrence 1960 Sahlam 41 59 00 19 59 00
1105 Au, Ag Ancient Mine 1973 AlMukaisrah 41 57 30 20 20 10
2722 Au Occurrence 1973 WadiTabalah 42 07 00 19 56 00
4663 Au Occurrence 1983 Al Quhafa 41 56 35 20 05 12
4824 Au Occurrence 1988 Wadi Surum 42 04 18 20 03 18
4825 Au Occurrence 1988 Wadi Surqah 42 03 42 20 06 06
Table 3. Cu MODS information at Al Hajar EL.
MODS Commodity Exploration Date Locality Name Long. X Lat. Y
639 Cu, Zn, Gossan, Au, Ag Prospect/Drilling 1973 Jadmah 41 58 00 19 59 00
639 Cu, Zn, Gossan, Ag Prospect 1971 Jadmah 41 58 20 19 59 22
640 Cu, Zn, Gossan Prospect 1988 Abu Ramiah 42 01 00 20 11 30
641 Cu, Zn, Gossan Occurrence 1970 Shmaytah 42 00 20 20 11 10
642 Cu, Zn, Gossan Occurrence 1970 Qirdan 41 58 30 20 07 00
643 Cu, Zn, Gossan Occurrence 1970 Ahdairah 41 59 25 20 13 15
644 Cu, Zn, Gossan Occurrence 1970 Al Wakaban 41 59 00 19 55 00
645 Cu, Zn, Gossan Prospect/Drilling 1970 Iktinah 41 59 00 20 06 00
646 Cu, Zn, Gossan Prospect 1970 Abu Hadydu 41 58 00 19 51 00
647 Cu, Zn, Gossan Prospect/Drilling 1970 Siqam As Sawan 41 59 00 19 51 00
648 Cu, Zn, Gossan Prospect/Drilling 1970 Shabat Al Suqah 41 59 00 19 51 00
685 Cu, Zn, Gossan Occurrence 1973 Shaib al Himira 41 55 00 19 49 40
1073 Cu Prospect 1972 Bin Qirdan 41 58 43 20 03 23
[image:7.595.56.540.486.726.2]Continued
1074 Cu, Zn Ancient Mine 1973 Shaib at Tandub 41 59 43 20 10 01
1076 Cu, Ag Ancient Mine 1973 Assous 41 57 51 20 08 56
1077 Cu, Au Ancient Mine 1973 Al Mulayyah 42 02 48 20 08 22
1078 Cu Ancient Mine 1973 Al Mulayyah 42 02 47 20 08 50
1079 Cu Prospect/Drilling 1979 Wadi Qurdah 41 59 00 20 12 00
1081 Cu Ancient Mine 1973 Hajeej 41 59 06 20 13 07
1092 Cu, Zn Prospect/Drilling 1969 Wadi Talq 41 56 00 19 47 00
1092 Cu, Zn Occurrence 1980 Wadi Talq 41 56 00 19 47 20
1093 Cu Prospect 1970 Wadi Farsh 41 55 30 19 48 15
1094 Cu Occurrence 1970 Jabal Al Mush 41 55 40 19 49 40
1102 Cu, Zn, Gossan Prospect/Drilling 1970 Al Mahtriq 41 58 00 19 49 00
1107 Cu Prospect 1972 Ghadmat Sharyan 42 00 35 20 13 20
1114 Cu, Zn Prospect 1978 Abu Ramiah 42 02 00 20 11 00
1115 Cu? Ancient Mine 1973 Sharay 41 56 00 20 15 00
1161 Cu Occurrence ? Adem Ash Shamran 41 56 00 19 46 00
3465 Cu, Pb Occurrence 1983 Ablah 41 54 53 20 10 56
[image:8.595.53.536.88.384.2]4823 Cu, Au Occurrence 0 Al Qoumah 42 01 01 20 01 09
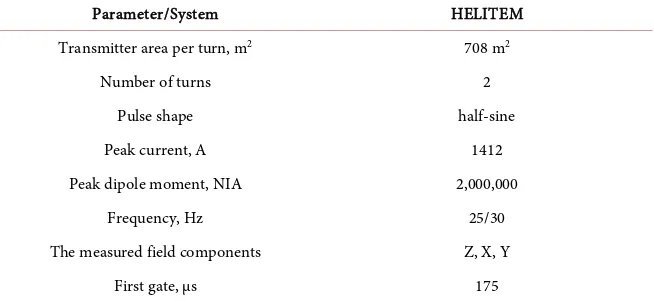
Table 4. specifications of the HELITEM system.
Parameter/System HELITEM
Transmitter area per turn, m2 708 m2
Number of turns 2
Pulse shape half-sine
Peak current, A 1412
Peak dipole moment, NIA 2,000,000
Frequency, Hz 25/30
The measured field components Z, X, Y
[image:8.595.212.539.419.570.2]First gate, µs 175
Table 5. Summary of line kilometers and coordinates are attached below.
Study Area (Al Hajar) Line km proposed
ALH_200 10913.80
ALH_100A 1713.00
ALH_100B 522.20
ALH_100C 2399.00
Exclusion −220.00
Total 13010.85
sediment geochemical data are catchment geology, which controls background geochemistry, and the effect of dilution, which determines whether geochemical anomalies related to mineralization within a particular catchment basin can be detected [13]. The effects of dilution on stream sediment data have long been recognized and are a described in a mathematical formulation that is sometimes referred to as the productivity of a catchment basin [14]. This theoretical calcu-lation involves numerous assumptions, such as equal erosion in all parts of the catchment and a priori knowledge of the size and grade of any exposed mineral deposit within the catchment, as well as background values of the elements of interest. As an alternative, we have developed a pragmatic approach for the rou-tine assessment of large, regional stream sediment datasets in a cost-effective manner. The process to leveling data starts with geology of catchment and the DEM image for which drainage, catchments. These are linked to sample points. Therefore, we have used the Geochemistry survey, in geographical information systems (GIS), geochemical data are usually represented as points with links to an attribute table containing the analytical results. Stream water and stream se-diment samples often represent a region rather than a point, as when the analys-es provide summary information about the whole catchment. Likewise, till sam-ples are natural composite samsam-ples of the surrounding provenance area, though the area cannot be delineated as precisely as the catchment of a stream in till sampling, the sampling depth and sample spacing are selected so that the ana-lyses can be smoothly interpolated into a grid. Samples are collected at a deeper level in follow-up and detailed sampling than in regional mapping since samples from deeper parts of the till reflect a more local distribution of elements [15]. Except for detailed mappings, geochemical surveys are rarely based on a regular sampling grid and the results from an uneven grid require interpolation into a regular grid.
A regional stream sediment survey was undertaken over the whole license. The majority of the samples were collected by April 2014.
5. Discussion and Results
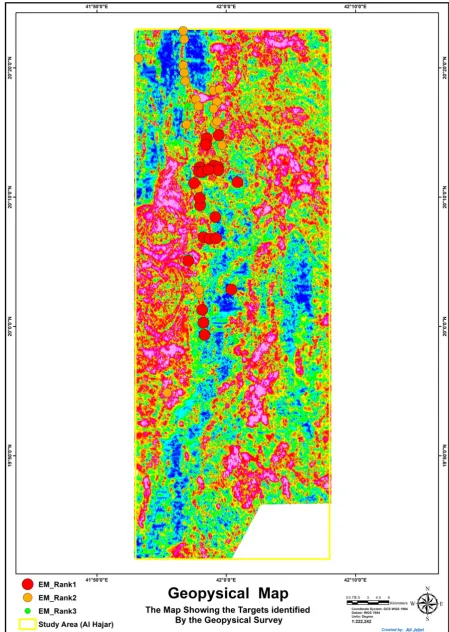
Based on the interpretation of the geophysics survey a total of 57 EM anomalies were selected and we have classified in the map above based on the high priority. 11 EM anomalies were recommended for drilling and the other 14 EM anoma-lies were identified of moderate priority which may be further investigated [16]
and these anomalies were then ranked based on high priorities as shown in
Fig-ure 3 EM_Rank1 represented the top significance. Consistently, we have added
the anomalies were then ranked by geophysics survey with the geology and Points Location Saudi Geological Survey (MODS) as shown in Figure 4.
The primary focus of the geochemical survey was to follow up on identified EM anomalies from the airborne survey; a stream sediment survey was underta-ken over the whole license. The majority of the samples were collected the result had been interpreting using percentile methods for Gold (Au) and other related
Figure 3. Targets identified by Geophysics Survey.
Figure 4. Targets identified from the Fugro Heliborne TDEM Survey with geology.
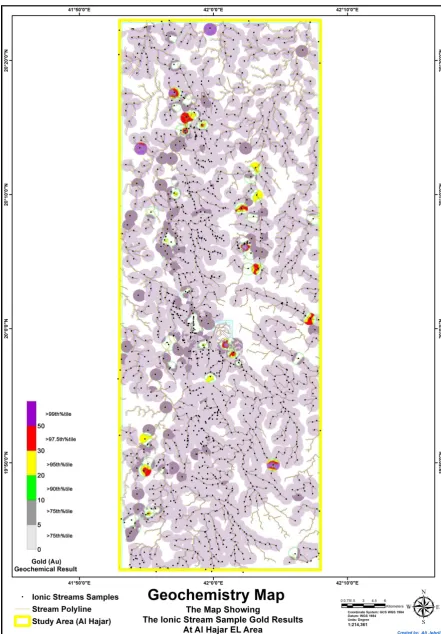
Figure 5. Map shows Ionic Stream Sampling Results at Al Hajar for Gold (Au).
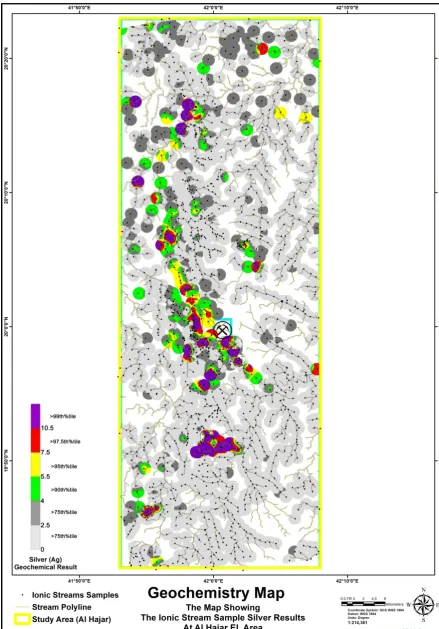
Figure 6. Map shows Ionic Stream Sampling Results at Al Hajar Silver (Ag).
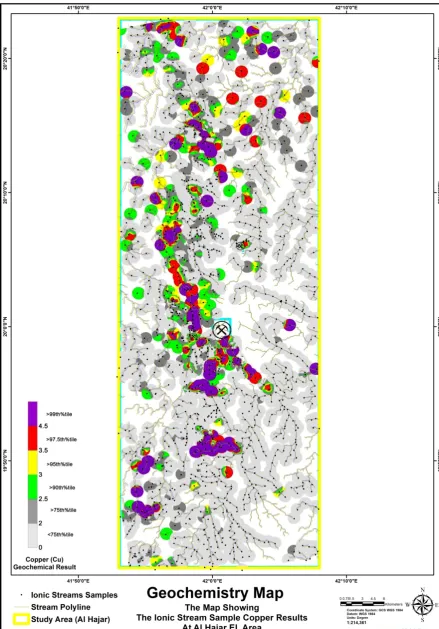
Figure 7. Map shows Ionic Stream Sampling Results at Al Hajar Copper (Cu).
Figure 8. Map shows Ionic Stream Sampling Results at Al Hajar Zinc (Zn).
Figure 9. Map shows Targets of Ionic Stream Sampling Results at Al Hajar with EM and MODS.
Figure 10. Target 1.
Figure 11. Target 2.
Figure 12. Target 3.
Figure 13. Target 4.
elements. All results were received and were generated as shown in Figures 5-8. A total of 518 samples were collected in 2013, composed of 477 stream sediment and 41 grab samples. Four targets anomalies were outlined namely Target 1, 2, 3 and 4 (Figure 9). The validity of the method was tested during the first phase of sampling around the geophysical anomalies and forming a full orientation for license, the second phase of this project was covering the entire license after management reviewed the initial results. The technique successfully highlighted all previously known geophysical anomalies. There is correlation between ele-ments such as (Au, As, and Ag) & (Sr, Co, Fe), and (Cu, Pb, Zn) as groups. We have identifying 4 Targets.
• Target 1 consisted of Zone (North West) and (Northern Hajar) as shown in
Figure 10.
• Target 2 composed of two anomalies of located 4 km north of Al Hajar mine.
The anomalies enclose copper assays of: 731 ppm, 437 ppm, 600 ppm, 680 ppm and the maximum 850 ppm as shown in Figure 11.
• In Target 3 there are 6 anomalous zones (3 Cu, 2 Au, and 1 Zn) are
identi-fied. Gold anomalies were also delineating in target 3 as shown in Figure 12.
• In the Target 4 area 6 Cu Anomalies were identified and each anomaly was
correlated with Geology and topography to define the upstream zone of in-terest as shown in Figure 13.
6. Conclusion
Mineral exploration in rough mountainous area using the geospatial technology in Al Hajar study area has be proven to be effective in making appropriate deci-sions to determine the mineralized sites in the study area, as well as selecting appropriate techniques for each stage of the detection processes which were ad-dressed in the study and avoiding the risks of the exploration operations ex-penses by identifying the promising mineralizing targets effectively and deter-mining the types of activity work suitable for each stage. As is known, the large area of the study area, which is estimated with around 1969 Km2 in the rugged
mountainous areas, where it is difficult to carry out the advanced field detection for several reasons mentioned in this study, so the use of GIS and data analysis by following the steps and methods referred to in this study, we have been able to identify the most important targets in the study area and focus on it after re-ducing the total area with of approximately 130 Km2, which is about 20% of the
study area. Therefore, we have achieved the desired goal to complete the stages of operations in a less space, resulting in the achievement of the objectives in this study area through minimizing exploration costs and reducing risk.
Conflicts of Interest
The authors declare no conflicts of interest regarding the publication of this paper.
References
[1] Földessy János, N.N. (2001) Mineral Exploration.
https://www.tankonyvtar.hu/hu/tartalom/tamop425/0033_PDF_MFFTT600341-EN
/MFFTT600341-EN_1_2_2.html
[2] David, A. and Wright, G. (1997) Increasing Returns and the Genesis of American Resource Abundance. Industrial and Corporate Change, 6, 203-245.
https://doi.org/10.1093/icc/6.2.203
[3] Singer, D.A.K.R. (1999) Natural Resources Research. 111.
[4] Singer, D.A. and Kouda, R. (1999) Examining Risk in Mineral Exploration. Natural Resources Research, 8, 111-122.https://doi.org/10.1023/A:1021838618750
[5] Cook, D.E., et al. (2006) Deciphering the Inorganic Chemical Record of Ancient Human Activity Using ICP-MS: A Reconnaissance Study of late Classic Soil Floors at Cancuén, Guatemala. Journal of Archaeological Science, 33, 628-640.
https://doi.org/10.1016/j.jas.2005.09.019
[6] Barnett, C.T. and Williams, M. (2006) Mineral Exploration Using Modern Data Mining Techniques. First Break, 24, 295-310.
[7] Fitzgerald, M.E. and Ross, A.M. (2014) Controlling for Framing Effects in Mul-ti-Stakeholder Tradespace Exploration.Procedia Computer Science, 28, 412-421.
https://doi.org/10.1016/j.procs.2014.03.051
[8] USGS (1981) Geological Mapping at SGS. Saudi Geological Survey, SGS.
[9] Kunchev, K. (2013) Al Hajar HeliTEM Survey Results and Targets Generation. Maaden Internal Report.
[10] Geowesen, M. (1988) World Geodetic System 1984 (WGS84). Amt für Militärisches Geowesen, 9.
[11] Paiano, R. and Pasanisi, S. (2017) A New Challenge for Information Mining.
BRAIN, Broad Research in Artificial Intelligence and Neuroscience, 8, 63-80. [12] Demessie, A.K. (2009) Gold and Base Metal Occurrences in Al Hajar Exploration
License. Internal Ma’aden Report.
[13] Arne, D.C.A.B. (2011)Catchment Analysis and Interpretation of Stream Sediment Data from QUEST South, British Columbia. Report 2011-5, Geoscience BC, Van-couver.
[14] Hawkes, H.E. (1976) The Downstream Dilution of Stream Sediment Anomalies: Exploration. Journal of Geochemical Exploration,6, 345-358.
https://doi.org/10.1016/0375-6742(76)90023-6
[15] Nurmi, A. (1977) Explorational Applications of Pedogeochemistry. University of Helsinki, Helsinki, 1-14.
[16] Petrov, G. (2013) The Structural Sketch Mapping over the EM Anomalies in Al Hajar license, Kingdom of Saudi Arabia Dec, 2013. Maaden Internal Report.