New Method for Optimization and Simultaneous
Determination of Sparfloxacin and Non Steroidal
Anti-Inflammatory Drugs: Its In-Vitro Application
Somia Gul1, Najma Sultana2, Muhammad Saeed Arayne2, Sana Shamim3, Mahwish Akhtar3 1Faculty of Pharmacy, Jinnah University for Women, Karachi, Pakistan
2United Biotech (Pvt) Ltd., Karachi, Pakistan
3College of Pharmacy, Dow University of Health Sciences, Karachi, Pakistan Email: [email protected]
Received February 24,2012; revised March 24, 2012; accepted April 4, 2012
ABSTRACT
A simple reversed phase HPLC method was developed and validated for the simultaneous determination of sparfloxacin (SPFX), diclofenac sodium, meloxicam, ibuprofen, flurbiprofen, naproxen and mefenemic acid in a relatively short time with high linearity in bulk material, pharmaceutical formulations and human serum. Purospher STAR C18 (250 × 4.6 mm, 5 μm) column was utilized with mobile phase, methanol and water (90:10, v/v pH 2.70 adjusted by phosphoric acid), was delivered at a flow rate of 1.5 mL·min–1. Eluent was monitored using UV detector at 240 nm. The proposed method is specific, accurate (98.42% - 102.75%), precise (intra-day and inter-day variation 0.011% - 1.85%) and linear (R2 > 0.999) with in the desired range 0.15 - 40 µg·mL–1 and the detection and quantification limit was 1.19E+08 – 0.150 µg·mL–1 and 3.62E+08 – 0.4574 µg·mL–1 respectively for SPFX and NSAIDs. The analysis of variance (ANOVA) and student’s t-test were applied to verify the results. The anticipated method is applicable to routine analysis of SPFX and NSAIDs in pharmaceutical formulations as well as in human serum samples. It has also applied on interaction of SPFX with NSAIDs.
Keywords: Sparfloxacin; NSAIDs; HPLC; Interactions; ANOVA
1. Introduction
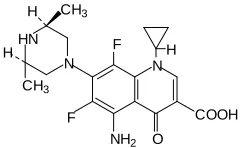
Sparfloxacin or cis-5-amino-1-cyclopropyl-7-(3,5-dime- thylpiperazin-1-yl)-6,8-difluoro-1,4-dihydro-4-oxoquinol ine-3-carboxylic acid (SPFX) (Figure 1) is an orally ac-
tive synthetically broad spectrum third generation quino- lone, characterized by good to excellent activity against Gram positive cocci (notably S. pneumoniae) and in se- lected agent activity against anaerobes and atypical patho- gens. It is also moderately active against some (B. fragi-lis group) L. mono-cytogenes resistant [1-9]andhas been shown to have excellent activity, not only against Neis-seria gonorrhoeae, but also against Chlamydia tracho- matis, Mycoplasmas and Gardnerella vaginalis [10].
Literature search assembled a number of different methods, which have been used for analysis of fluroqui- nolones in bulk, human serum and in pharmaceutical preparations. Gonzalez et al. [11] discovered the simul- taneous determination of cefepime and the quinolones garenoxacin, moxifloxacin and levofloxacin in human urine by HPLC-UV. The method was applied to the de- termination of the four molecules in spiked samples of human urine. Nguyen et al. [12] reported simultaneous
determination of levofloxacin, gatifloxacin and moxi- floxacin in human serum. Nemutlue et al. [13] published simultaneous separation and determination of seven qui- nolones using HPLC and analysis of levofloxacin. Sul- tana et al. [14-16] provided simultaneous determination of NSAIDs with diltiazem and ceftrioxazone sodium. Koichi Suenami et al. [17] developed more sophisticated and sensitive analytical method for the simultaneous de- termination of NSAID’s in human plasma using Oasis HLB solid-phase extraction, followed by reversed-phase high-performance liquid chromatography and quadruple mass spectrometry with electrospray ionization operated in the negative ion mode. Koichi Suenami et al., [18] also
F
F H
N HN
N
COOH
NH2 O
CH3
CH3
H
[image:1.595.363.484.642.716.2]H
described a capillary liquid chromatography (LC) and quadruple mass spectrometry with electrospray ionization operated in the negative ion mode for the simultaneous determination of 16 NSAIDs in human plasma. Nagoji and friends [19] developed a simple, selective, rapid, precise and economical reverse phase HPLC method for simultaneous estimation of nimesulide and diclofenac sodium from capsules. There are few methods reported for the simultaneous determination of sparfloxacin with other drugs.Srinivas et al. [20] described HPLC method for simultaneous determination of sparfloxacin, moxiflox- acin and gatifloxacin using levofloxacin as internal stan- dard in human plasma. Degradation products studies by HPLC have been carried out by Marona et al. [21]. Ak-
ram et al. developed fluorescence probe enhanced spec-
trofluorimetric method for the determination of spar- floxacin in tablets and biological fluids and spectropho- tometric determination method of sparfloxacin in phar- maceutical preparations by ternary complex formation with Pd (II) and eosin [22,23]. Young et al. [24] devel- oped an HPLC method for quantitation of SPFX in hu- man serum while. Argekar et al., Marona et al.and Nurun et al., developed methods for marketed products and sta- bility testing [25-27]. Srikar [28] and friends developed spectrophotometric methods for quantitative estimation of sparfloxacin in bulk and pharmaceutical dosage forms. Here, we report a simple, easy, quick and inexpensive isocratic RP-HPLC method with ultraviolet detection at 240 nm for the determination of SPFX in bulk, dosage form as well as in human serum. Low LOD and LOQ values also worth this method for the determination of sparfloxacin in clinical samples. Moreover, this method is applicable for “in-vitro” interaction studies of spar- floxacin with selected NSAIDs in a wide range of pH medium. Usually fluoroquinolones are prescribed for many diseases including respiratory and urinary tract infections. Historical background reveals that parallel administration of NSAIDs and new quinolones (NQ) can induce a syn-ergistic interaction that results in convulsions and NQ- induced neurotoxic effect synergistically increased in the presence of NSAIDs [29-31]. For the same purpose, to determine the effect of simultaneous administration of sparfloxacin (quinolones) and NSAIDs, a new RP-HPLC method has been developed which is simple, fast, cheap and easy to perform. The method is equally valid for the determination in bulk materials, pharmaceutical dosage formulations and human serum and is no where else re-ported before.
2. Experimental
2.1. Reagents
Standard bulk drug sample of sparfloxacin was gifted by
Abbott Laboratories (Pakistan) Ltd. HPLC grade metha- nol was obtained from Merck Schuchardt OHG, Darm- stadt, Germany and Tedia company, INC. (USA). While the NSAIDs used were diclofenac sodium (Fenac 50 mg tablet), flurbiprofen (Vobifen 100 mg tablet), meloxicam (Xobix 7.5 mg tablets), mefenamic acid (Ponstan 250 mg tablet ), ibuprofen (Brufen 200 mg tablet) and naproxen (Proxen 250 mg tablet) of Tabros Pharma (Pakistan), Amson Vaccines and Pharma (Pvt) Ltd., Hillton Pharma (Pvt) Ltd., Parke Davis and Co. Ltd., Aventis (Pvt.) Ltd., Abbott Laboratories (Pakistan ) Ltd. and Roche Pakistan Ltd., respectively. Each product was labeled and expiry dates were not earlier than two years, at the time of study.
2.2. Instrumentation
Shimadzu HPLC system equipped with LC-20 AT VP Pump was utilized in the method development, SPD- 20AV Shimadzu UV visible detectors and Purospher STAR C18 (250 × 4.6 mm, 5 μm) column used for sepa- ration. The chromatographic and integrated data were recorded using a CBM-102 communication Bus Module Shimadzu to Intel Pentium 4 machine with Shimadzu CLASS-GC 10 software. Mobile phase was sonicated by DGU-14 AM on-line degasser, and filtered through 0.45- micron membrane filter. Rheodyne manual injector fitted with a 20 μL loop. Calibrated Pyrex glassware was used for the solution and mobile phase preparation.
2.3. Preparation of Solutions
10 mg of the SPFX and NSAIDs were diluted to 100 mL with mobile phase to produce a concentration of 100 μg·mL−1. Working solutions of SPFX and NSAIDs were prepared by diluting the stock solutions of with the same solvent to contain 0.15 - 80 µg·mL−1.
2.4. Analysis of Formulations
For quality control (QC) samples, twenty tablets of each formulation were accurately weighed, crushed to make a fine powder. Calculated amount of powder was weighed and found to be equivalent to 10 mg and transferred to a separate 100 mL volumetric flask. It was dissolved in the mobile phase. Solutions with high, medium and low concentrations i.e.; 80, 100 and 120% were prepared, and then filtered through a 0.45-μm Millipore filter, in order to separate out the insoluble excipients by the same pro- cedure as calibration standards but using different stock solutions. The sample solution was suitably diluted and used for the analysis.
3. Results and Discussion
2.5. Procedure for Human Serum
3.1 Method Development and Optimization Plasma sample, obtained from healthy volunteers, was
collected and stored at −20˚C. To an aliquot of 1.0 mL plasma, 10 mL of acetonitrile was added and the mixture was vortexed for one minute centrifuged at 10,000 rpm for 10 minutes. It was then alienated supernatant by fil-tration (0.45 µ pore size membrane filter). An aliquot se-rum sample was fortified with sparfloxacin and NSAIDs to get the final concentrations of 0.15 - 80 μg·mL−1.
The aim of the present study was to develop a simple, isocratic, accurate and sensitive HPLC method for the simultaneous determination of SPFX and NSAIDs. Dif- ferent C18 columns were used but SPFX and NSAIDs could not separate properly. Finally Purospher STAR C18 (25 × 4.6 mm, 5 μm) column provided the best peak shapes and efficiencies. To investigate the appropriate wavelength for simultaneous determination of sparflox- acin and all the NSAIDs, solutions of these compounds in the mobile phase were scanned by UV-visible spec- trophotometer in the range 200 - 400 nm. From the over- laid UV spectra (Figure 2), it was observed there was no
interference from the mobile phase or baseline distur- bance at 240 nm. It was, therefore, concluded that 240 nm is the most appropriate wavelength for analysis with suitable sensitivity.
2.6. Procedure of Interaction Studies
Sparfloxacin and interacting drugs (NSAIDs solutions (100 μg·mL–1) were prepared in buffers of pH 4, 7.4 and 9 individually. These solutions were mixed in 1:1 ratio in Erlenmeyer flasks individually to get 50 μg·mL–1 con-centrations; heated on a water bath at 37˚C ± 5˚C with constant stirring at 100 rpm speed. Aliquots of 5 mL were with-drawn at an interval 30 min for 180 minutes. The sample was diluted in suitable dilution then filtered through 0.45 μ filter membrane. Three replicates of fil-tered samples were injected to HPLC system.
Chromatographic conditions, especially the composi- tion of the mobile phase, were optimized through several trials to achieve symmetric peak shapes for SPFX and NSAIDs as well as shorter run time. Initially various mobile phases were tested to obtain the best separation and resolution. It was found that a mobile phase contain- ing a certain proportion of methanol and water gave symmetric peak shapes for all drugs. A mobile phase containing high proportion of methanol gives shorter run time. Therefore the final mobile phase of methanol and water in the ratio of 90:10 (v/v), provided good resolu-tion. These solvents are easily available, non-toxic, cheap and commonly used solvents for RP-HPLC. To select the optimum mobile phase pH range, 2.5 to 4.0 were inves-tigated, excellent performance was achieved at pH 2.7 adjusted with phosphoric acid. Flow rate was 1.5 mL·min–1 with isocratic elution.
The concentration of each drug was determined using linear equation and % availability was calculated. Effect of pH on the availability of sparfloxacin in presence of interacting drugs, was also monitored.
2.7. Statistical Analysis
[image:3.595.119.475.530.720.2]Standard regression curve analysis was performed by use of STATISTICA version 7.0 (USA), without intersecting through zero. Linearity graphs were obtained by Micro- soft Excel 2007 software. SPSS software version 10.0 (Carry, NC, USA) was used for the calculation of means, standard deviations, homoscedasticity of the calibration plots, and Student’s t-test.
3.2. Method Validation
The developed method was validated according to ICH guidelines [32]and USP 2002 [33]. It includes various parameters for example system suitability, selectivity, specificity, linearity, accuracy test, precision, robustness, ruggedness, sensitivity, limit of detection and quantifica- tion.
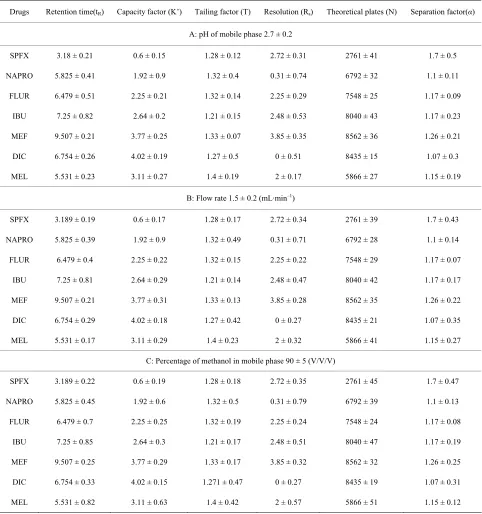
3.2.1. System Suitability
It is a vital section of method validation to make certain that the operational system is running appropriately through- out the analysis. The system was equilibrated with the initial mobile phase composition, followed by 10 tions of the same standard. These 10 consecutive injec-tions were used to evaluate the system suitability on each day of method validation. Parameters of system suitabil-ity are peaks symmetry (symmetry factor), theoretical plates of the column, resolution, mass distribution ratio (capacity factor) and relative retention [32,34]. They are summarized in Table 1.
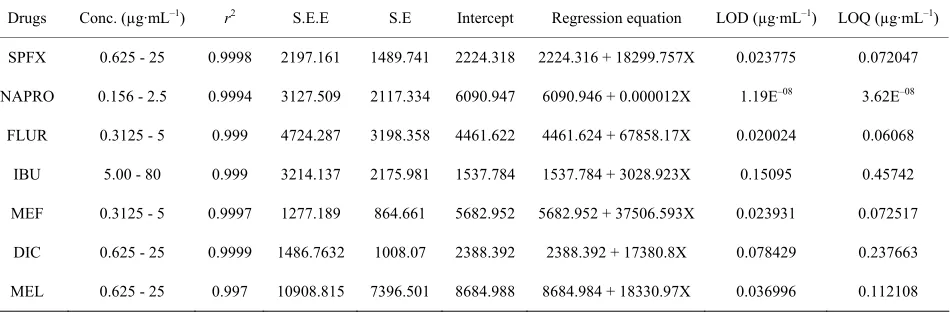
3.2.2 Linearity
The reason of the check for linearity was to demonstrate that the entire analytical system (including detector and data acquisition) presents a linear response and it is di- rectly proportional over the relevant concentration range
[image:4.595.55.540.433.551.2]of analytes [34]. These curves were obtained using the linear least squares regression procedure as shown in
Table 2 over the concentrations ranging from 0.15 - 80
μg·mL–1. These analysis results reveals good linear corre- lations between all the drugs having correlation coeffi- cient (r2) value >0.999. The homoscedasticity of the ca- libration plots, tested by Friedman’s tests were found to be significantly linear over the tested ranges (Figures 3(a)
and (b)).
3.2.3. Accuracy
The accuracy of the method was determined from the recovery results of spiked placebo samples. Stock solu- tions of drugs in appropriate portions were spiked into blank placebo matrix to produce concentrations of 80%, 100% and 120% of the theoretical concentration. Mean recovery of spiked samples were in the ranges of 98.42% - 102.75%, Recovery tests were performed by adding known amounts of standard solutions to sample followed by analysis using proposed method. Five runs were per- formed for every concentration and then peak area was calculated (Table 3, Figure 3(c)). The average recovery
for each level was calculated as indicated by Association of Official Analytical Chemists International [35-37]. Thus, it can be concluded that used excepients (normally present in tablets) did not interfere with drug present in tablets and that filtration medium did not absorb the drug
Table 1. System suitability parameters.
Drugs Retention time(tr) Capacity factor (K’) Tailing factor (T) Resolution (Rs) Theoretical plates (N) Separation factor (α)
SPFX 3.189 0.6 1.28 2.72 2761 1.7
NAPRO 5.825 1.92 1.32 0.31 6792 1.1
FLUR 6.479 2.25 1.32 2.25 7548 1.17
IBU 7.25 2.64 1.21 2.48 8040 1.17
MEF 9.507 3.77 1.33 3.85 8562 1.26
DIC 6.754 4.02 1.27 - 8435 1.07
[image:4.595.64.539.580.736.2]MEL 5.531 3.11 1.4 2 5866 1.15
Table 2. Regression characteristics.
Drugs Conc. (µg·mL–1) r2 S.E.E S.E Intercept Regression equation LOD (µg·mL–1) LOQ (µg·mL–1)
SPFX 0.625 - 25 0.9998 2197.161 1489.741 2224.318 2224.316 + 18299.757X 0.023775 0.072047
NAPRO 0.156 - 2.5 0.9994 3127.509 2117.334 6090.947 6090.946 + 0.000012X 1.19E–08 3.62E–08
FLUR 0.3125 - 5 0.999 4724.287 3198.358 4461.622 4461.624 + 67858.17X 0.020024 0.06068
IBU 5.00 - 80 0.999 3214.137 2175.981 1537.784 1537.784 + 3028.923X 0.15095 0.45742
MEF 0.3125 - 5 0.9997 1277.189 864.661 5682.952 5682.952 + 37506.593X 0.023931 0.072517
DIC 0.625 - 25 0.9999 1486.7632 1008.07 2388.392 2388.392 + 17380.8X 0.078429 0.237663
Table 3. Accuracy of sparfloxacin and NSAIDs.
Assay (spiking method)
Parameters Conc. (%) spiked
SPFX NAPRO FLUR IBU MEF DICLO MEL
12 12.19 11.662 12.296 12.308 12.034 11.696 11.923
15 14.707 15.126 14.759 15.431 14.848 14.678 14.991
Conc. found
18 18.223 17.596 18.46 18.34 18.446 18.403 18.323
80 101.584 97.19 102.47 102.57 100.29 97.466 99.36
100 98.05 100.841 98.395 102.88 98.991 97.853 99.944
% Recovery
120 101.244 97.758 102.56 101.89 102.48 102.24 101.179
Assay in serum
Parameters Conc. (%) spiked
SPFX NAPRO FLUR IBU MEF DICLO MEL
12 12.08 11.658 12.103 12.229 12.014 11.675 11.723
15 14.617 15.029 14.623 15.371 14.654 14.568 14.791
Conc. found
18 18.125 17.526 18.37 18.194 18.242 18.113 18.123
80 100.66 97.15 100.86 101.91 100.12 97.291 97.691
100 97.446 100.193 97.486 102.47 97.693 97.12 98.606
% Recovery
120 100.694 97.366 102.06 101.08 101.34 100.63 100.683
(a) (b)
(c) (d)
Figure 3. (a) Representative chromatogram of SPFX and NSAIDs at 240 nm; (b) Representative chromatogram of SPFX and NSAIDs at 240 nm; (c) Representative chromatogram of SPFX and NSAIDs at 240 nm in both mobile phase and human se-rum; (d) Representative chromatogram of SPFX and NSAIDs at 240 nm with and without excepients.
to any extent. High recovery indicated that the method has a high degree of accuracy for the simultaneous de- termination of sparfloxacin with selected NSAIDs.
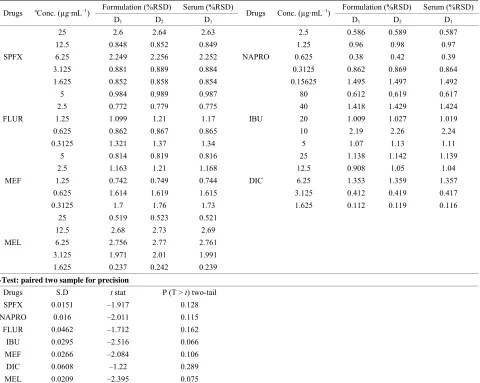
3.2.4. Precision
Precision of the anticipated method was determined by repeatability (intra-day precision) and intermediate pre- cision (intra-day precision). It is expressed as relative standard deviation (RSD). Every sample was injected
five times. Both intra- and inter-day RSD values were in the range of 0.112% to 2.77% confirming good preci- sion (Table 4). Student t-test was applied to evaluate
Table 4. Precision of sparfloxacin and NSAIDs (n = 5).
Formulation (%RSD) Serum (%RSD) Formulation (%RSD) Serum (%RSD)
Drugs aConc. (µg·mL–1)
D1 D2 D1
Drugs Conc. (µg·mL–1)
D1 D2 D1
25 2.6 2.64 2.63 2.5 0.586 0.589 0.587
12.5 0.848 0.852 0.849 1.25 0.96 0.98 0.97
6.25 2.249 2.256 2.252 0.625 0.38 0.42 0.39
3.125 0.881 0.889 0.884 0.3125 0.862 0.869 0.864
SPFX
1.625 0.852 0.858 0.854
NAPRO
0.15625 1.495 1.497 1.492
5 0.984 0.989 0.987 80 0.612 0.619 0.617
2.5 0.772 0.779 0.775 40 1.418 1.429 1.424
1.25 1.099 1.21 1.17 20 1.009 1.027 1.019
0.625 0.862 0.867 0.865 10 2.19 2.26 2.24
FLUR
0.3125 1.321 1.37 1.34
IBU
5 1.07 1.13 1.11
5 0.814 0.819 0.816 25 1.138 1.142 1.139
2.5 1.163 1.21 1.168 12.5 0.908 1.05 1.04
1.25 0.742 0.749 0.744 6.25 1.353 1.359 1.357
0.625 1.614 1.619 1.615 3.125 0.412 0.419 0.417
MEF
0.3125 1.7 1.76 1.73
DIC
1.625 0.112 0.119 0.116
25 0.519 0.523 0.521
12.5 2.68 2.73 2.69
6.25 2.756 2.77 2.761
3.125 1.971 2.01 1.991
MEL
1.625 0.237 0.242 0.239
t-Test: paired two sample for precision
Drugs S.D t stat P (T > t) two-tail
SPFX 0.0151 –1.917 0.128
NAPRO 0.016 –2.011 0.115
FLUR 0.0462 –1.712 0.162
IBU 0.0295 –2.516 0.066
MEF 0.0266 –2.084 0.106
DIC 0.0608 –1.22 0.289
MEL 0.0209 –2.395 0.075
aConc. = concentrations, df = 4; SPFX, Sparfloxacin; MEL, Meloxicam; MEF, Mefenamic acid; DIC, Diclofenac sodium; FLUR, Flurbiprofen; IBU, Ibuprofen;
S.D, Standard Deviation; D1: Intra-day and D2: Inter-day variations.
3.2.5. Limit of Detection (LOD) and Quantification (LOQ)
The LOD and LOQ are calculated as: LOD = 3.3 µ/S and LOQ =10 µ/S; where µ is the standard deviation of the lowest standard concentration and S is the slope of the standard curve. The limits of detection (LOD) and quan- tification (LOQ) were determined from the calibration curve. The LOD and LOQ were shown in Table 2.
3.2.6. Specificity and Selectivity
The selectivity and specificity of the method was docu- mented by studying resolution factor of the peak of spar- floxacin from that of NSAID’s. The method confirmed good resolutions ≥2 (Table 1) and was found to be free
of hindrance from the excepients used in pharmaceutical formulation, which indicated the specificity of the system (Figure 3(d)).
3.2.7. Ruggedness
The ruggedness of the method was established by deter- mining SPFX and NSAIDs, in bulk materials, dosage formulation and in human serum in two different labs. Lab 1 was Research Institute of Pharmaceutical Sciences, De- partment of Pharmaceutical Chemistry, Faculty of Phar- macy, University of Karachi while other lab was lab 9, Department of Chemistry, Faculty of Science, University of Karachi. Two different instruments of same configure- tion i.e. LC 20, were used on different days by different analytes (Table 4). All the results were in good limits.
3.2.8. Robustness
Results are shown in Table 5.
4. Application of the Proposed Method for
In-Vitro
Interaction Study
Simultaneous determination of sparfloxacin, naproxen, flurbiprofen, ibuprofen, mefenamic acid, diclofenac so- dium, and meloxicam was achieved as above. The de- veloped method was also used on spiking the analytes in
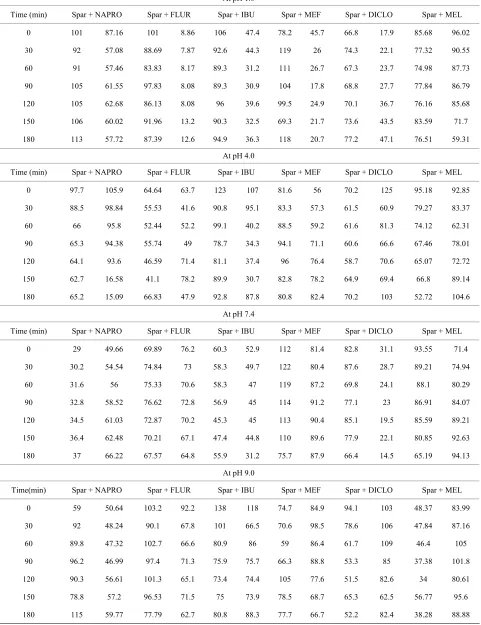
[image:7.595.57.539.212.726.2]human serum. The applicability of the proposed method was demonstrated for “in-vitro” interaction studies of sparfloxacin with these selected NSAIDs in simulated gastric juice and buffers of pH 4, 7.4 and 9. Sparfloxacin and the reacting drugs were analyzed by measuring the area under curve (AUC), % recovery and considerable drift in retention time. The results of possible interactions are given in Table 6.
Table 5. Robustness of the proposed method (n = 6).
Drugs Retention time(tR) Capacity factor (K’) Tailing factor (T) Resolution (Rs) Theoretical plates (N) Separation factor(α)
A: pH of mobile phase 2.7 ± 0.2
SPFX 3.18 ± 0.21 0.6 ± 0.15 1.28 ± 0.12 2.72 ± 0.31 2761 ± 41 1.7 ± 0.5
NAPRO 5.825 ± 0.41 1.92 ± 0.9 1.32 ± 0.4 0.31 ± 0.74 6792 ± 32 1.1 ± 0.11
FLUR 6.479 ± 0.51 2.25 ± 0.21 1.32 ± 0.14 2.25 ± 0.29 7548 ± 25 1.17 ± 0.09
IBU 7.25 ± 0.82 2.64 ± 0.2 1.21 ± 0.15 2.48 ± 0.53 8040 ± 43 1.17 ± 0.23
MEF 9.507 ± 0.21 3.77 ± 0.25 1.33 ± 0.07 3.85 ± 0.35 8562 ± 36 1.26 ± 0.21
DIC 6.754 ± 0.26 4.02 ± 0.19 1.27 ± 0.5 0 ± 0.51 8435 ± 15 1.07 ± 0.3
MEL 5.531 ± 0.23 3.11 ± 0.27 1.4 ± 0.19 2 ± 0.17 5866 ± 27 1.15 ± 0.19
B: Flow rate 1.5 ± 0.2 (mL·min–1)
SPFX 3.189 ± 0.19 0.6 ± 0.17 1.28 ± 0.17 2.72 ± 0.34 2761 ± 39 1.7 ± 0.43
NAPRO 5.825 ± 0.39 1.92 ± 0.9 1.32 ± 0.49 0.31 ± 0.71 6792 ± 28 1.1 ± 0.14
FLUR 6.479 ± 0.4 2.25 ± 0.22 1.32 ± 0.15 2.25 ± 0.22 7548 ± 29 1.17 ± 0.07
IBU 7.25 ± 0.81 2.64 ± 0.29 1.21 ± 0.14 2.48 ± 0.47 8040 ± 42 1.17 ± 0.17
MEF 9.507 ± 0.21 3.77 ± 0.31 1.33 ± 0.13 3.85 ± 0.28 8562 ± 35 1.26 ± 0.22
DIC 6.754 ± 0.29 4.02 ± 0.18 1.27 ± 0.42 0 ± 0.27 8435 ± 21 1.07 ± 0.35
MEL 5.531 ± 0.17 3.11 ± 0.29 1.4 ± 0.23 2 ± 0.32 5866 ± 41 1.15 ± 0.27
C: Percentage of methanol in mobile phase 90 ± 5 (V/V/V)
SPFX 3.189 ± 0.22 0.6 ± 0.19 1.28 ± 0.18 2.72 ± 0.35 2761 ± 45 1.7 ± 0.47
NAPRO 5.825 ± 0.45 1.92 ± 0.6 1.32 ± 0.5 0.31 ± 0.79 6792 ± 39 1.1 ± 0.13
FLUR 6.479 ± 0.7 2.25 ± 0.25 1.32 ± 0.19 2.25 ± 0.24 7548 ± 24 1.17 ± 0.08
IBU 7.25 ± 0.85 2.64 ± 0.3 1.21 ± 0.17 2.48 ± 0.51 8040 ± 47 1.17 ± 0.19
MEF 9.507 ± 0.25 3.77 ± 0.29 1.33 ± 0.17 3.85 ± 0.32 8562 ± 32 1.26 ± 0.25
DIC 6.754 ± 0.33 4.02 ± 0.15 1.271 ± 0.47 0 ± 0.27 8435 ± 19 1.07 ± 0.31
MEL 5.531 ± 0.82 3.11 ± 0.63 1.4 ± 0.42 2 ± 0.57 5866 ± 51 1.15 ± 0.12
Table 6. % Recovery of sparfloxacin with NSAID’s.
At pH 1.0
Time (min) Spar + NAPRO Spar + FLUR Spar + IBU Spar + MEF Spar + DICLO Spar + MEL
0 101 87.16 101 8.86 106 47.4 78.2 45.7 66.8 17.9 85.68 96.02
30 92 57.08 88.69 7.87 92.6 44.3 119 26 74.3 22.1 77.32 90.55
60 91 57.46 83.83 8.17 89.3 31.2 111 26.7 67.3 23.7 74.98 87.73
90 105 61.55 97.83 8.08 89.3 30.9 104 17.8 68.8 27.7 77.84 86.79
120 105 62.68 86.13 8.08 96 39.6 99.5 24.9 70.1 36.7 76.16 85.68
150 106 60.02 91.96 13.2 90.3 32.5 69.3 21.7 73.6 43.5 83.59 71.7
180 113 57.72 87.39 12.6 94.9 36.3 118 20.7 77.2 47.1 76.51 59.31
At pH 4.0
Time (min) Spar + NAPRO Spar + FLUR Spar + IBU Spar + MEF Spar + DICLO Spar + MEL
0 97.7 105.9 64.64 63.7 123 107 81.6 56 70.2 125 95.18 92.85
30 88.5 98.84 55.53 41.6 90.8 95.1 83.3 57.3 61.5 60.9 79.27 83.37
60 66 95.8 52.44 52.2 99.1 40.2 88.5 59.2 61.6 81.3 74.12 62.31
90 65.3 94.38 55.74 49 78.7 34.3 94.1 71.1 60.6 66.6 67.46 78.01
120 64.1 93.6 46.59 71.4 81.1 37.4 96 76.4 58.7 70.6 65.07 72.72
150 62.7 16.58 41.1 78.2 89.9 30.7 82.8 78.2 64.9 69.4 66.8 89.14
180 65.2 15.09 66.83 47.9 92.8 87.8 80.8 82.4 70.2 103 52.72 104.6
At pH 7.4
Time (min) Spar + NAPRO Spar + FLUR Spar + IBU Spar + MEF Spar + DICLO Spar + MEL
0 29 49.66 69.89 76.2 60.3 52.9 112 81.4 82.8 31.1 93.55 71.4
30 30.2 54.54 74.84 73 58.3 49.7 122 80.4 87.6 28.7 89.21 74.94
60 31.6 56 75.33 70.6 58.3 47 119 87.2 69.8 24.1 88.1 80.29
90 32.8 58.52 76.62 72.8 56.9 45 114 91.2 77.1 23 86.91 84.07
120 34.5 61.03 72.87 70.2 45.3 45 113 90.4 85.1 19.5 85.59 89.21
150 36.4 62.48 70.21 67.1 47.4 44.8 110 89.6 77.9 22.1 80.85 92.63
180 37 66.22 67.57 64.8 55.9 31.2 75.7 87.9 66.4 14.5 65.19 94.13
At pH 9.0
Time(min) Spar + NAPRO Spar + FLUR Spar + IBU Spar + MEF Spar + DICLO Spar + MEL
0 59 50.64 103.2 92.2 138 118 74.7 84.9 94.1 103 48.37 83.99
30 92 48.24 90.1 67.8 101 66.5 70.6 98.5 78.6 106 47.84 87.16
60 89.8 47.32 102.7 66.6 80.9 86 59 86.4 61.7 109 46.4 105
90 96.2 46.99 97.4 71.3 75.9 75.7 66.3 88.8 53.3 85 37.38 101.8
120 90.3 56.61 101.3 65.1 73.4 74.4 105 77.6 51.5 82.6 34 80.61
150 78.8 57.2 96.53 71.5 75 73.9 78.5 68.7 65.3 62.5 56.77 95.6
Availability of naproxen decreased up to 57.72%, 15.09%, 66.22% and 59.77% in simulated gastric juice and buffers of pH 4, 7.4 and 9 respectively. Good inter- action found between SPFX and flurbiprofen in simu- lated gastric juice (12.6%) and buffer of pH 4 (47.9%) while 64.8% and 62.7% available at pH 7.4 and 9 respec- tively. When ibuprofen interacted with sparfloxacin, the availability was significantly decreased up to 31.2% - 36.3% in selected simulated gastric juice and pH 7.4. While in pH 4 and 9, availability decreased to little ex- tend. Availability of mefenamic acid significantly de- creased in simulated gastric juice only. However, no or little interaction have been seen incase of pH 4, 7.4 and 9. The % availability of diclofenac Na decreased to 47.1 in simulated gastric juice, 14.5 in pH 7.4 and increased to 103% in pH 4 and 82.4 in pH 9. Meloxicam was avail- able up to 59.31% - 104.6% at all preferred pH.
On the basis of above consequences, it can be concluded that these interactions were pH dependent and tempera- ture also favored. Significant changes in % availability of drugs might be due to some changes in drug at its chro- mophoric group, resulting in the distinction of molar ab- sorptivity value which itself is an evidence of drug inter- action with NSAID’s. Moreover, variation in availability had occurred due to an addition of functional group being attached to the pharmacophore of sparfloxacin and due to loss of axuochromes. Advance in-vivo studies are needed for further evaluation.
5. Conclusion
A new method for the simultaneous determination of SPFX and NSAIDs, in bulk materials, pharmaceutical dosage formulation and human serum has been developed for the first time. The proposed HPLC method is simple, rapid, isocratic, specific, accurate and precise. Hence, it can be recommended for the routine quality control and evalua- tion of clinical data as well, of these drugs. It was appar- ent that sparfloxacin may interact with commonly used NSAID’s like ibuprofen, diclofenac sodium, flurbiprofen, Mefenamic acid and meloxicam which may result in convulsions. Therefore, above mentioned method is ap- plicable in finding out the “in vitro” interactions of spar- floxacin with commonly used NSAID’s.
6. Acknowledgements
Authors wish to thank Higher Education Commission, Pakistan, for providing scholarship to Ms Somia Gul un- der Indigenous 5000 Ph.D Fellowship Program Batch IV.
REFERENCES
[1] J. M. Nelson, T. M. Chiller, J. H. Powers and F. J. An- gulo, “Fluoroquinolone-Resistant Campylobacter Species and the Withdrawal of Fluoroquinolones from Use in
Poultry: A Public Health Success Story,” Clinical Infec- tious Diseases,Vol. 44, No. 7, 2007, pp. 977-980. doi:10.1086/512369
[2] D. V. Ivanov and S. V. Budanov, “Ciprofloxacin and An- tibacterial Therapy of Respiratory Tract Infections,” An- tibiotiki i Khimioterapiia, Vol. 51, No. 5, 2006, pp. 29-37. [3] A. Sivalakshmidevi, K. Vyas and G. Om Reddy, “Spar-
floxacin, an Antibacterial Drug,” Acta Crystallographica, Vol. 56, No. 3, 2000, pp. 115-116.
[4] O. G. Francis, G. F. Roger and G. W. David, “Antibiotic and Chemotherapy,” 7th Edition, Churchill Livingstone, Philadelphia, 1997.
[5] Medical Economics Staff, “Physician Desk Reference,” 52nd Edition, Churchill Livingstone, New York, 1998. [6] M. I. Andersson and A. P. MacGowan, “Development of
the Quinolones,” Journal of Antimicrobial Chemotherapy, Vol. 51, Suppl. 1, 2003, pp. 1-11.
[7] M. S. Barrett, R. N. Jones, M. E. Erwin, D. M. Johnson and B. M. Briggs, “Antimicrobial Activity Evaluations of Two New Quinolones,” Diagnosis of Microbiology Infec- tious Diseases, Vol. 14, No. 5, 1991, pp. 389-401. doi:10.1016/0732-8893(91)90066-O
[8] G. C. Crumplin, “Aspects of Chemistry in the Develop- ment of the 4-Quinolone Antibacterial Agents,” Reviews of Infectious Diseases, Vol. 10, Suppl. 1, 1988, pp. 2-9. [9] N. Sultana, M. S. Arayne, S. Gul and S. Shahmim, “Spar-
floxacin-Metal Complexes as Antifungal Agents—Their Synthesis, Characterization and Antimicrobial Activities,”
Journal of Molecular Structure, Vol. 975, No. 1-3, 2010, pp. 285-291. doi:10.1016/j.molstruc.2010.04.038
[10] P. H. Edelstein, M. A. C. Edelstein, K. H. Lehr and J. J. Ren, “In-Vitro Activity of Levofloxacin against Clinical Isolates of Legionella spp., Its Pharmacokinetics in Gui- nea Pigs, and Use in Experimental Legionella pneumo- phila Pneumonia,” Journal of Antimicrobial Chemother- apy, Vol. 37, No. 1, 1996, pp. 117-126.
doi:10.1093/jac/37.1.117
[11] J. A. O. Gonzalez, M. C. Mochon and F. J. B. De La Rosa, “Simultaneous Determination of Cefepime and the Qui- nolones Garenoxacin, Moxifloxacin and Levofloxacin in Human Urine by HPLC-UV,” Mikrochimica Acta, Vol. 151, No. 1-2, 2005, pp. 39-45.
doi:10.1007/s00604-005-0391-y
[12] H. A. Nguyen, J. Grellet, B. B. Ba, C. Quentin and M. C. Saux, “Simultaneous Determination of Levofloxacin, Ga- tifloxacin and Moxifloxacin in Serum by Liquid Chro- matography with Column Switching,” Journal of Chro- matography B. Analytical Technologies in the Biomedical and Life Sciences, Vol. 810, No. 1, 2004, pp. 77-83. [13] E. Nemutlu, S. Kir, O. Ozyuncu and M. S. Beksac, “Si-
multaneous Separation and Determination of Seven Qui- nolones Using HPLC: Analysis of Levofloxacin and Mo- xifloxacin in Plasma and Amniotic Fluid,” Chroma- tographia, Vol. 66, Suppl. 1, 2007, pp. 15-24.
doi:10.1365/s10337-007-0292-9
Antibiotics in Pharmaceutical Formulations Using Iron Salts,” Medicinal Chemistry Research, Vol. 19, No. 9, 2009, pp. 1259-1272.
[15] N. Sultana, N. Shafi, A. Naz and H. Shamshad, “RP- HPLC Method for the Simultaneous Determination of Diltiazem and Quinolones in Bulk Formulations and Hu- man Serum,” Journal of Chilian Chemical Society, Vol. 54, No. 4, 2009, pp. 289-293.
[16] N. Sultana, M. S. Arayne and W. Shehzad, “Simultaneous Determination of Ceftriaxone Sodium and Statins Drugs in Pharmaceutical Formulations and Human Serum by RP-HPLC,” Journal of The Chilean Chemical Society, Vol. 55, No. 2, 2010, pp. 193-198.
[17] S. Koichi, W. L. Lee, T. Toyohide, S. Yasuhide, S. Kiyo- hito, T. Yuji and K. Susumu, “Rapid and Simultaneous Determination of Nonsteroidal Anti-Inflammatory Drugs in Human Plasma by LC-MS with Solid-Phase Extrac- tion,” Analytical and Bioanalytical Chemistry, Vol. 384, No. 7-8, 2006, pp. 1501-1505.
[18] S. Koichi, W. L. Lee, T. Toyohide, S. Yasuhide, S. Kiyo- hito, T. Yuji and K. Susumu, “On-Line Sample Extrac- tion and Enrichment of Non-Steroidal Anti-Inflammatory Drugs by Pre-Column in Capillary Liquid Chromatogra- phy Mass Spectrometry,” Journal of Chromatography B, Vol. 846, No. 1-2,2007, pp. 176-183.
doi:10.1016/j.jchromb.2006.08.041
[19] K. E. V. Nagoji, S. Vijayasrinivas, M. K. Kumar, N. Mathivanan, M. S. Kumar and M. E. Rao, “Simultaneous Reverse Phase HPLC Estimation Of Nimesulide and Di- clofenac Sodium,” Indian Journal of Pharmaceutical Sci- ences, Vol. 65, No. 4, 2003, pp. 407-409.
[20] N. Srinivas, L. Narasu, B. P. Shankar and R. Mullangi, “Development and Validation of a HPLC Method for Simultaneous Quantitation of Gatifloxacin, Sparfloxacin and Moxifloxacin Using Levofloxacin as Internal Stan- dard in Human Plasma: Application to a Clinical Phar- macokinetic Study,” Biomedical Chromatography, Vol. 22, No. 11, 2008, pp. 1288-1295. doi:10.1002/bmc.1060 [21] H. R. N. Marona, J. A. S. Zuanazz and E. E. S. Schapoval
“Determination of Sparfloxacin and Its Degradation Prod- ucts by HPLC,” Journal of Antimicrobial Chemotherapy, Vol. 44, No. 2, 1999, pp. 301-302
doi:10.1093/jac/44.2.301
[22] A. M. El-Didamony, “Fluorescence Probe Enhanced Spec- trofluorimetric Method for the Determination of Spar- floxacin in Tablets and Biological Fluids,” Luminescence, Vol. 26, No. 2, 2010, pp. 112-117.
doi:10.1002/bio.1192
[23] A. M. El-Didamony, “Spectrophotometric Determination Method of Sparfloxacin in Pharmaceutical Preparations by Ternary Complex Formation with Pd(II) and Eosin,”
Analytical Letters, Vol. 40, No. 14, 2007, pp. 2708-2720. doi:10.1080/00032710701588408
[24] H.-Y. Cho, S.-A. Park and Y.-B. Lee, “Improvement and
Validation of an HPLC Method for Examining the Effects of the MDR1 Gene Polymorphism on Sparfloxacin Phar- macokinetics,” Journal of Chromatography B, Vol. 834, No. 1-2, 2006, pp. 84-92.
[25] A. P. Argekar and S. J. Shah, “Stability Indicating HPLC Method for the Determination of Sparfloxacin (Spar),”
Analytical Letters, Vol. 32, No. 7, 1999, pp. 1363-1370. doi:10.1080/00032719908542903
[26] H. R. N. Marona and E. E. S. Schapoval, “A High-Per- formance Liquid Chromatographic Assay for Sparflox- acin,” Journal of Pharmaceutical and Biomedical Analy- sis, Vol. 20, No. 3, 1999, pp. 413-417.
doi:10.1016/S0731-7085(98)00102-2
[27] N. N. Rahman and S. Ahmad, “Development of Quantita- tive Analysis of Sparfloxacin by High Performance Liq- uid Chromatography,” The Dhaka University Journal of Pharmaceutical Sciences, Vol. 6, No. 1, 2007.
[28] A. Srikar, K. P. Channabasavaraj, G. Dharmamoorty, N. Valmiki, C. Chinnappa and T .V. Babu, “Spectrophoto- metric Methods for Quantitative Estimation of Sparflox- acin in Bulk and Pharmaceutical Dosage Forms,” Journal of Pharmaceutical Sciences and Research,Vol. 1, No. 2, 2009, pp. 13-15.
[29] J. R. Brouwers, “Drug Interactions with Quinolone Anti- bacterials,” Drug Safely, Vol. 7, No. 4, 1999, pp. 268-281. doi:10.2165/00002018-199207040-00003
[30] T. Yoshino, M. Noguchi, H. Okutsu, A. Kimoto, M. Sa- samata and K. Miyata, “Celecoxib Does Not Induce Con- vulsions nor Does It Affect GABAA Receptor Binding Activity in the Presence of New Quinolones in Mice,”
European Journal of Pharmacology, Vol. 501, No. 1-3, 2005, pp. 69-76. doi:10.1016/j.ejphar.2004.11.038 [31] F. Leite, “Validation in Chemical Analysis Atom,” 4th Edi-
tion, Átomo, São Paulo, 2002, pp. 69-72.
[32] United States Pharmacopeia, “United States Pharmacopeial Convention,” 21st Edition, Rockville, 2002.
[33] L. N. Linda and Center for Drug Evaluation and Research (CDER) “Reviewer Guidance: Validation of Chroma- tographic Methods,” Center for Drug Evaluation and Re-search, Rockville, 1994.
[34] M. W. Dong, “Modern HPLC for Practicing Scientists,” John Wiley and Sons, Hoboken, 2006.
doi:10.1002/0471973106
[35] United States Pharmacopeia, 28th Edition, United States Pharmacopeial Convention, Rockville, 2005.
[36] ICH, “International Conference on Harmonisation of Tech- nical Requirements for Registration of Pharmaceuticals for Human Use,” Vol. 4, Washington DC, 11-12 Sep- tember 2002, pp. 69-72.