LEABHARLANN CHOLAISTE NA TRIONOIDE, BAILE ATHA CLIATH TRINITY COLLEGE LIBRARY DUBLIN OUscoil Atha Cliath The University of Dublin
Terms and Conditions of Use of Digitised Theses from Trinity College Library Dublin
Copyright statement
All material supplied by Trinity College Library is protected by copyright (under the Copyright and Related Rights Act, 2000 as amended) and other relevant Intellectual Property Rights. By accessing and using a Digitised Thesis from Trinity College Library you acknowledge that all Intellectual Property Rights in any Works supplied are the sole and exclusive property of the copyright and/or other I PR holder. Specific copyright holders may not be explicitly identified. Use of materials from other sources within a thesis should not be construed as a claim over them.
A non-exclusive, non-transferable licence is hereby granted to those using or reproducing, in whole or in part, the material for valid purposes, providing the copyright owners are acknowledged using the normal conventions. Where specific permission to use material is required, this is identified and such permission must be sought from the copyright holder or agency cited.
Liability statement
By using a Digitised Thesis, I accept that Trinity College Dublin bears no legal responsibility for the accuracy, legality or comprehensiveness of materials contained within the thesis, and that Trinity College Dublin accepts no liability for indirect, consequential, or incidental, damages or losses arising from use of the thesis for whatever reason. Information located in a thesis may be subject to specific use constraints, details of which may not be explicitly described. It is the responsibility of potential and actual users to be aware of such constraints and to abide by them. By making use of material from a digitised thesis, you accept these copyright and disclaimer provisions. Where it is brought to the attention of Trinity College Library that there may be a breach of copyright or other restraint, it is the policy to withdraw or take down access to a thesis while the issue is being resolved.
Access Agreement
By using a Digitised Thesis from Trinity College Library you are bound by the following Terms & Conditions. Please read them carefully.
Development of a nanowire-based assay for
cancer biomarker detection in complex
biological fluids
Submitted to the School of Clinical Medicine
for completion of doctoral studies
by
Omar Kazem Mabfoud
Under the supervision of Prof. Yuri Volkov
TRINITY LIBRARY
2 7 JUL 2016
Declaration
1 declare that this thesis has not been submitted as an exercise for a degree at this or any other university and it is entirely my own work. Any unpublished and/or published work of others is duly acknowledged in the text wherever included.
1 agree to deposit this thesis in the University’s open access institutional repository or allow the library to do so on my behalf, subject to Irish Copyright Legislation and
Trinity College Library conditions of use and acknowledgement. 1 consent the library to lend or copy this thesis upon request.
Date:
7/0/
Summary
The cost of delivering healthcare continues to increase to phenomenal proportions with lung cancer, breast cancer, colorectal cancer and prostate cancer accounting for the majority of the economic burden associated with cancer care in the EU. In this era of personalised medicine, medical treatments can now be selected and tailored depending on the specific biomarker profile of the patient. Multiplexed analysis of biomarkers is seen as a necessity for improving the future of biomarker-guided medicine. Nanomaterials are seen as one potential avenue for investigation in an attempt to reduce assay costs and increase multiplexing capabilities, and one of the key enabling technologies in the development of the next generation of clinical diagnostic assays.
Acknowledgements
I would like to sincerely acknowledge the cooperation, guidance, patience, support and understanding afforded to me by Aoife, my parents, Hassan and Phyllis, my family, Yuri and friends and colleagues both past and present, during the fulfilment of the work contained henceforth. To name each individual would certainly cause unintentional omission, and all words of mine would fall short of expressing the true gratitude which 1 extend toward you all. 1 am much indebted to every one of you.
There are many lyrical analogies which spring to mind when 1 think of the past few years. For me, few capture the essence of our collective endeavours better than those immortal words sung by Luke Kelly, once upon a time;
"With our nets and gear we're faring
On the wild and wasteful ocean
It's out there on the deep
We harvest and reap our bread
As we hunt the bonny shoals of herring...”
My wish is that 1 can be of some help to each of you in the same way that you are to me.
Sincerely,
Publications List
Detection of ErbB2: nanotechnological solutions for clinical diagnostics. Omar K. Mahfoud. Tatsiana Y. Rakovich, Adriele Prina-Mello, Dania Movia, Frauke Alves and Yuri Volkov. RSC Advances, 2014, 4, pp 3422-3442. DOl: 10.1039/C3RA45401K, December 2013.
Highly Sensitive Single Domain Antihody-Quantum Dot Conjugates for Detection of HER2 Biomarker in Lung and Breast Cancer Cells. Tatsiana Y. Rakovich, Omar K. Mahfoud. Bashir M. Mohamed, Adriele Prina-Mello, Kieran Crosbie-Staunton, Tina Van Den Broeck, Line De Kimpe, Alyona Sukhanova, Daniel Baty, Aliaksandra Rakovich, Stefan
A. Maier, Frauke Alves, Frans Nauwelaers, Igor Nabiev, Patrick Chames, and Yuri Volkov. ACS Nano, 2014, 8 (6], pp 5682-5695. DOI: 10.1021/nn500212h, May 2014.
Silver nanowires as prospective carriers for drug delivery in cancer treatment: an in vitro biocompatibility study on lung adenocarcinoma cells and fibroblasts. Manisha Singh, Dania Movia, Omar K. Mahfoud. Yuri Volkov, Adriele Prina-Mello. European Journal of Nanomedicine. 2013, 5, 4, pp 195-204. DOI: 10.1515/ejnm-2013- 0024, December 2013.
Heparin conjugated quantum dots for in vitro imaging applications. Ciaran M. Maguire, Omar K. Mahfoud. Tatsiana Y. Rakovich, Valerie Gerard, Adriele Prina-Mello, Yurii K. Gun'ko, Yuri Volkov. Nanomedicine. 2014 10, 8, 1853-61. DOI: 10.1016/j.nano.2014.04.009. May 2014.
Interrogation of defined-length engineered nanomaterials using flow cytometry. Aligning nanowires for high-throughput assays. Omar K. Mahfoud. Joeseph McCarthy, Laura Kickham, Frans Nauwelaers, Adriele Prina-Mello, Yuri Volkov. Manuscript in preparation.
Table of Contents
Table of Contents Table of Figures Table of Tables Abbreviations
xiv xvi X
Chapter 1: Introduction and Literature Review; Detection of ErbB2: Nanotechnological solutions for clinical diagnostics
1.1 Introduction
1.1.1 Healthcare challenges, nanomaterials and thesis focus 1.1.1.1 Nanomaterials
1.1.1.2 Thesis focus
1.1.1.3 Thesis workflow synopsis graphic 1.1.2 Cancer
1.1.3 Principle of ErbB2 function
1.1.4 Clinical importance of ErbB2 detection: Focus on breast cancer 1.1.5 Soluble ErbB2: Clinical importance in cancer diagnosis
1.1.6 Nanotechnological answers to current diagnostic limitations 1.2 Clinical methodologies for the detection and quantification of ErbB2
1.2.1 Genetic detection and quantification of ErbB2 1.2.1.1 Fluorescent in-situ hybridisation [FISH) 1.2.1.2 Chromogenic in-situ hybridisation (CISH) 1.2.1.3 mRNA in-situ hybridisation (mRNA ISH) 1.2.1.4 Genomic hybridisation arrays
1.2.1.5 Appraisal of ErbB2 gene detection techniques 1.2.2 Detection and Quantification of ErbB2 protein
1.2.2.1 Immuno-histochemical detection of ErbB2 protein 1.2.2.2 Enzyme-linked Immuno-Sorbent assays [ELISAs) 1.3 Enhancing ErbB2 detection using nanotechnology-based tools
1.3.1 Nanomaterials for molecular imaging and detection purposes 1.3.2 Nanoparticle applications in in vitro ErbB2 assays
1.3.2.1 Nanoparticles in optical detection of ErbB2 1.3.2.2 Detection of ErbB2 using metal nanoparticles 1.4 Nanoparticle applications for in vivo ErbB2 imaging
1.4.2 X-ray Computed Tomography (XRCT) of ErbB2 tumours using metal nanoparticles
1.4.3 Magnetic imaging of ErbB2 tumours using magnetic nanoparticles 1.5 Conclusions
1.6 Thesis Aims 1.7 References 2.1 Materials
41 43 45 46 53 39
2.2 Methods for Chapter 3 56
2.2.1 Cell culture 56
2.2.2 Morphological imaging of cell lines 56
2.2.3 Assessment of performance of ErbB2 antibody for use
in nanoprobe platform 57
2.2.3.1 Western Blotting assessment of total ErbB2 protein in cell lines 57 2.2.3.2 ELISA quantification of ErbB2 protein in whole cell lysate 60 2.2.3.3 Fluorescent staining of cancer cell lines with fluorescent
ErbB2 antibody 60
2.2.4 Nanomaterials 61
2.2.4.1 Nanowires 61
2.2.4.2 Nanospheres/Microspheres 61
2.2.4.3 Bulk nanomaterial imaging approach 61
2.2.4.4 Nanoparticle Tracking Analysis 62
2.2.5 Functionalisation of nanomaterials with antibody 62 2.2.5.1 Nanomaterial stock concentration determination 62 2.2.5.2 Surface functionalisation of nanomaterials 63 2.2.5.3 Observation of EDC reaction temperature by flow
cytometric approach 64
2.2.6 Characterisation of antibody-conjugated nanomaterials 65
2.2.6.1 Fluorescent confocal microscopy 65
2.2.6.2 Atomic Force Microscopy 65
2.2.6.4 Flow Cytometry 65
2.2.6.5 Nanoparticle Tracking Analysis 66
2.2.6.6 Spectroscopy 66
2.2.6.7 Gel Electrophoresis 66
2.2.7 Assessment of functionalised nanowire stability using flow cytometry 66
2.2.8 Initial proof-of-concept testing of developed nanoprobe platform 67
2.2.8.1 Detection of sErbB2 using the developed nanowire platform 67
2.2.9 Further assay development & FACS analysis approaches 67
2.2.9.1 Antibody pair selection for nanoprobe assay 67
2.2.9.2 Nanoparticle assay development 68
2.2.9.3 FACS analysis of nanomaterial-based assays 68
2.2.9.4 Detection of sErbB2 in spiked plasma 70
2.2.9.5 Comparison of fluorophores 70
2.2.10 Analysis of nanowire signatures using flow cytometry 70
2.2.10.1 Size distribution determination of silver nanowires
and polystyrene spheres 70
2.2.10.2 Data capture 71
2.2.10.3 Comparison of scatter properties of AgNWs with
spherical particles using flow cytometry 71
2.2.10.4 Analysis of AgNW length-associated response
using SSC-W gating strategy 71
2.2.10.5 Curve fitting calculation for AgNW optical response 71
2.2.11 Development of novel technological platform for
fluorescent nanoparticle assays 72
2.2.11.1 Setup of integrated microfluidics and optical
system for nanoparticle analysis 72
2.2.11.2 Feasibility testing of integrated technological
platform for nanoparticle analysis 73
2.2.11.3 Comparison of particle detection in RDS-CLX
acquisition system vs conventional flow cytometer 73
2.2.11.4 Detection of fluorescent nanoparticles using the
RDS-CLX system 74
2.3 Methods for Chapter 4 74
2.3.1 Cell culture 74
2.3.2 Antibody pair selection for EGFR and PSA biomarker detection 74
2.3.3 Nanowire functionalisation 75
2.3.4 ELISA quantification of soluble proteins in biological samples 75
2.3.4.1 Ethical approval for study 75
2.3.4.2 Soluble protein quantification in clinically
relevant biological samples and cell lysates 75
2.3.5 Detection of cancer biomarkers using the developed
nanowire platform 75
2.3.6 Comparison of theoretical reactive surface area
of nanowire and ELISA platforms 75
2.4 Synopsis of techniques used to examine nanomaterials 76
2.5 References 78
3.1 Results Part 1: Introduction 79
3.1.1 Nanomaterials 80
3.1.2 Inherent properties of nanomaterials: Focus on S/V characteristics 81
3.1.3 Synthesis of nanomaterials 82
3.1.3.1 Bottom-up synthesis of nanowires 82
3.1.3.2 Bottom-up synthesis of nanospheres 84
3.1.3.3 Top-down synthesis of nanomaterials 84
3.1.3.4 Nanomaterial functionalisation: exploiting
the inherent advantages of nanomaterials 85
3.1.4 Applications of Nanowires for Biosensing 87
3.1.4.1 Nanowires in optical biosensors 87
3.1.4.2 Nanowires in electrical/electrochemical biosensors 88
3.1.4.3 Nanowires in mechanical biosensors 88
3.1.4.4 Nanowires in magnetic biosensors 89
3.1.5 Flow cytometry; Application to nanowire analysis 90
3.1.6 Chapter 3 synopsis graphic 92
3.2 Results 93
3.2.1 Representative cell images for cell lines used in experiments 93
3.2.2 Western Blotting assessment of ErbB2 status in cancer cell lines 94
3.2.3 ELISA assessment of ErbB2 status in cancer cell lines 95
3.2.4 Assessment of fluorescent ErbB2 antibody
performance using cancer cell lines 96
3.2.5 Microscopic analysis of bulk nanomaterials 98
3.2.5.1 Microscopic analysis of silica nanowires 98
3.2.5.2 Microscopic analysis of CoNi nanowires 99
3.2.5.3 Microscopic analysis of Ag nanowires 100
3.2.5.4 Microscopic analysis of polystyrene microspheres 103
3.2.5.5 Microscopic analysis of silica nanospheres 104
3.2.6 Functionalisation of nanomaterials with antibodies 105
3.2.6.1 Determination of stock concentration of
nanowires using FACS 105
3.2.6.2 Determination of stock concentration of
silica nanoparticles using NanoSight NS500 106
3.2.6.3 Observation of EDC reaction temperature
by flow cytometric approach 107
3.2.7 Characterisation of antibody-conjugated nanowires 108
3.2.7.1 Fluorescent microscopy 108
3.2.7.2 Atomic force microscopy 109
3.2.7.3 Helium Ion Microscopy 112
3.2.7.4 Flow Cytometry 113
3.2.9 Characterisation of antibody-conjugated nanospheres 118
3.2.9.1 Fluorescent microscopy 118
3.2.9.2 Nanoparticle Tracking Analysis 119
3.2.9.3 Flow cytometry 120
3.2.9.4 Spectroscopy 122
3.2.9.5 Gel Electrophoresis 123
3.2.10 Proof-of-concept testing of the developed nanowire platform 124
3.2.10.1 Detection of sErbB2 using the developed nanowire platform 124
3.2.11 Advanced assay development 125
3.2.11.1 Detection of an sErbB2 concentration
range in a single analyte model 125
3.2.11.2 Detection of spiked sErbB2 in blood plasma
and comparison of nanosphere and nanowire assays 126
3.2.11.3 Comparison of fluorophores 129
3.2.12 Analysis of nanowire signatures using flow cytometry 131
3.2.12.1 Comparison of scatter properties of
nanowires and microspheres using flow cytometry 131
3.2.12.2 Comparison ofSSC-W response of AgNWs
and microspheres using flow cytometry 133
3.2.12.3 Gating strategy for analysis of length-associated
optical response in nanowires 134
3.2.12.4 Analysis of AgNW length associated
responses using SSC-W gating strategy. 136
3.2.12.5 Curve fitting calculation for AgNW optical response 137
3.2.13 Comparison of particle detection in custom-built
acquisition system vs conventional flow cytometer 139
3.2.13.1 Detection of standardised fluorescent
microspheres using the RDS-CLX system 140
3.2.13.2 Detection of fluorescent nanowires
using the RDS-CLX system 141
3.3 Discussion 142
3.3.1Assessment of antibody performance 142
3.3.2 Characterisation of bulk nanomaterials 143
3.3.2.1 Nanowire characterisation 143
3.3.2.2 Nanosphere & microsphere characterisation I44
3.3.3 Functionalisation of nanomaterials with antibody I44
3.3.3.1 Population assessment of nanomaterials:
Determining concentration of nanomaterial suspensions 144
3.3.3.2 Observation of EDC reaction temperature by
flow cytometric approach I45
3.3.4 Assessment of nanomaterial functionalisation 14^
3.3.4.1 Approaches for assessment of antibody
conjugation on nanowires I45
3.3.4.2 Approaches for assessment of antibody
conjugation on nanospheres 14^
3.3.4.3 Assessment of antibody conjugation on nanomaterials 15)
3.3.5 Detection of sErbB2 using developed nanomaterial-based platforms 15
3.3.6 Detection of ErbB2 concentration range in single analyte system 15;
3.3.7 Detection of sErbB2 in spiked plasma 15,
3.3.8 Comparison of fluorophores 15'^
3.3.9 Analysis of nanowire signatures using flow cytometry 151
3.3.9.1 Comparison of scatter properties of AgNWs
with spherical particles using flow cytometry 151
3.3.9.2 Comparison of SSC-W response of AgNWs
and spherical particles using flow cytometry 151
3.3.9.3 Analysis of length-associated response in
nanowires using SSC-W gating strategy 15f
3.3.10 Comparison of particle detection in custom-built
acquisition system vs conventional flow cytometer 157
3.3.11 Concluding key-points 158
3.4 References 159
4.1 Results Part 2: Introduction 163
4.1.1 Biomarkers as indicators of disease 164
4.1.2 Cancer biomarker assessment in blood 167
4.1.3 Developing future cancer biomarker assays for blood fractions 169
4.1.3.1 Identifying proteins of interest in blood 169
4.1.3.2 Validation of novel cancer biomarker assays 170
4.1.3.3 Cancer biomarker multiplexing 170
4.2 Results 172
4.2.1 Detection of spiked cancer biomarkers in complex biological media 172
4.2.1.1 Detection of spiked sErbB2 in blood plasma
using the nanowire assay 172
4.2.1.2 Detection of spiked EGFR in blood plasma
using nanowire assay 174
4.2.1.3 Detection of spiked PSA in single analyte model
using the nanowire assay 175
4.2.1.4 Detection of PSA biomarker in cell lysates
using the nanowire assay 177
4.2.2 Detection of cancer biomarkers in clinical samples 179
4.2.2.1 Detection of native ErbB2 cancer biomarker
in blood using nanowire assay 180
4.2.2.2 Detection of native EGFR cancer biomarker
in blood using the nanowire assay 181
4.2.2.3 Detection of native PSA cancer biomarker
in urine using the nanowire assay 182
4.2.3 Comparison of theoretical reactive surface area of
nanowire assay and ELISA as enabling technology platforms 183
4.3 Discussion 186
4.3.1 Detection of spiked cancer biomarkers using the nanowire assay 186
4.3.2 Detection of native cancer biomarker in complex
biological samples using nanowire assay 187
4.3.3 Comparison of theoretical reactive surface area
of nanowire assay and ELISA as enabling technology platforms 190
4.3.4 Summary 190
4.3.5 Concluding key-points 191
4.4 References 192
5.1 Conclusion 193
5.1.1 Building the nanoprobe assay: Validating the
antibody-nanomaterial functionalisation approach 194
5.1.2. Testing the initial functionality of the nanoprobe assay 195
5.1.3 Developing new ways to observe nanomaterials in
flow cytometric systems 196
5.1.4 Highlighting the advantages of nanowires in future diagnostic assays 198
5.1.5 Safety considerations with developing nanomaterial assays 199
5.1.6 Concluding discussion 200
5.1.7 Concluding key-points 202
6.1 Appendix 204
Table of Figures
Figure 1.1. Schematic of development of nanowire assay for
detection of soluble cancer biomarkers.
Figure 1.2. Schematic representation of the classic ErbB protein family.
Figure 1.3 Incidence and mortality rates for breast cancer.
Figure 1.4 Soluble ErbB2 protein forms.
Figure 1.5 Principle of In-Situ Hybridisation.
Figure 1.6 Principle of IHC and sandwich ELISA.
Figure 1.7 Size comparison between conventional
immunoglobulin and immune-functionalised quantum dot.
Figure 1.8 Absorption and emission spectra of QDs.
Figure 1.9 Schematic of Streptavidin-coupled QD for detection
of proteins through binding to biotinylated secondary antibody.
Figure 1.10 Principle of X-Ray Computed Tomography.
Figure 1.11 Principle of Magnetic Resonance Imaging.
Figure 2.1 Assembly of the stack for semi-dry transfer of proteins.
Figure 2.2 Nanomaterial silanisation and antibody conjugation process.
Figure 2.3 FACS analysis strategy for nanomaterial-based assays.
Figure 2.4 Setup of integrated microfluidics and optical
platforms for the analysis of fluorescently-tagged nanoparticles.
Figure 2.5 Example benchtop setup of microfluidics
and optical platform for nanoparticle analysis.
Figure 3.1 Theoretical surface-to-volume ratios for isotropic,
spherical and anisotropic, cylindrical shape nanomaterials.
Figure 3.2 Nanomaterial silanisation and antibody conjugation process.
Figure 3.3 General flow cytometry setup.
Figure 3.4 Schematic of development of nanoprobes for detection
of soluble cancer biomarkers.
5
8
10
10
16
20
24
29
30
40
42
59
64
69
72
73
81
86
91
Figure 3.5 Breast cancer cell lines 93
Figure 3.6 Lung cancer derived cell lines. 93
Figure 3.7 Western blot assessment of ErbB2 status in six
breast and lung cancer cell lines. 94
Figure 3.8 Quantification of total ErbB2 per unit total
protein in breast and lung cancer cell lysates. 95
Figure 3.9 Immunostaining of breast cancer cell lines
using fluorescent anti-CD340-AlexaFluor488. 96
Figure 3.10 Immunostaining of lung cancer cell lines. 97
Figure 3.11 HIM image of silica nanowires. 98
Figure 3.12 TEM of silica nanowires. 99
Figure 3.13 SEM of CoNi nanowires. 100
Figure 3.14 Size distribution determination of Ag nanowires by SEM. 102
Figure 3.15 Sizing distribution determination of polystyrene spheres by SEM. 104
Figure 3.16 SEM of silica nanospheres. 104
Figure 3.17 Flow cytometric analysis of nanowires. 105
Figure 3.18 Size and stock concentration of silica
nanospheres as determined by NS500. 106
Figure 3.19 Batch average results for stock measurements
of silica nanospheres using NanoSight NS500. 106
Figure 3.20 The effect of temperature on EDC-driven antibody coupling reaction. 107
Figure 3.21 Assessment of nanowire functionalisation by fluorescent microscopy. 109
Figure 3.22 Assessment of nanowire functionalisation by atomic force microscopy. Ill
Figure 3.23 Assessment of nanowire functionalisation by Helium-ion microscopy. 112
Figure 3.24 Assessment of nanowire functionalisation by flow cytometric analysis. 114
Figure 3.25 Assessment of functionalised nanowire stability using flow cytometry. 116
Figure 3.26 Fluorescent microscopic analysis of nanospheres. 118
Figure 3.27 Size analysis of nanospheres using NTA on the Nanosight NS500. 119
Figure 3.28 Flow cytometric analysis of nanospheres. 121
Figure 3.29 Spectroscopic analysis of nanosphere functionalisation. 122
Figure 3.30 Gel electrophoresis of silica nanospheres. 123
Figure 3.31 Detection of sErbB2 in a single analyte
system using confocal microscopy and flow cytometry. 124
Figure 3.32 Detection of ErbB2 concentration range in single analyte model. 126
Figure 3.33 Detection of spiked sErbB2 in reconstituted
plasma using the nanosphere and nanowire assay platforms. 128
Figure 3.34 Comparison of fluorophores on glass via fluorescence-based analysis. 129
Figure 3.35 Comparison of fluoropbores via fluorescence
based microscopy and flow cytometric analysis. 130
Figure 3.36 Flow cytometric comparison of microspberes
and nanowires using forward-scatter (FSC] and side-scatter (SSC] parameters. 132
Figure 3.37 Comparison of SSC-W response between microspheres and nanowires. 133
Figure 3.38. Schematic of light pulse. 134
Figure 3.39 Gating strategy for analysis of length-dependent
optical response in nanowire populations. 135
Figure 3.40 Analysis of AgNW length associated
responses using SSC-W gating strategy. 136
Figure 3.41 Flow cjAometric analysis of spheres and wires. 138
Figure 3.42 Analysis of particle size ladders using custom
built and conventional devices. 139
Figure 3.43 Detection of standardised fluorescent
microspberes using the RDS-CLX optical fluorescent detection system. 140
Figure 3.44. Detection of fluorescent nanowires using the
RDS-CLX optical fluorescent detection system. 141
Figure 4.1 Biomarkers in human body fluids. 165
Figure 4.2 Number of similar proteins detectable in different body fluid types. 166
Figure 4.3 Body fluid compartments. 167
Figure 4.4 Workflow of PPP analysis method used
to generate highly non-redundant protein sequences for PeptideAtlas. 169
Figure 4.5 Detection of spiked sErbB2 in reconstituted plasma
using the developed nanowire asay. 173
Figure 4.6 Detection of spiked EGFR in complex
reconstituted plasma using the nanowire assay. 174
Figure 4.7 Detection of spiked PSA in single analyte sample
using the developed nanowire system. 176
Figure 4.8 ELISA quantification of PSA in cancer cell line lysate. 177
Figure 4.9 Detection of native PSA in prostate cancer cell
lysates using the developed nanowire system. 178
Figure 4.10 Comparison of native sErbB2 concentration in clinical
samples as measured by anti-ErbB2 nanowire assay and conventional ELISA. 180
Figure 4.11 Comparison of native EGFR concentration in clinical
samples as measured by the anti-EGFR nanowire assay and conventional ELISA. 181
Figure 4.12 Comparison of native PSA concentration in clinical
samples as measured by the anti-PSA nanowire assay and conventional ELISA. 182
Figure 4.13. Comparison of nanowire assays vs ELISA for detection
of ErbB2, EGFR and PSA in biological media. 183
Table of Tables
Table 1.1 Breast cancer molecular subtypes.
Table 1.2 FDA-approved companion diagnostic kits for Her2/ErbB2. Table 1.3 Diagnostic assays for ErbB2 gene and mRNA.
Table 1.4 Tissue diagnostic assays for tbe detection and quantification of human ErbB2 protein.
Table 1.5 ELlSAs for the detection and quantification of human ErbB2 in biological liquid fractions.
Table 1.6 Nanoparticle applications in in vitro detection and imaging of ErbB2 in tissue.
Table 1.7 Main physical properties of Gold and Silver Nanoparticles. Table 1.8 Nanoparticle applications in in vivo detection
and imaging of ErbB2 in tissue. Table 2.1 Materials
Table 2.2 Cancer-derived cell lines for use in in vitro antibody testing. Table 2.3 Preparation of Stacking and Resolving acrylamide
gels for protein separation Table 2.4 lOX Running Buffer Table 2.5 Transfer Buffer Table 2.6 IXTBST
Table 2.7 Antibody and Molecular Size Ladder component list for western blotting protocol
Table 2.8 Staining information and microscope settings for analysis of fluorescent staining of cancer cell lines Table 2.9 Sample data calculation of nanowire concentration using flow cytometric approach.
Table 2.10 Agarose gel 0.2%
Table 2.12 Cancer-derived cell lines for use in in vitro nanowire assays. Table 2.13. Synopsis of techniques used to examine nanomaterials Table 3.1 Categorisation of nanomaterials.
Table 3.2 Mean and mode diameter of nanospheres as determined by NTA. Table 3.3 Assay procedure for detection of an sErbB2
concentration range using anti-ErbB2 nanoprobe.
Table 3.4 Assay procedure for detection of spiked sErbB2 using anti-ErbB2 nanowires and nanospheres.
Table 3.5 Percentage population occurring in each gate (P1-P22 of P1-P25 shown) for samples A-D.
Table 4.1. Biological samples used to test the nanowire system. Table 4.2 Calculation of the theoretical reactive surface area of an ELISA and nanowire assay.
179
185
Abbreviations
Ag Silver
AP Alkaline phosphatase
APTES [3-Aminopropyl) triethoxysilane
Au Gold
CISH Chromogenic in situ hybridisation
CNT Carbon nanotube
CoNi Cobalt-Nickel
CTC Circulating tumour cell
DNA Deoxyribonucleic acid
EGER Epidermal growth factor receptor
ELISA Enzyme-linked immuno-sorbent assay
EPR Enhanced permeability and retention
ErbB2 Epidermal growth factor receptor 2
ER Estogen receptor
FACS Fluorescence activated cell sorting
FDA Food and Drug Administration
FISH Fluorescent in situ hybridisation
HIM Helium-ion Microscopy
HRP Horseradish peroxidase
IgG Immunoglobulin G
kHz Kilohertz
me
ImmunohistochemistryLSPR Localised surface plasmon resonance
pi
MicrolitremL Millilitre
mRNA Messenger ribonucleic acid
NIR Near-infrared
NM Nanomaterial
NMRI Nuclear magnetic resonance
NP Nanoparticle
NTA Nanosight Tracking Analysis
NW Nanowire
PEG Polyethylene glycol
PR Progesterone receptor
QD Quantum dot
RT-PCR Real-time polymerase chain reaction
SERS SHG SPION SQUID TEM TK TM UV XRCT
Surface enhanced Raman spectroscopy Single harmonic generation
Superparamagnetic iron-oxide nanoparticle Superconducting quantum interference device Transmission electron microscopy
Tyrosine kinase Transmembrane Ultra violet
X-ray computed tomography
i; ■■■)', ' I'
'a':- i' f w Cir
■:t^
’j , vT . '^'rl ,>
V' • r-TW ■ -^ (r-< .,_
,-j.«-» iL-*.-^" ■• , '■••-•. .'■' ' ' ' ■■' •'?'■■'V.'. "' '
Chapter 1
Introduction and Literature Review
Detection of ErbB2: Nanotechnological solutions
1.1 Introduction
1.1.1 Healthcare challenges, nanomaterials and thesis focus
The cost of delivering healthcare continues to increase to phenomenal proportions. Thanks to decades of scientific, technological, medical and fiscal contributions, we have reached a point where we can detect, diagnose, track and treat a vast array of illnesses with considerable success. This triumph however, does not come cheap. In the European Union alone, the economic burden of providing healthcare to cancer sufferers has reached a staggering €51.0 billion (Bn) in 2009, with lung cancer, breast cancer, colorectal cancer and prostate cancer accounting for the majority of the economic burden associated with cancer care (Luengo- Fernandez et al. 2013).
We are moving into the era of personalised medicine, where access to a new generation of genomic, proteomic and metabolomic assays, each capable of generating huge amounts of data from biological samples (through the measurement of specific biomarkers), has improved the depth of obtainable information from each patient and has increased the clinician’s ability to make a well-informed medical decision. Treatments can now be selected and tailored depending on the specific biomarker profile of the patient. Companion diagnostics accompanying certain therapies are now also guiding patients and clinicians throughout the treatment course. Additionally, technological advances are helping to usher in personalised medicine. Computational capabilities have developed to such an extent that we can start to analyse and extract useful data from billions of scientific data points generated from biometric assays. Advances such as Deep Learning are allowing computers to begin to correlate data and identify clinically meaningful information that would simply be impossible for human clinicians to even begin to achieve. Medical device miniaturisation is ongoing and innovations in liquid handling, for example in flow cytometry and microfluidics, are driving a reduction in required biological sample volumes for assay purposes.
Although these advances will ultimately improve the quality of healthcare for the end user, they do add another layer of cost on top of the conventional healthcare budget. Another important facet influencing healthcare costs is the realisation that biomarker measurements are only really useful when viewed (a) over an extended time-course and (b) in the context of other biomarkers; meaning that the assay has to be carried out numerous times and several biomarkers need to be measured simultaneously (thus several mono-parametric assays must be used). At the moment, the prohibitive cost of a lot of assays prevents them from coming into widespread everyday use for the majority of the world’s population. For now, biometric assessment using these powerful medical tools is currently reserved for those individuals (or
governments) who can afford to pay for them and are often beyond the reach of those who need them.
So how do we grapple with the challenge of reducing healthcare costs related to biomarker assay use whilst making improvements to the significant advances in molecular diagnostics achieved to date? It is necessary to reduce the cost of assays whilst increasing the number of different biomarkers that can be measured at one time (i.e. multiplexing). Nanomaterials are seen as one potential avenue for investigation in an attempt to reduce assay costs and increase multiplexing capabilities, and one of the key enabling technologies in the development of the next generation of clinical diagnostic assays.
1.1.1.1 Nanomaterials
A nanomaterial can be defined as any material where at least one of its dimensions can be measured on the nanometre (nm) scale, and are usually referred to as such when the properties of the nanoscale features contribute to the functional properties of material. The definition of a nanomaterial adopted by the EU commission (2011) states the following;
"A natural, incidental or manufactured material containing particles, in an unbound state or as an aggregate or as an agglomerate and where, for 50 % or more of the particles in the number size distribution, one or more external dimensions is in the size range 1 nm -100 nm. In specific cases and where warranted by concerns for the environment, health, safety or competitiveness the number size distribution threshold of 50 % may be replaced by a threshold between 1 and 50 %."
The classification of nanoscale materials is based on tbe number of dimensions not on the nanoscale (<100nm). An in-depth overview of the categorisation of 0-, 1-, 2- and 3- dimensional nanomaterials (Illustrated in Table 3.1) is provided in (Ashby etal. 2009).
1.1.1.2 Thesis focus
1.1.1.3 Thesis workflow synopsis graphic
The following graphic (Figure 1.1) synopsizes the workflow involved in developing a nanowire platform for detection of soluble cancer biomarkers. The validation of the nanoprobe as a proof-of-concept device comprises three main steps, namely; nanomaterial characterisation, functionalisation with antibody and detection of a cancer biomarker.
Nanomaterial
Linker
♦ Quantitative characterisation • Qualitative
characterisation
Nanomaterial characterisation
Ab2
•
%
Analyte
• Linker selection
• Antibody selection
• Validation of functionalisation
Functionalisation with antibody
Quantitative validation of analyte capture (FACS)
Qualitative validation of analyte capture (FCM)
Specific detection of purified analyte
1.1.2 Cancer
Cancer can be broadly defined as uncontrolled cell division that results in abnormal cells that grow beyond their usual boundaries, and which may invade adjoining parts of the body and spread to other organs. The hallmarks of cancer include sustaining proliferative signalling, evading growth suppressors, resisting cell death, enabling replicative immortality, inducing angiogenesis, and activating invasion and metastasis (Hanahan & Weinberg 2011). Cancer is a leading cause of death worldwide, accounting for 8.2 million deaths in 2012, with lung, liver, stomach, colorectal and breast cancers being the most lethal. Lung cancer is the most common cancer worldwide (13% of all new cases diagnosed in 2012), followed by breast (11.9%), colorectal (9.7%) and prostate (7.9%) cancers (Stewart & Wild 2014).
Early detection and accurate diagnosis of cancers is seen as a major contributor to the prognostic outcome of cancer treatment. Over the past decade, huge emphasis has been placed on developing systems, procedures and policy to facilitate the development of cancer screening programs including breast, cervical, colorectal, prostate and lung screening programs (American Cancer Society 2015). Breast mammography is an example of a successful approach to cancer screening, with recent reports showing a 38% decline in breast cancer mortality among women who were screened with mammography (Paci 2012). However, mammography screening is costly and its cost-effectiveness is dependent on good health care infrastructure.
There are four major molecular subtypes in breast cancer which are classified based on the expression profiles of three receptors (Table 1.1) (Maryam et al. 2012, Wiechmann et al. 2009): luminal A (Estrogen Receptor (ER) and/or Progesterone Receptor (PR) positive, ErbB2 negative), luminal B (ER and/or PR positive, ErbB2 positive), basal-like (ER negative, PR negative, ErbB2 negative) and ErbB2 (ER negative, PR negative, ErbB2 positive).
Table 1.1 Breast cancer molecular subtypes. Breast cancer subtypes can be classified based on the expression patterns of estrogen receptor, progesterone receptor and ErbB2 receptor on the cancer cell.
Breast Cancer Molecular Subtype Estrogen receptor (ER)
Progesterone receptor (PR)
ErbB2 receptor Basal-like
— — —
Luminal A + -I- —
Luminal B + +
ErbB2
— — +
Clinical studies have shown that patients with ErbB2-overexpressing primary tumours have a significantly greater potential to propagate nodal involvement, and extensive lymphovascular invasion, resulting in poor prognosis compared to individuals with Luminal A or basal expression of ErbB2 (Wiechmann et al. 2009). The activity of ErbB2 (i.e. the degree of receptor dimerisation with other growth factor receptors) in tumour tissue contributes to the aggressive behaviour of ErbB2 cancer subtypes (Amin et al. 2010). Thus, accurate assessment of ErbB2 in tumour cells holds significant diagnostic importance and may have therapeutic consequences.
1.1.3 Principle of ErbB2 function
metastasis-associated properties (such as invasion and angiogenesis) and induces therapeutic resistance via receptor-mediated anti-apoptotic signals (Yu & Hung 2000).
Receptor dimerisation with ErbBl, ErbB2, ErbB3
Figure 1.2. Schematic representation of the ErbB family, consisting of ErbBl - ErbB4. The full length ErbB2 protein consists of 1255 amino acids comprising an extracellular domain (l-IV), transmembrane spanning region (TM) and an intracellular domain which holds tyrosine kinase (TK) activity. ErbB2 receptor dimerisation occurs through binding in the domain II. Receptor dimerisation results in initiation of downstream signalling events, facilitating processes such as cell proliferation, anti-apoptotic effects and angiogenesis. Figure adapted from Baselga & Swain (2009).
1.1.4 Clinical importance of ErbB2 detection: Focus on breast cancer
Table 1.2 FDA-approved companion diagnostic kits for Her2/ErbB2.£source: FDA.govJ
Treatment Assay Name Company
Trastuzumab
Pathvysion Her-2 DNA Probe FISH kit Abbott Molecular Inc.
Insite Her-2 kit Biogenex Laboratories, Inc.
Herceptest Dako Denmark A/S
HER2 FISH PharmDx Kit Dako Denmark A/S
Her2 CISH PharmDx Kit Dako Denmark A/S
Bond Oracle Her2 IHC system Leica Biosystems Spot-Light Her2 CISH kit Life technologies, Inc. Inform Her-2 FISH assay Ventana Medical Systems Pathway anti-Her2 (4B5] Ventana Medical Systems Inform Her-2 Dual ISH DNA assay Ventana Medical Systems
Most of the focus around ErbB2 oncogenic function has been centred on its role in breast cancer. This is probably because breast cancer is by far the most commonly occurring form of cancer in women, accounting for 23% of total cancer incidences and contributing to nearly 14% of the cancer-related mortality (Cancer Genome Atlas 2012]. The incidences of breast cancers are much higher in more developed regions (e.g. Western Europe] compared to less developed regions (e.g. Eastern Africa], whereas the mortality rate associated with breast cancer progression is similar between different world regions (Figure 1.2].
Figure 1.3 Incidence (black bars) and mortality (white bars) rates (age-standardised per 100,000 population) for breast cancer. Graph constructed from data retrieved from Globocan 2008 (globocan.iarc.fr).
1.1.5 Soluble ErbB2: Clinical importance in cancer diagnosis
Soluble ErbB2 protein exists in several forms due to a combination of alternate splicing and proteolytic processing (Figure 1.4). Alternate splicing results in the 100 kDa extracellular domain ErbB2 (comprising the first 633 amino acids of the full length protein), and the 68 kDa truncated Herstatin protein, which consist of the first 340 amino acids of the full length protein. Proteolytic processing of the full length protein also yields a 105/110 kDa soluble ErbB2 protein (Sasso etal. 2011).
(A)
N -H
(B)
N H
(C)
N -■
(D)
N
---1- c
c
c
-- c
kDa
185
105/110
100
68
Figure 1.4 Soluble ErbB2 protein forms. Soluble ErbB2 protein exists in several forms due to a combination of alternate splicing and proteolytic processing. Full length ErbB2 protein (A) can be proteolytically processed to yield a 105 - 110 kDa protein (B). Alternative splicing of the ErbB2 gene can produce a 100 kDa (C) or a 68 kDa (D) soluble protein.
The soluble form of ErbB2 (sErbB2) has been shown to be released from breast cancer cells (Liu et al. 2006), and is recognised as a promising biomarker in profiling the progression of cancer, in particular, metastatic breast cancer where it is elevated in 30-70% of cases and associated with progressive metastatic disease and poor response to chemotherapy (Carney et al. 2003). Several studies have shown correlation between the presence of ErbB2- overexpressing tumours and elevated levels of sErbB2 in patient blood fractions (Fornier et al. 2005, Kong et al. 2012, Ludovini et al. 2008) and an sErbB2 protein level > 15 ng/ml or a change of 20% in levels between two successive blood draws is significant to indicate further clinical investigation into ErbB2 positive cancer (Carney et al. 2013). Measurement of sErbB2 may provide a more informative diagnostic tool, both in terms of overall ErbB2 load and monitoring tumour response to therapy. ErbB2 is not a unique hallmark of a cancerous cell phenotype, and basal expression of ErbB2 is sometimes a feature of normal tissues (Negro et al. 2006). For this reason, it is unlikely that sErbB2 can be used as a sole and specific diagnostic marker of the presence of cancer in patients. However, an in-depth review of 22
studies has concluded that in the majority (85%] of individuals surveyed, sErbBZ levels correlated with disease recurrence, metastasis or shortened survival time (Ross et al. 2003). Taking this factor into consideration, the value of sErbBZ as a biomarker lies in assessing the metastatic state of ErbB2 cancers and seems to allow tracking of the response to anti-cancer treatments.
For example, decreased extracellular domain ErbB2 protein during Trastuzumab treatment has been suggested as a good predictive biomarker in terms of the positive response to cancer treatment, both in terms of time to disease progression and overall survival (Ali et al. 2008). However, a more in depth understanding of the mechanisms of synthesis and release of sErbB2 from ErbB2-positive tumours will further clarify the utility of sErbB2 in tracking response to cancer therapies (Lennon et al. 2009).
A test for sErbB2 is important since assessing sErbB2 in blood has the potential to give a global assessment of cancer burden within the body (rather than relying on a single biopsy sight), and furthermore it can serve as the first early indication of the presence of ErbB2- positive primary cancers, and in particular, more advanced metastatic cancer. Additionally, testing sErbB2 in blood is relatively non-invasive (as opposed to biopsy) as such this facilitates regular monitoring of sErbB2 levels in the body to treatment response. The main limitation with the current sErbB2 tests is that they are monoparametric, in that they are capable of measuring a single protein at a time (i.e., sErbB2). Since the real value of biomarker analysis in personalised medicine lies in the context of measuring multiple markers at one time, thus allowing comparative analysis within one individual over time, the current kits fall short on being able to do this.
Other members of the ErbB family of proteins also have soluble forms. ErbBl (also known as EGFR) has a soluble form protein which is found circulating in blood and recent studies suggest that sEGFR may predict responsiveness to EGFR-targeted therapies (Wilken et al. 2013). However, for the moment, sErbB2 is the more clinically validated than other members of the ErbB family.
1.1.6 Nanotechnological answers to current diagnostic limitations
Current in vitro and in vivo clinical diagnostic practises have a number of inherent limitations which hamper development towards improved cancer treatment strategies.
At an in vitro diagnostic level, there is a routine reliance on a subjective, non-quantitative tumour grading system, namely immunohistochemistry (IHC), where parameters such as fixation may limit specificity of antigen detection (Penault-Llorca et al. 1994], resulting in both false-positive and false-negative results. These may have a direct impact on the diagnostic observation and patient treatment. Furthermore, biopsy studies suggest that there is discordant ErbB2 expression between primary and metastatic sites within the same patient (Lanitis et al. 2012), and highlights the shortfall in accurate cancer diagnosis through reliance on assessment of the primary lesion alone.
In terms of blood fraction analysis, sErbB2 correlates well with disease behaviour and shows potential to measure susceptibility to cancer recurrence and response to treatment (Ross et al. 2003). However, assessment of sErbB2 levels alone may not be sufficient to accurately predict cancer status. Due to the heterogeneous nature of cancer progression, it is recognised that the future of effective cancer profiling lies in the simultaneous grading of multiple tumour markers(Hirsch et al. 2009). Additionally, the importance of assessing circulating tumour cells (CTCs) as a prognostic indicator of progression free survival and response to targeted therapy has been highlighted by recent evidence (Liu et al. 2013). A number of commercially available kits are available for assessing ErbB2 in CTCs. However, the level of inter-kit agreement merits further investigation (Fehm et al. 2010).
In addition to ErbB2 quantification, there is a necessity for new techniques which measure the activity (e.g. degree of receptor dimerisation) of ErbB2 and other markers such as EGFR in tumour cells. This information can be gained by using techniques such as Forster resonance energy transfer (FRET) (Waterhouse et al. 2011) and may inform the clinician on the efficiency of targeted treatments by assessing the receptor activity (Gaborit et al. 2011).
In vivo imaging techniques have been used for many years to visualise tumour tissue. However due to the non-specific distribution of contrast agent such as in X-ray computed tomography (XRCT), and short renal clearance times, the patient is often exposed to high contrast agent dose during the imaging procedure. Passive in vivo contrast agents (e.g. Indocyanine Green) naturally accumulate in vasculature and tumour tissue due to the enhanced permeability and retention (EPR) effect (Napp et al. 2011). The EPR effect has been exploited in order to visualise tumours in vivo. However, EPR alone cannot provide the
information regarding the molecular profile of the tumour tissue. Therefore, there is a demand for cancer-targeted in vivo imaging strategies which could reduce the overall burden on the patient whilst increasing cancer detectability and informing tbe clinician on the molecular phenotype of the tumour.
Although current established molecular profiling techniques have gone a long way to advancing the standard of medical treatment, there is a need to move towards more quantitative, objective cancer diagnostic systems in tissue biopsy and blood fractions analysis. In short, there is a need to improve the reliability and accuracy of disease diagnosis and to guide tbe selection of effective treatment for patients.
Over the past decade, nanotechnology-based diagnostic approaches have emerged as promising candidates for the improvement of clinical diagnostic techniques. The development of a number of families of nanoparticles (NPs), development of chemical linkers and antibody engineering have the potential to greatly enhance ErbB2 assessment to the point of single molecule detection. In addition, the development of nanowire (NW) structures for multiplexed "lab-on-a-wire" bio-analytical devices (Patolsky et al. 2006, Zhang & Ning 2012) has shown advantages in high throughput assays when compared to conventional and NP-based probe systems (Prina-Mello et al. 2010) leading to the possibility of improved analyte detection sensitivity in biological assays.
The use of nanomaterials (NMs) (i.e. NPs and NWs) as biomarker sensors could overcome such shortfalls and limitations. In particular, NM-assays have two major advantages over conventional assays (Bhaskar et al. 2010): (1) they enable higher imaging sensitivity, (2) they can merge multiple modalities on one probe (for example, NMs that can efficiently target cancer cells allow combining biomarkers detection with in vivo cancer imaging) [Kumar 2007, Kumar 2006).
To date, a number of nanotechnological approaches have been translated to and approved for medical applications, and most of these are liposome-based and protein-polymer-based drug treatments (Etheridge et al. 2013, Schiitz et al. 2013). In spite of the success in translating nanotechnology-based treatments to the marketplace (recent examples include Marquibo® & Bepanthen®), there has been comparatively little translation of nano-research to everyday clinical diagnostic practise and this stimulates the quest for further nanotechnological breakthroughs. Given the clinical importance of ErbB2, this literature review focuses on the NM-based technologies which aim to improve ErbB2 detection and quantification for diagnostic purposes.
The sErbB2 protein is used as a prototype model for the development of the nanowire platform, for a number of reasons. Firstly, ErbB2 is well recognised as a cancer biomarker, and sErbB2 is seen as a promising biomarker which could allow the non-invasive detection of ErbB2-positive cancers and may allow the ability to track disease response to therapy. Secondly, there are several EU-certified commercially available sErbB2 kits (although none of them are nanotechnology-based), which can be used as a comparative benchmark for the development of a nanowire-based assay. In essence, sErbB2 is being used as a test bed for the development of the nanowire platform. Once the principles of the nanowire assay have been established, the methodologies and experience could be applied to adapt the nanowire platform to the detection of other biomarkers (for example, EGER and PSA as is demonstrated in Chapter 4).
1.2 Clinical methodologies for the detection and quantification of
ErbB2
Clinically, the molecular presence of ErbB2 in tumour tissue is identified by in situ hybridisation (ISH], which characterises ErbB2 gene copy number, and IHC, which measures ErbB2 protein content. Enzyme-linked Immuno-Sorbent Assay (ELISA) is one of the most common methods to quantify sErbB2 levels in patient blood fractions [Carney et al. 2004).
1.2.1 Genetic detection and quantiflcation of ErbB2
All DNA assessment techniques measure the predisposition potential toward a given proteomic phenotype and thus can act as an early detection system for cancer. Polyploidy is a common feature of cancer cells (Storchova & Pellman 2004, Zhang et al. 2013), and so measurement of the gene copy number can indicate the presence of pathological cells. In clinical practise, genetic assessment of ErbB2 is generally used in conjunction with IHC results in order to confirm ErbB2 status in biopsy tissue.
In ISH, the nucleic acid probe is hybridised to its complementary nucleic acid strand in the tissue section. Hybridisation allows the visualisation and enumeration of specific gene loci [Fig 3) via a direct or indirect fluorescent [i.e. Fluorescent in situ hybridisation; FISH) or chromogenic [i.e. Chromogenic in situ hybridisation; CISH) tag. mRNA ISH [see section 1.2.1.3) allows examination of the ErbB2 mRNA transcripts within the tissue section. Genomic hybridisation arrays and real-time polymerase chain reaction- [RT-PCR) based assays can measure a vast amount of genetic loci or gene transcripts at one time
1.2.1.1 Fluorescent
in-situ
hybridisation (FISH)
Commercially available FISH assays for ErbB2 gene assessment (summarised in Table 1.2) employ direct labelling of the DNA with a complementary DNA probe (which is directly conjugated to a fluorophore, such as Spectrum Orange™ in the PathVysion™ kit and TexasRed® in the Dako IQFISH™ kit) (Fig. 3). FISH assays are usually restricted to formalin- fixed paraffin-embedded tissue sections and probe hybridisation is carried out for 8-10 hours. Even though they are considered one of the gold standard techniques for the clinical profiling of tumours, successful use of FISH kits for ErbB2 quantification relies heavily on expert execution of complex laboratory protocols. On this topic, Cayre et al. (2007) have published an extensive comparative report on the different experimental outcomes obtained from a variety of commercially available ErbB2 FISH kits tested on the same samples. They concluded that the tested are very well in accordance with one another. However, this agreement was reliant on the relative adjustment of signal threshold levels. The technique appears therefore to be susceptible to user error. Finally, the resolution (ability to distinguish between two points on a chromosome length) of in situ hybridisation assays can also be affected by the cell cycle phase (O'Connor 2008).
Directly Labelled ISH probe
Indirectly Labelled ISH probe
Chromosome
Figure 1.5 Principle of In-Situ Hybridisation. This figure represents the principles of ISH using either a directly- or indirectly- labelled method. In directly-labelled ISH, the DNA probe is directly conjugated to a fluorophore (yellow), as occurs in FISH. In indirectly-labelled ISH, the DNA probe is conjugated to a hapten (pink). During the denaturation step of the ISH protocol, the DNA probe hybridises to the gene of interest. Directly-labelled probes can then be visualised. Hapten-conjugated probes are detected either with a chromogen-linked antibody (red)(CISH), or with a fluorescently-labelled antibody.
1.2.1.2 Chromogenic in-situ hybridisation (CISH)
CISH allows the genetic assessment of tissue biopsies at lower magnifications compared to FISH. Thus, CISH can be used to measure gene ploidy within the greater context of the surrounding tissue. Although the resolution of CISH may not reach that of FISH, it is less costly and does not require specialised equipment, and so may be more suited to certain clinical situations.
CISH relies on an indirect labelling method, whereby the DNA probe is conjugated to a hapten (e.g. INFORM or Spot-light kits. Table 1.2] against which an antibody is raised. Such antibodies are tagged with a chromogenic marker rather than a fluorophore as occurs in FISH. Interestingly, products supplied by Dako Denmark A/S use identical DNA probes in their FISH and CISH kits, with the latter simply adding antibodies against the FISH fluorophores (TexasRed® and Fluorescein]. The chromogen is then converted to a visible product, usually by an enzymatic reaction (e.g. by addition of horseradish peroxidase [HRP] or alkaline phosphatase (AP]]. CISH brings with it a few advantages over FISH assays. Firstly, indirect labelling with anti-hapten antibodies permits optical detection of ErbB2 genes at lower magnifications. Secondly, CISH stained samples can be archived without incurring sample or staining degradation (Cayre et al. 2007]. This advantage might be counteracted by incorporating stable nanotechnology-based fluorophores into FISH techniques.
1.2.1.3 mRNA in-situ hybridisation (mRNA ISH)
mRNA ISH quantifies the ErbB2 gene expression levels. This technique has some unique advantages over FISH and CISH assays. Firstly, mRNA ISH detects ErbB2 gene transcripts and thus is more representative of the ErbB2 transcriptome levels in tumour cells. A recent study has shown, however, that there is a close correlation between mRNA ISH and FISH when determining ErbB2 levels in primary breast tumours (Alba et al. 2012]. Secondly, the reduced processing time (4 h] of samples by mRNA ISH makes this technique advantageous when compared to FISH and CISH approaches. Affimetrix’s QuantiGene ViewRNA kit (Table 1.2]can detect up to four different RNA transcripts at a time. In this instance, branched DNA amplification technology (Tsongalis 2006] attached to the mRNA probe is used to amplify the captured target RNA (rather than relying on an in vitro reverse transcriptase amplification of mRNA] (Horn et al. 1997], and visualisation of the amplified RNA is tailored for brightfield, fluorescent or luminescent detection. As an alternative to mRNA ISH, Adnagen (Germany] (Table 1.2] have developed a RT-PCR-based diagnostic which measures ErbB2 mRNA content as one of a panel of mRNA markers in CTCs. This is achieved through immunomagnetic concentration of CTCs from a blood sample followed by mRNA analysis. The technique assesses ErbB2 positivity through measurement of the final concentration of amplified cDNA.
1.2.1.4 Genomic hybridisation arrays
Hybridisation arrays consist of immobilised DNA probes on a solid matrix microarray, which can be used to measure gene copy number variations (the signal intensity correlates with hybridisation intensity] and to compare gene expression profiles among normal and tumourigenic DNA profiles (Cavallaro et al. 2012], In contrast with the FISH approach, DNA (or cDNA generated from mRNA) for hybridisation arrays can be isolated from both fresh biopsy tissue and formaldehyde-fixed paraffin-embedded tissue.
Several microarrays are commercially available for assessing ErbB2 gene status. The FDA- approved MammaPrint (Agendia, Amsterdam] microarray assesses 70 genes (one of which is ErbB2 gene] associated with the development of distant metastases 5 years after surgery (Slodkowska & Ross 2009]. The Oncotype DX (Genomic Health, Inc., CA] microarray also measures ErbB2 levels as one of sixteen tumour markers in comparison to five reference genes (Cronin et al. 2007]. One of the main advantages of microarrays is that they allow the simultaneous analysis of a number of genes which may better reflect the heterogenic nature of tumour development.
1.2.1.5 Appraisal of ErbB2 gene detection techniques.
Table 1.2 details clinical diagnostic assays for the detection and quantification of tissue ErbB2 at a genetic and post-transcriptional level. From a technical standpoint, in ISH the efficiency of probe hybridisation into native DNA is skewed towards detection in cells in interphase of the cell cycle (O'Connor 2008] and often considerable specialised equipment is required for some of the genetic assessment platforms. Microarray-based assays allow simultaneous quantification of numerous genes. However, the technique may also be more sensitive to contaminating DNA. ErbB2 mRNA quantification techniques (such as that developed by Adnagen] which rely on RT-PCR in order to generate a detectable signal are ultimately limited by the quality and preparation of the sample mRNA.
One of the major limitations of the genetic detection/quantification methods for ErbB2 lies in the design of the DNA probe used. There is some preliminary evidence reporting the inaccuracy of ErbB2 FISH kits as determined by comparative gene hybridisation array analysis (McArthur et al. 2009]. Despite the fact that the ErbB2 gene comprises a 40kb genomic region, most of the commercial ErbB2 probes currently commercialised for FISH/CISH assays consist of 190-218kb length DNA probes (Vysis PathVysion: 190kb, Ventana INFORM: 200kb and Dako IQFISH: 218kb, see Table 1.2] which may increase the chance of non-specific binding events (Allison 2010]. As one solution, Invitrogen has recently
developed a proprietary ‘subtractive hybridisation’ technology (included in the SPOT-Light CISH kit), which removes repetitive sequences from its probes and generates higher specificity for the targeted ErbB2 gene. The incorporation of brighter fluorescent probes (based, for example, on quantum dot technology, as discussed in section 3) might further allow improved gene resolution and gene quantification assays.
T^ble 1.3 Diagnostic assays for ErbB2 gene and mRNA. The table details those commercially available assays used for clinical profiling of ErbB2 at a gene and mRNA level. The table was compiled based on on-site assay use and from a web search for ErbB2 diagnostic assays.
£rhB2 form dftected Detection method^ Manufacturer tCountrv] Assay Commercial Name Declared Sensitivity Clinical sample* Gent/mENA ^,irrdine for FISH Abbott Molecular, Inc. (USA] PathVysion™ HER2
DNA Probe Kit Ratio to reference
Edii^ Dako Denmark
A/S (Denmark) HER21QF1SH pharmDx™ gene included in kit OSH Ventana Medical Systems, Inc. (USA)
INFORM™ HER2 Not stated
FFPE Invitrogen Corporation Ltd (USA) SPOT-Light® HER2 CISH Kit Single gene copy Dako Denmark A/S (Denmark) HER2 CISH pharmDx™ Ratio to reference gene included in kit RNA ISH Affimetrix, Inc.
(USA) QuantiGene® ViewRNA Single RNA molecule detection Microarrav Genomic Health, Inc.
(USA) Oncotype DX™
Ratio to 5 reference genes included in kit Agendia (Netherlands) MammaPrint® 50% tumour cell content Fresh tissue ~fllJJA from
ciiUalins
tumour cells Immunomagnetic separation and RT-PCR Adnagen, Gmbh. (Germany) AdnaTest BreastCancerSelect/ BreastCancerSelect 30ng/pl amplified cDNA SI)H: Fluorescent in-situ hybridisation; CISH: Chromogenic in-situ hybridisation; RNA ISH: hyidisation; RT-PCR: Real Time - Polymerase Chain Reaction.
* pE: Formalin-fixed paraffin-embedded; S: Serum.
RNA in-situ
It is interesting to note the lack of standardised approach to assessment of ErbB2 DNA/R\jy\ between the different kits, in terms of declared sensitivity (see Declared Sensitivity columr in Table 1.2) of each assay.
1.2.2 Detection and Quantification of ErbB2 protein
The following sections address two of the conventional diagnostic approaches to quintify ErbB2 protein in tumour tissues and patient fluids. IHC represents the most commonly used clinical diagnostic method for semi-quantitative assessment of protein levels within the morphological context of tumour tissue biopsies (Table 1.3). IHC is a well-establishec aid validated technique too, and no specialised equipment is needed. ELlSAs are the nijn method for measuring soluble ErbB2 in blood fractions (Table 1.4). Since numerous stides
correlate elevated blood sErbB2 levels with the presence of ErbB2-positive breast c.ncer tumours (Carney et al. 2004), sErbB2 ELISA is seen as a possible early detection systen ErbB2-positive cancers.
1.2.2.1 Immuno-histochemical detection of ErbB2 protein
IHC relies on using one specific antibody against the ErbB2 protein (Figure 14/^^ Amplification of the signal is achieved by using enzyme linked- (e.g., HRP, AP or AP-ant-A’) secondary antibodies guided against the detection antibody. The enzyme-linked antho^y converts a substrate to a visible colour. Although good sensitivity can be achieved usinjths detection method, IHC uses only one ErbB2-specific antibody and non-specific biidiig phenomena can occur.
B
Substrate
Enzyme
□
Secondary/ Detection Antibody / Antibody
Target
Primary Antibody
Figure 1.6 Principle of (A) IHC and (B) sandwich ELISA. (A) In IHC, detection of the angei (green) is accomplished hy an antigen-specific primary antibody (orange), followe b' detection and signal amplification via an enzyme (light blue) -linked secondary antibody ed
in the presence of a substrate. (B) In ELISA, both antibodies are directed against the antigen (green). The first antibody (grey) is immobilised on an assay well. Following capture of the antigen, the enzyme-linked detection antibody (purple), generates the chromogenic signal. Various IHC kits for ErbB2 measurement are available, such as that produced by Dako (Denmark] using Trastuzumab as the detection antibody. Whilst Trastuzumab targets the extracellular domain of ErbB2, Biogenex and Ventana Medical Systems have developed their own ErbB2 IHC kits with antibodies (mouse monoclonal antibody CBll and rabbit monoclonal antibody 4B5, respectively) guided against the intracellular portion of the ErbB2 protein. Trastuzumab has a simpler access route to ErbB2 (effective CBll and 4B5 staining relies on successful penetration of permiablised cells) and so is less likely to suffer from high background, non-specific staining. However, since there are sometimes a number of active, carboxy-terminal ErbB2 variants (which lack the extracellular domain) present in cells (Arribas et al. 2011), there is a chance that IHC assessment via Trastuzumab may underestimate the true amount of active ErbB2 in the cell. A threshold of >10% tissue staining is regarded as the minimum threshold for defining ErbB2 positivity by ErbB2 protein IHC kits (Table 1.3). Therefore, although IHC for ErbB2 is well established and widely used, the limited resolution of this technique makes it unsuitable for weakly expressed targets or for single-molecule detection. IHC gives the clinician a "reasonable” assessment of ErbB2 tissue load. However, there are a number of limitations related to this technique. IHC is semi- quantitative, subjective, not sensitive at low ErbB2 expression ranges (0 to 1+) and reliant on activity of staining reagents (e.g., peroxidase activity) (True & Gao 2007).
Table 1.4 Tissue diagnostic assays for the detection and quantification of human ErbBZ protein. The table details those commercially available assays used for clinical profiling of ErbBZ at a protein level. The table was compiled based on on-site assay use and from a web search for ErbBZ diagnostic assays.
Tissue ErbBZ form detected
Detection method^
Manufacturer fCountrvl
Assay Commercial
Name
Declared Sensitivity
Clinical sample tested*
ErbBZ protein IHC Biogenex
(USA)
InSite"“ HERZ/neuCBll
>10% Tissue
Staining FFPE
Dako Denmark
(Denmark) Hercep Test'" Ventana
Medical Systems, Inc.
(USA)
Pathway® anti HERZ/neu(4B5)
Proximity- Monogram HERmark® Not stated
based Biosciences Breast Cancer
(USA) Assay
t IHC: Immuno-histochemistry.
* FFPE: Formalin-fixed paraffin-embedded.
1.2.2.2 Enzyme-linked Immuno-Sorbent assays (ELISAs)
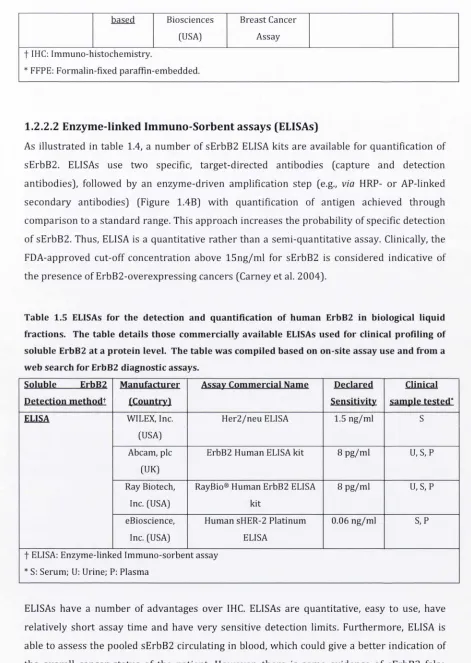
[image:48.536.38.509.52.715.2]As illustrated in table 1.4, a number of sErbB2 ELISA kits are available for quantification of sErbB2. ELISAs use two specific, target-directed antibodies (capture and detection antibodies), followed by an enzyme-driven amplification step [e.g., via HRP- or AP-linked secondary antibodies) (Figure 1.4B) with quantification of antigen achieved through comparison to a standard range. This approach increases the probability of specific detection of sErbB2. Thus, ELISA is a quantitative rather than a semi-quantitative assay. Clinically, the FDA-approved cut-off concentration above 15ng/ml for sErbB2 is considered indicative of the presence of ErbB2-overexpressing cancers (Carney et al. 2004).
Table 1.5 ELISAs for the detection and quantification of human ErbB2 in biological liquid fractions. The table details those commercially available ELISAs used for clinical profiling of soluble ErbBZ at a protein level. The table was compiled based on on-site assay use and from a web search for ErbBZ diagnostic assays.
Soluble ErbBZ Manufacturer Assav Commercial Name Declared Clinical
Detection methodt fCountrvI Sensitivity sample tested*
ELISA WILEX, Inc.
(USA)
HerZ/neu ELISA 1.5 ng/ml S
Abeam, pic (UK)
ErbBZ Human ELISA kit 8 pg/ml u, S, P
Ray Biotech, Inc. (USA)
RayBio® Human ErbBZ ELISA kit
8 pg/ml u, S, P
eBioscience, Inc. (USA)
Human sHER-Z Platinum ELISA
0.06 ng/ml S,p
t ELISA: Enzyme-linked Immuno-sorbent assay * S: Serum; U: Urine; P: Plasma
ELISAs have a number of advantages over IHC. ELISAs are quantitative, easy to use, have relatively short assay time and have very sensitive detection limits. Furthermore, ELISA is able to assess the pooled sErbB2 circulating in blood, which could give a better indication of
the overall cancer status of the patient. However, there is some evidence of sErbB2 false positive in patients without cancer, with elevated levels of sErbB2 being reported in cases of
liver cirrhosis (Molina et al. 1997). However, this does not negate the utility of assessing sErbB2 as a cancer detection strategy. The drawbacks associated with ELlSAs include high cost of the assay, usually only mono-parametric detection (Table 1.4) and the absence of histological context of protein quantification. ELISA is also unsuitable for quantification of CTCs.
1.3 Enhancing ErbB2 detection using nanotechnologv-based tools
Despite the