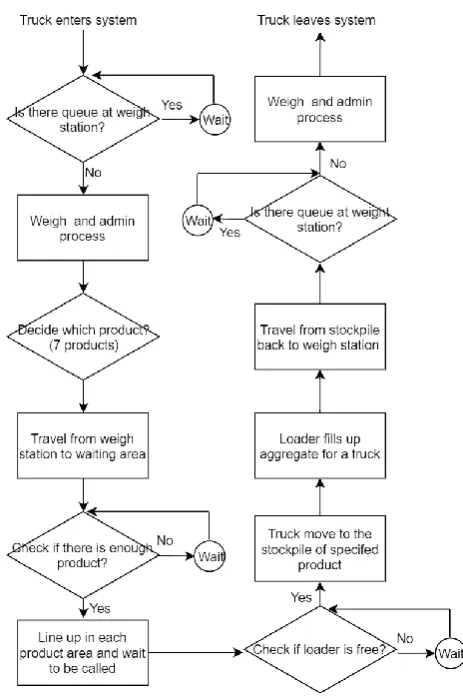
weight station to the time it leaves the system after weight station. Work day means a 9-hr operation in which there are six total work days per week. Production hours refers to the current quarrying production hours with a daily average runs time of 5.5 hours. Truck represents customers in the system. There are types of trucks: 6-wheeler (6T), 10-wheeler (10T), and double-axis-trailer truck (DT). This study uses Truck
[image:2.595.59.291.311.661.2]and Customer interchangeably. Products refers to final aggregate products that are ready to sell; currently there are seven types of products. Production rate refers to rate of production of each product which is modeled in discrete manner in this study and that the breakdown of each product cannot be adjusted accordingly. Loading time differs base on type of trucks and refers to the process that a loader serves aggregate to truck. Please noted that products cannot be mixed, and this system assumes a full truck load when a truck is served. Weight carry differs base on type of truck and type of products. Traveling time (of loader) refers to time loader takes to travel from one aggregate stockpile to another stockpile and is measured in second.
Fig 1: Flowchart of Outbound Logistics
In this paper, Shortest Processing Time (SPT), Shortest Traveling Time (STT), and Maximum Number in Queue (MaxQ) policy are presented to solve either truck queuing or loader scheduling policy. The paper is organized into the following sections: Section 2 describes the literature review on how simulation model can be used in quarry business especially using Arena simulation software, and a few
theories on queuing and scheduling policy. Section 3 describes solution methodology. Section 4 describes result of the experiment. Finally, section 5 describes conclusion and suggestion on future work.
II. LITERATURE REVIEW
The method of simulation provides a risk-free environment and saves money and time as compare to experimenting on a real asset; hence, many industries choose a simulation method as a mean to study any operational issue in order to improve the current system. Arena is one of a well-known software that is widely selected to simulate a real-world problem into a simulation model to help test, analyze, and improve the system.
Arena is a discrete event simulation software bases on SIMAN language that involves the use of flowchart and data modules. Flowchart modules define the processes to be simulated while data modules describe the characteristics of various process elements i.e. variables, resources, and queues. In the process of simulation, entities are created and as they move through the model, they are acted on by the module. Arena also contains function such input and output analyzer that fit the model and historical data to statistical distributions [4]. In additional to this, ARENA can help analyze bottleneck for long duration process in order to reduce waiting time and reduce flow time [5].
In the mining and quarry industry, the use of simulation model has been widely used and Arena is selected as a tool to simulate a real problem. However, most study focuses on mining production planning and efficiency improvement of open-pit extraction logistics (inbound logistics) whereas this study focus on the improvement of outbound logistics. Ataeepour and Baafi [6] showed that Arena could help prove that dispatching policy was more productive than non-dispatching policy since it could minimize the queue time of trucks in open-pit area when waiting to be served by shovels. Kang et.al [7] utilized Transporter flowchart model in Arena to study productivity of truck movement transporting rock. Their study also simulated truck’s speed reduction at the intersection as well as integrated a map representing the topography of the jobsite. Planning schedule, mining plan, and forecasting production to reduce variance of the actual production could also be addressed using Arena simulation [8]. In addition to this, although a quarry production is close to continuous behavior, it can be modeled using discrete tools with a very precise presentation of the continuous behavior by modeling the material flow as big portions that are treated as discrete entities on the modelling code [9].
This research focuses on testing and analyzing different policies for truck queuing policy and loader scheduling policy. Since policy requires time to implement and training, they cannot be changed regularly. Hence the policy needs to be tested and analyzed using simulation model in order to reduce time and investment.
completion of the service [10]. Queuing theory is the study of queue or waiting lines. It includes but not limited to topics such as expected waiting time in the queue, average time in the system, expected queue length, and expected number of customers served at one time [11]. The queuing theory can be applied with statistical knowledge on flow time, in order to improve duration time [12]. Shortest Processing Time is a well-known rule used in the field of job-shop scheduling and is known to be optimal if the objective is to minimize the average flowtime [13]. Hence, this paper leverages the idea of shortest processing time into a testing policy for truck queuing policy.
Moreover, the paper also aims to minimize the traveling time of loader transporting between different aggregate stockpiles by using two policies: shortest path problem and maximum queuing of truck. Shortest path problem is a study of network flow in order to optimize the route and widely used in many transportation problems [14]. The method relies on the logic of finding the shortest path or route from a starting point to a final destination [15]. The maximum queuing method, on the other hand, is based on the idea of identifying the longest product queue lines. Hence, this paper leverages the two ideas into two testing policies for loader scheduling policy.
III. METHODOLOGY
To simulate a current system using ARENA software, the following steps were carried out: (A) Survey and collect data on the current state on quarry production and outbound logistics process, (B) Develop the simulation model, (C) Verify and validate the simulation model, (D) Calculate number of replica, and (E) Analyze and test queuing methods.
A. Survey and collect data on the current state
At current state, there are seven aggregate products being served to three types of customers. Each product is assumed to be produced at a constant rate in unit of ton per minute. Loading time, moving time and weight-admin processing time were collected. Table I represents production rate of each product, demand of each type of product for each customer group, and weight carry distribution whereas Table II represents other distribution used in the model. In addition to this, customers arrival assumes to follow a weekly schedule pattern in hourly basis as can be seen in Fig. 2.
TABLE I
DATA USED IN THE BASE MODEL PART I
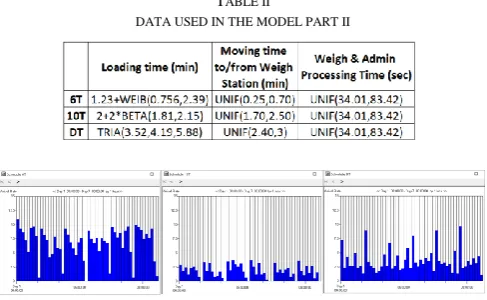
TABLE II
DATA USED IN THE MODEL PART II
Fig. 2: Arrival Schedule of 6T, 10T and DT Truck
B. Develop the simulation model
[image:3.595.305.549.55.205.2]There are four major parts that comprise the model using ARENA: (1) customer arrival, (2) production process, (3) weighing operation, and (4) loading operation, as can be seen in Fig. 3. In this study, when a new testing policy is implemented, there will be an adjustment or add-on modules in these major parts.
Fig 3. Simulation Configuration
(1) Customer arrival: Three types of trucks were created based on a weekly schedule pattern on hourly basis as can be seen in Fig. 3. Each truck knows which type of aggregate products it wants and how much it can carry. The probability of choosing a product and weight of each product that each truck can carried can be seen in Table I. Please noted that the weight carry depends on both type of truck and type of products based on the real collected data.
[image:3.595.306.559.331.438.2](3)Weighing operation: The process of weighing also includes the administration work; the time it takes to complete both weigh and administration process can be seen in Table II. There are two times when a truck enters a weigh operation. First is when an empty load truck arrives at the weigh station and later is when the truck is fully loaded and is about to leave the system. In addition to this, Table II also displays the time it takes for a truck to move from weigh station to the waiting area and the time the truck travels back from a stockpile area to the weigh station.
(4) Loading operation: The loading operation is when a loader fills up an aggregate for a truck. The time it takes to fill can be seen in Table II, which depends on the type of truck. In the current model, FIFO queue is used when loader calls for a customer truck to be served. In addition to this, this study also considered a traveling time the loader travels from one stockpile to another stockpile. Traveling time (in second) can be seen in Table III.
TABLE III
LOADER’S TRAVELING TIME BETWEEN STOCKPILE (SEC)
C. Verify and validate the simulation model
For the simplicity of verification purpose, the model was run under simpler characteristics i.e. fixed number of truck arrivals instead of using schedule, fixed production rate, fixed weight carries for each type of truck. Hence the study was able to verify production process, selling amount, as well as number of completed trucks.
Since the study is interested in a particular time period and because productions always exceed demands, the system never reach a steady state. Hence, the system is a terminating system. When running the system, both initial state i.e. initial volume of each product and run length are specified.
The study uses two-sample t-test with a significant level of 0.05 to validate the model against a real data. Using the following parameter: number of each type of trucks out in each week, total time spent for each type of truck, and amount sold in each week of each product, the study proved that all the selected parameter passes the statistical test since the p-value is greater than 0.05 for all parameters. Therefore, it can be concluded that with 95% confidence there is no significant difference occurred between the model and the real data sampling. Table IV and Table V show the p-value for the selected parameter.
TABLE IV
PARAMETERS USED FOR VALIDATION
TABLE V
PARAMETERS USED FOR VALIDATION (CONT’D)
D. Calculate number of replicas
This study uses Sequential Sampling method to attain a desired 95% confidence interval of chosen parameters. This method helps with variance reduction and allows the simulation to run until it reaches the specified confidence interval halfwidth before stops the run at “N” replication [16]. After running a simulation, the study found that a 101 replication results in 95% confidence interval.
E. Analyze and test policies
There are two main parts that a testing policy could be implemented into. First is the truck queueing part and second is loader scheduling part. In this study, four policies were implemented into the model. The first one focuses on improving truck queueing part; the next two focus on improving loader scheduling part; and the last one focuses on improving both truck queueing and loader scheduling part.
The following contains logic that is used to build each testing policy:
(1)Truck Queuing Policy:
-Shortest Processing Time (of Customer) Policy (SPT)
trucks waiting in queue, truck with higher priority will pass truck with lower priority. For the SPT policy to work, the priority attribute is created in addition to the base model. Noted that this policy does not affect loader scheduling; hence, loading still serves trucks based on FIFO.
(2)Loader Scheduling Policy:
-Shortest Traveling Time (of Loader) Policy (STT)
This policy applies the idea of shortest traveling time of loader. Since there is only one loader serving in the system choosing among seven products, STT policy will ask the loader to move to the product stockpile which locates next (closest) to the current one. In this policy, it is also assumed that the loader cannot return to the previous stockpile that it had served before the current stockpile. This can be concluded that the pattern that loader will move will be 1,2,3,4,5,6,7 then 7,6,5,4,3,2,1. In addition to this, since the goal is to minimize loader traveling time, a batch of “n” trucks is allowed. This means that if there happens to have multiple trucks who request the same product as to where loader is currently serving, loader will also serve those few more trucks depending on a designated batch size before move to the next stockpile. Noted that although batching trucks of the same product could help enhance loader scheduling policy since it would reduce traveling distance of loader, it is not necessary means that the higher batch would result in a better process performance [17].
(3)Loader Scheduling Policy:
-Maximum Number in Queue Policy (MaxQ)
This policy utilizes the idea of identifying the bottleneck in a process and gives priority of work on that bottleneck area first. The physical area constraint of the quarry limits the number of trucks that could be in the system at the same time. This implies that the higher queue in a particular product line results in the bottleneck of the system since it creates traffic and takes a lot of space. In MaxQ policy, loader will first serve the longest queue length of a product. To simply put, the system will analyze which product line has the longest queue at a current time and gives signal to loader to work on that product line. In addition to this, a batch of “n” truck is also be applied if within the current serving product line has multiple trucks waiting at the point in time. Once loader finishes serving a truck and checking if there is a need for batch serving, the system will re-evaluate the next longest product line.
(4) Combined Policy (SPT & SPP)
The combined policy help improving both truck queueing and loader scheduling part. This policy selected the best policy from truck queueing policy (SPT) and loader scheduling policy (STT) and combined them together.
IV. RESULTS
Using simulation model to analyze current system, the study found that in the current state, the system has an average total flow time of 39.22 min for all type of trucks. This high total flow time of truck was partially resulted from a long average waiting time for production of product 1 and product 4: 27.39 min waiting time for product 1 production and 63.41 min waiting time for product 4 production. This indicates that there is a bottleneck issue in the production part. However, since production rate of the current system cannot be adjusted accordingly, the study intends to use the simulation model to test truck queueing and loader scheduling policies in order to improve both the average flow time of a truck in the system and traveling time of loader. Hence, the selected performance measurement are both total flow time of truck and traveling time of loader.
For Truck Queueing Policy, only SPT Policy is tested against the current model. From Table VI, it can be seen that by applying SPT Policy to the current simulation model, it can decrease 5.5 minutes of the average total flow time spent of a truck from 39.22 minutes to 33.72 minutes and decrease 627 seconds of monthly travel time of loader.
On the other hand, for Loader Scheduling Policy, two testing methods, STT Policy and MaxQ Policy are tested against the current model. Since the batch serving trucks are allowed for loader scheduling policy, only the selected best batch setting is presented in the testing result in Table VI. After running a range of batch “n” from n = 1 to n =8 in each policy setting, the study found that batch n = 2 yields the best pair of total flow time and monthly traveling time for both STT Policy and MaxQ Policy. From Table VI, it can be concluded that for Loader Scheduling Policy, STT Policy
with batch n = 2 surpass MaxQ Policy with batch n = 2. STT Policy help reduces the total flow time by 4.07 minutes and reduces loader’s traveling time of one month by 3,108 seconds whereas MaxQ Policy help reduces by 2.0 minutes and 1,524 seconds per month, respectively.
After identifying the best method setting for both Truck Queueing Policy and Loader Scheduling Policy, a combination of both is further tested and compare against the current system. The selected combination which makes
TABLE VI
SIMULATION RESULTS FOR DIFFERENT METHODS IN EACH POLICY
V. CONCLUSION
The simulation model in this study focuses on outbound logistics in a quarry business. The system starts from the time that a truck enters at the weigh station until it leaves after a final weigh at the weigh station.
This paper has investigated methods that can help minimize average total flow time of a truck and loader’s monthly traveling time in order to improve outbound logistics system in a quarry business. In Truck Queueing Policy, the study recommends Shortest Processing Time (of Customer) Policy whereas in Loader Scheduling Policy, the study recommends Shortest Traveling Time (of Loader) Policy.
By combining the best policy from both Truck Queuing and Loader Scheduling Policy, the study also found that the
Combined Policy help reduce 27.05% of the total flow time from 39.22 min to 28.61 min and 7.56% of the loader’s monthly traveling time from 41,889 seconds to 38,721 seconds.
The proposed simulation model in queuing and scheduling policy can help improve the current system without a major equipment investment and an expansion in space area. Future work can be applied in other seasonal settings such as different trend of incoming customers, truck scheduling, and rate of production. In addition to this, the simulation model can be further investigated for a potential of appointment system if a quarry company owns its own fleet management.
REFERENCES
[1] Geology Department, University of Leicester. (2012, 12, 4). Introduction to Quarries. [online]. Available: http://www2.le.ac.uk/ departments/geology/redundant-content/research/geophysics-and- borehole-research-group/projects/ee-quarry/course-eeq-01-introduction-and-overview/section-2/2-1-introduction-to-quarries
[2] Bureau of the Budget. (2017, 11, 15). Thailand’s Budget in Brief Fiscal Year 2018. [online]. Available: http://bb.go.th/en/topic3.php? catID= 910&gid=860&mid=544
[3] N. Toomwongsa. (2016, 08). Thailand’s Construction Business. Kungsri Research. [online]. Available: https://www.krungsri.com /bank/getmedia/b7744b26-39bd-4212-bd16-e439e6638503/THQIR_ CONS_2016Q3_EN.aspx
[4] T. Aytemiz, “Simulation model of a packaging process,” Yönetim Bilimleri Dergisi Journal of Administration Sciences, 2:2. 2004.
[5] M. S. Eryilmaz, A. O. Kusakci, H. Gavranovic, and F. Findik, “Analysis of Shoe Manufacturing Factory by Simulation of Production Processes,” Southeast Europe Journal of Soft Computing Vol 1. no. 1, Mar. 2012.
[6] N. Ataeepour and E. Y. Baafi, “ARENA Simulation Model for Truck-Shovel Operation in Despatching and Non-Despatching Models,” International Journal of Surface Mining, Reclamation and Environment, 13(3), pp. 125-129. 1999.
[7] J. H. Kang, S. M. Ahn, and J. H. Nam, J.-H, “ Productivity assessment of rock transportation trucks using simulation technology,” in Proc. 23rd International Symposium on Automation and Robotics in Construction, Oct. 2006.
[8] F. A. Kaba, V. A. Temeng, and P. A. Eshun, “Application of Discrete Event Simulation in Mine Production Forecast,” Ghana Mining Journal, 16(1), pp. 40-48. 2016.
[9] M. M. Fioroni, M. M. , L. A. G. Franzese, C. E. Zanin, J. Furia, L. d. T. Perfetti, D. Leonardo, and N. L. d. Silva, “Simulation of continuous behavior using discrete tools: ore conveyor transport,” in Conf. Rec. 2007 Winter Simulation Conf.
[10] J. Dehantoro, D. Sumiardi, and O. Hijuzaman, “Analysis of Vehicle Service Queuing System Using Arena in Authorized Workshop,” International Journal of Science and Research(IJSR), vol. 5, issue 5, May. 2016.
[11] M. Dharmawirya and E. Adi, “Case Study for Restaurant Queuing Model,” International Conference on Management and Artificial Intelligence, vol. 6, 2011.
[12] F. Wang, C. Ye, Y. Zhang, and Y. Li, “Simulation Analysis and Improvement of the Vehicle Queuing System on Intersections Based on MATLAB,” The Open Cybernetics & Systemics Journal, vol. 8, pp 217-223, 2014.
[13] L. Bobelin, P. Martineau, and H. He, “Shortest Processing Time First and Hadoop,” IEEE 3rd International Conference on Cyber Security and Cloud Computing, 2016.
[14] S. Pallottino and M. G. Scutella, Shortest Path Algorithms in Transportation Models: Classical and Innovative Aspects. Boston, MA: Springer, 1998.
[15] K. Magzhan and H. M. Jani, “A Review And Evaluations Of Shortest Path Algorithms,” International Journal of Scientific & Technology Research, vol. 2, issue 6, Jun. 2013.
[16] A. Adewunmi and M. Byrne, “An Investment of the Sequential Sampling Method for Crossdocking Simulation Output Variance Reduction,” in Proc. Of the 2008 Operational Research Society 4th Simulation Workshop, Birmingham, 2008.