ORIGINAL RESEARCH
HEAD & NECK
Optimal Fat Suppression in Head and Neck MRI:
Comparison of Multipoint Dixon with 2 Different
Fat-Suppression Techniques, Spectral Presaturation and
Inversion Recovery, and STIR
XS. Gaddikeri,XM. Mossa-Basha,XJ.B. Andre,X D.S. Hippe, andXY. Anzai
ABSTRACT
BACKGROUND AND PURPOSE:Uniform complete fat suppression is essential for identification and characterization of most head and pathology. Our aim was to compare the multipoint Dixon turbo spin-echo fat-suppression technique with 2 different fat-suppression techniques, including a hybrid spectral presaturation with inversion recovery technique and an inversion recovery STIR technique, in head and neck fat-suppression MR imaging.
MATERIALS AND METHODS: Head and neck MR imaging datasets of 72 consecutive patients were retrospectively reviewed. All patients were divided into 2 groups based on the type of fat-suppression techniques used (groupA: STIR and spectral presaturation with inversion recovery gadolinium-T1WI; groupB: multipoint Dixon T2 TSE and multipoint Dixon gadolinium-T1WI TSE). Objective and subjective image quality and scan acquisition times were assessed and compared between multipoint Dixon T2 TSE versus STIR and multipoint Dixon gadolinium-T1WI TSE versus spectral presaturation with inversion recovery gadolinium-T1WI using the Mann-WhitneyUtest.
RESULTS:A total of 64 patients were enrolled in the study (group A,n⫽33 and group B,n⫽31). Signal intensity ratios were significantly higher for multipoint Dixon T2 and gadolinium-T1WI techniques compared with STIR (P⬍.001) and spectral presaturation with inversion recovery gadolinium-T1WI (P⬍.001), respectively. Two independent blinded readers revealed that multipoint Dixon T2 and gadolinium-T1WI techniques had significantly higher overall image quality (P⫽.022 andP⬍.001) and fat-suppression grades (P⬍.013 andP⬍.001 across 3 different regions) than STIR and spectral presaturation with inversion recovery gadolinium-T1WI, respectively. The scan acquisition time was relatively short for the multipoint Dixon technique (2 minutes versus 4 minutes 56 seconds for the T2-weighted sequence and 2 minutes versus 3 minutes for the gadolinium-T1WI sequence).
CONCLUSIONS: The multipoint Dixon technique offers better image quality and uniform fat suppression at a shorter scan time com-pared with STIR and spectral presaturation with inversion recovery gadolinium-T1WI techniques.
ABBREVIATIONS:AP⫽anteroposterior; CHESS⫽chemical shift selective suppression; FS⫽fat suppression; Gad-T1WI⫽gadolinium-T1WI; mDixon⫽multipoint Dixon; SPIR⫽spectral presaturation with inversion recovery
U
niform and complete fat suppression (FS) is indispensable for accurate diagnosis and characterization of head and neck pathologies. Various FS MR imaging techniques areavail-able clinically, each with its own advantages and disadvantages. Commonly used FS MR imaging techniques include STIR, chemical shift selective suppression (CHESS), hybrid methods such as spectral presaturation with inversion recovery (SPIR; Phillips Healthcare, Best, the Netherlands), spectral attenuated inversion re-covery, and a more recent chemical shift method, the multipoint Dixon (mDixon Technique; Phillips Healthcare).
The STIR technique nulls the fat signal using a 180° inversion pulse as an initial excitation pulse, followed by a subsequent 90° pulse at a specified inversion time (approximately 160 –180 ms for a 1.5T magnet). The CHESS technique uses a radiofrequency pulse tuned to the fat-resonance frequency together with a spoiler gradient, which saturates fat signal and thus leaves only water protons to produce signal. SPIR is a hybrid FS technique that combines the fat selectivity of CHESS and uses an inversion radiofrequency pulse like that in the STIR technique. Never-Received March 3, 2017; accepted after revision October 16.
From the Departments of Neuroradiology (S.G.) and Radiology (S.G.), Rush Univer-sity Medical Center, Chicago, Illinois; Departments of Neuroradiology (M.M.-B.) and Radiology (D.S.H.), University of Washington, Seattle, Washington; Department of Neuroradiology (J.B.A.), University of Washington Medical Center, Seattle, Washington; and Department of Radiology (Y.A.), University of Utah Health Cen-ter, Salt Lake City, Utah.
Paper previously presented at: Annual Meeting of the American Society of Neuro-radiology and the Foundation of the ASNR Symposium, April 22–27, 2017; Long Beach, California.
Please address correspondence Santhosh Gaddikeri, MD, Department of Radiol-ogy, Rush University Medical Center, 1653 W Congress Parkway, Chicago, IL 60612; e-mail: [email protected]
Indicates article with supplemental on-line table.
theless, SPIR differs from CHESS in that the radiofrequency pulse used is an inversion pulse and is different from STIR in that the inversion pulse used is selective for fat spin excitation only.1The more recently developed mDixon technique is in-sensitive to magnetic field (both B0 and B1) inhomogeneity while preserving the desired image contrast at reduced scan acquisition times.2
In this retrospective study, we compared 3-point mDixon T2 TSE and mDixon gadolinium-T1WI (Gad-T1WI) TSE tech-niques with the commonly used T2 (STIR) and post-Gad-T1WI (SPIR) FS techniques, respectively, for assessing subjective and objective image quality while considering image-acquisition times.
MATERIALS AND METHODS
The ethics committee of our institution (University of Wash-ington) approved this Health Insurance Portability and Ac-countability Act– compliant study. We retrospectively re-viewed the imaging records of 72 consecutive patients who had undergone head and neck MR imaging without and with gad-olinium administration for various clinical indications, be-tween July 1, 2014, and September 30, 2014. Another inclusion criterion was that these patients also have a CT examination of the neck within 3 months before or after the MR imaging study. The CT data were used to quantify body habitus. Pa-tients with poor renal function (glomerular filtration rate of ⬍30) and suboptimal image quality secondary to patient mo-tion artifacts were excluded from the study. None of the en-rolled patients had cervical spine fusion hardware. Systematic changes were made in the institutional head and neck MR im-aging protocol during the study time period so that the previ-ously obtained STIR/SPIR combination of FS techniques was gradually switched to the evaluated mDixon FS techniques. The enrolled subjects were divided into 2 groups (group A and group B) based on the combination of FS techniques used for the corresponding T2-weighted sequence and Gad-T1WI se-quence. In group A subjects, STIR images were acquired as a T2-weighted sequence and SPIR images were acquired as the post Gad-T1WI FS technique. In group B subjects, a 2D mDixon spin-echo (2D-3-point mDixon TSE) technique was
used to suppress fat signal in both T2-weighted and post-Gad-T1WI sequences.
Data Acquisition
All MR imaging scans were obtained on a 3T scanner (Achieva; Phil-lips Healthcare). As per our institution protocol, we obtained the following MR imaging sequences: axial, sagittal, and coronal T1WI; and axial and coronal fluid-sensitive sequences with fat suppression (axial STIR and coronal CHESS FS T2WI or axial and coronal mDixon FS T2WI), followed by gadolinium-enhanced (gadoteridol, ProHance, 279.3 mg/mL; Bracco Diagnostics, Princeton, New Jer-sey) axial and coronal T1WI with FS sequences (SPIR or mDixon). Parameters used for STIR, SPIR FS Gad-T1WI, mDixon FS T2WI, and mDixon FS Gad-T1WI are summarized inTable 1.
Data Analysis
Objective Analysis. All objective measurements were performed by a fellowship-trained neuroradiologist with 10 years of cumu-lative experience in head and neck imaging. As the surrogate mea-sure of a patient’s body size, the maximum anteroposterior (AP) neck diameter at the level of mandible (parallel to the C2–3 inter-vertebral disc), minimum AP diameter at the midneck level (par-allel to the C4 –5 intervertebral disc), and maximum transverse shoulder width (Fig 1) were measured on the neck CT topogram. The ratios of AP neck diameter at the level of the mandible to the AP diameter at the midneck level and shoulder width to AP diam-eter of the midneck were calculated for each subject and were compared between the 2 groups (groups A and B).
Signal intensity of the spinal cord and subcutaneous fat was measured (Fig 2) by placing a circular ROI measuring 5–10 mm in diameter on an axial image at 2 different levels (submandibular region and supraclavicular region) on all sequences. To normalize the relative fat signal intensity, we calculated the signal intensity ratio between the spinal cord and subcutaneous fat at both levels for each sequence. The ratios were compared between STIR and mDixon FS T2 TSE and between SPIR FS Gad-T1WI and mDixon FS Gad-T1WI TSE, respectively.
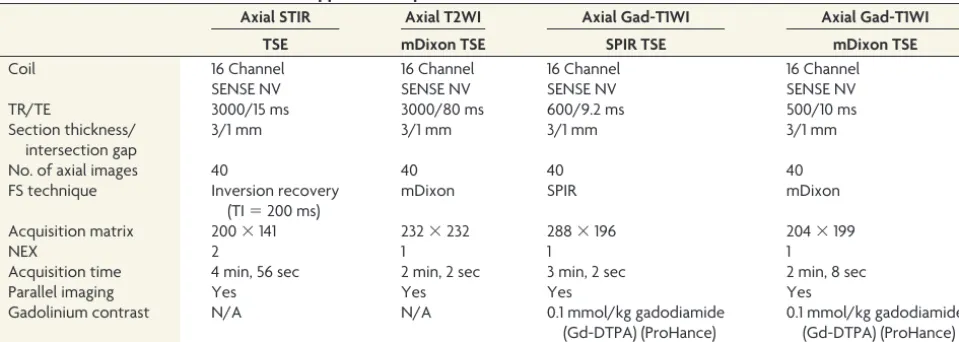
Subjective Analysis. Two fellowship-trained and board-certi-fied neuroradiologists, each with 12 years of experience in in-Table 1: Parameters used for different fat-suppression sequences on a 3T scannera
Axial STIR Axial T2WI Axial Gad-T1WI Axial Gad-T1WI
TSE mDixon TSE SPIR TSE mDixon TSE
Coil 16 Channel 16 Channel 16 Channel 16 Channel
SENSE NV SENSE NV SENSE NV SENSE NV
TR/TE 3000/15 ms 3000/80 ms 600/9.2 ms 500/10 ms
Section thickness/ intersection gap
3/1 mm 3/1 mm 3/1 mm 3/1 mm
No. of axial images 40 40 40 40
FS technique Inversion recovery (TI⫽200 ms)
mDixon SPIR mDixon
Acquisition matrix 200⫻141 232⫻232 288⫻196 204⫻199
NEX 2 1 1 1
Acquisition time 4 min, 56 sec 2 min, 2 sec 3 min, 2 sec 2 min, 8 sec
Parallel imaging Yes Yes Yes Yes
Gadolinium contrast N/A N/A 0.1 mmol/kg gadodiamide
(Gd-DTPA) (ProHance)
0.1 mmol/kg gadodiamide (Gd-DTPA) (ProHance) Note:—SENSE indicates sensitivity encoding; N/A, not applicable; NV, NeuroVascular.
a
[image:2.594.54.534.55.226.2]terpreting head and neck MR imaging, independently assessed the image quality. Readers were blinded to all FS techniques used. On a per-subject basis, the stack of axial images of each sequence (FS T2 sequence and FS Gad-T1WI sequence) was displayed and analyzed on a random basis on a PACS monitor. No preset window width or level was provided. The readers were free to vary both at their discretion. The 2 readers were asked to evaluate the following: 1) uniformity of fat suppres-sion with emphasis on 3 areas that are prone to incomplete fat suppression (the maxillary, submandibular, and supraclavic-ular regions, respectively), 2) overall image quality for each fat-suppression technique, and 3) the presence of susceptibil-ity artifacts from dental amalgam. Uniformsusceptibil-ity of fat suppres-sion and overall image quality assessment were graded on a 5-point Likert-like scale (1⫽poor, 2⫽suboptimal, 3⫽ ac-ceptable, 4⫽good, and 5⫽excellent).
Direct comparison of objective and subjective image-quality measurements between groups A and B (STIR versus mDixon T2 TSE and Gad-T1WI SPIR versus mDixon Gad-T1WI TSE) were performed. Sequence-specific acquisition times were collected and compared between the 2 groups.
Statistical Analysis
Variables were summarized as mean⫾SD or count (percentage). The sequence groups were compared using the Mann-Whitney Utest. For the analysis of subjective image-quality ratings, the
ratings of 2 readers were averaged to compare the groups. A permutation test, clustered by patient, was used to compare the presence of dental amal-gam susceptibility artifacts as rated by both readers separately between se-quence groups. Interreader agreement of the subjective ratings was summa-rized using the Cohen (linearly weighted for 5-point scales and un-weighted for binary variables) and percentage agreement. Percentage agree-ment for the 5-point scales was calcu-lated after combining the ratings into a 3-point scale: 1–2, 3, and 4 –5. Bias in ratings between the readers was assessed using the Wilcoxon signed rank test. AP value of⬍ .05 was considered statisti-cally significant. All statistical calcula-tions were conducted with the statistical computing language R (Version 3.1.1; http://www.r-project.org/).
RESULTS
Patient Demographics
Group-based patient demographics are summarized inTable 2. A total of 64 pa-tients met the inclusion criteria, following exclusion of 8 patients (due to suboptimal MR imaging due to motion artifacts [n⫽ 5] and lack of intravenous gadolinium-based contrast agent administration [n⫽ 3]). Group A comprised 33 patients (10 women), while group B comprised 31 patients (11 women).
There was no statistically significant difference in the age (mean, 61⫾15 years versus 55⫾17 years;P⫽.15) or sex (P⫽.79) distri-bution, between the groups. There was no significant difference in body habitus, represented by the ratio between groups, of shoulder width–to–mandibular region AP neck diameter at the C2–3 level (1.53⫾0.16 versus 1.48⫾0.15 for groups A and B, respectively;P⫽ .35); and the ratio of shoulder width–to–midneck AP diameter at the C4 –5 level (3.21⫾0.36 versus 3.16⫾0.40, for groups A and B, respectively;P⫽.88).
Objective Assessment
Objective image-quality measurements are summarized inTable 3. Signal intensity ratios measured between the spinal cord and subcu-taneous fat at the submandibular and supraclavicular levels were sig-nificantly higher for the mDixon technique. For T2-weighted se-quences (STIR versus mDixon T2-weighted TSE), the ratios measured 3.5⫾3.4 versus 5.7⫾1.6, respectively (P⬍.001) at the submandibular level and 3.3⫾3.4 versus 7.4⫾2.4, respectively (P⬍ .001) at the supraclavicular level. Similarly, in the post-gadolinium-enhanced FS T1-weighted sequence (SPIR Gad-T1WI versus mDixon Gad-T1WI TSE), the ratios measured 0.9⫾0.7 versus 3.7⫾ 1.4, respectively (P⬍.001) at submandibular level and 0.5⫾0.3 versus 4.3⫾2.0, respectively (P⬍.001) at supraclavicular level. FIG 1. Lateral (A) and frontal (B) projections of CT topogram images with measurements of
anteroposterior diameter at the level of C2–3 and C4 –5 and transverse diameters at the shoulder.
[image:3.594.57.376.46.199.2] [image:3.594.55.377.236.381.2]Subjective Assessment
The averages of the 2 readers’ subjective assessments of the uni-formity of fat suppression and overall image quality for groups A and B are summarized inTable 4.
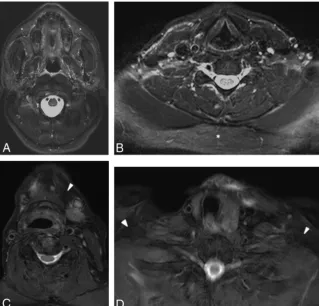
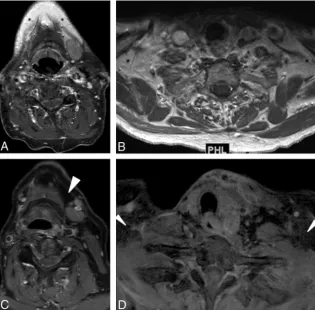
Fat Suppression. The average scores from both the readers for fat suppression at all 3 levels (maxillary, mandibular, and lower neck region) were significantly higher for mDixon T2-weighted FS TSE (mean, 4.4 – 4.7) compared with STIR (mean, 4.0 – 4.3;P⬍.013 for all regions) (Fig 3) and mDixon Gad-T1WI FS TSE sequences (mean, 4.7– 4.8) compared with SPIR Gad-T1WI (mean, 1.4 –3.8, P⬍.001 for all regions) (Figs 4and5).
Overall Image Quality. Similarly, the 2 readers’ average scores for overall image quality were significantly higher for mDixon T2-weighted FS TSE than for STIR (mean, 3.9 versus 3.6;P⫽.022) and mDixon Gad-T1WI FS TSE se-quences (mean, 4.0 versus 2.6; P ⬍ .001).
Susceptibility Artifacts Related to Dental Amalgam. There was no sig-nificant difference in the percentage of subjects with susceptibility artifacts related to dental amalgam between the 2 groups for both fluid-sensitive se-quences (38.7% versus 22.7%, P ⫽ .056) and post-Gad-T1WI sequences (37.1% versus 31.8%,P⫽.5).
Interreader Agreement
The percentage agreement for the uni-formity of fat suppression between the readers was⬎87% for group B patients (On-line Table), though the corre-spondingvalues ranged from 0.05 to 0.15. Across all 3 stations, readers gave ratings of only 4 –5 for 87%–100% of cases, so there was a limited range of rat-ings for theassessment. Group A inter-reader agreement varied between 25% and 91% (On-line Table), with corre-spondingvalues from⫺0.07 to 0.58. Across the 3 stations, readers used only 2 different levels 67%– 99% of the time.
Scan Acquisition Times. The acquisition times were shorter for the mDixon techniques compared with STIR (2 minutes versus 4 minutes 56 seconds) and SPIR (2 minutes versus 3 minutes).
DISCUSSION
In this retrospective study, we enrolled 33 subjects who under-went MR imaging with a STIR and SPIR combination of pression techniques and 31 subjects with mDixon as the fat-sup-Table 2: Demographics and body habitusa
Variable
Sequence Group
PValueb Group B
(n= 31)
Group A (n= 33) Sex
Male 20 (64.5) 23 (69.7) .79
Female 11 (35.5) 10 (30.3)
Age (yr) 61⫾15 55⫾17 .15
Body habitus
AP neck diameter at the level of mandible (C2–3) (mm) 185⫾21 188⫾21 .28
AP diameter of midneck (C4–5) (mm) 127⫾22 124⫾19 .90
Shoulder width (mm) 394⫾35 394⫾45 .84
AP neck diameter at the level of mandible-to-shoulder width ratio 1.48⫾0.15 1.53⫾0.16 .35
Shoulder width-to midneck AP diameter ratio 3.16⫾0.40 3.21⫾0.36 .88
aValues are No. (%) or mean⫾SD unless otherwise specified. b
[image:4.594.54.532.56.196.2]Mann-WhitneyUtest.
Table 3: Objective signal intensity ratiosa
Variable
Sequence Group
PValueb Group B
(n= 31)
Group A (n= 33) T2WI spinal cord–to-fat ratio
Submandibular level 5.7⫾1.6 3.5⫾3.4 ⬍.001
Supraclavicular level 7.4⫾2.4 3.3⫾3.4 ⬍.001
Post-Gad-T1WI spinal cord–to-fat ratio
Submandibular level 3.7⫾1.4 0.9⫾0.7 ⬍.001
Supraclavicular level 4.3⫾2.0 0.5⫾0.3 ⬍.001
a
Values are mean⫾SD unless otherwise specified. bMann-WhitneyUtest.
Table 4: Subjective assessment of image quality, fat suppression, and susceptibility artifactsa
Variable
Sequence Group
PValueb Group B
(n= 31)
Group A (n= 33) T2WI/STIR images
Overall image-quality grade 3.9⫾0.5 3.6⫾0.7 .022
Fat-saturation grade
Maxillary region 4.6⫾0.4 4.3⫾0.5 .013
Mandibular region 4.4⫾0.5 4.0⫾0.6 .007
Lower neck region 4.7⫾0.4 4.3⫾0.4 .001
Dental amalgam susceptibility artifacts (%) 38.7% 22.7% .056 Post-Gad-T1WIs
Overall image-quality grade 4.0⫾0.4 2.6⫾0.6 ⬍.001
Fat-saturation grade
Maxillary region 4.8⫾0.3 3.8⫾0.7 ⬍.001
Mandibular region 4.7⫾0.3 2.8⫾0.5 ⬍.001
Lower neck region 4.8⫾0.3 1.4⫾0.7 ⬍.001
Dental amalgam susceptibility artifacts (%) 37.1% 31.8% .50
aTwo readers averaged. Values are mean⫾SD unless otherwise specified. b
[image:4.594.55.378.234.333.2] [image:4.594.54.373.376.557.2]pression technique. The subjects were matched for age, sex, and surrogate imaging markers of body habitus in the area of interest. In this study group, we demonstrate that the objective image qual-ity measured for signal intensqual-ity ratios (spinal cord to subcutane-ous fat signal) was significantly higher for the Dixon technique compared with STIR and SPIR. This finding clearly indicates that the mDixon technique provides better fat suppression, even in the areas where other fat-suppression techniques failed due to tech-nical reasons. In the subjective assessment, readers scored the mDixon technique significantly higher for uniformity of fat sup-pression and overall image quality. An additional minor advan-tage with the mDixon technique is relatively shorter scan acquisi-tion times. Our study results are in concordance with previous studies comparing the 3-point mDixon with the CHESS fat-sup-pression technique in spine, neck, and orbit imaging.3-5
The main disadvantages associated with STIR include sup-pression of signals from tissues with similar T1 values (such as subacute hematoma and gadolinium-enhanced tissues). In addi-tion, fewer sections were obtained for a given TR compared with the spin-echo technique because a certain portion of the time is consumed by the TI and TE of STIR. STIR is considered sensitive to spatial nonuniformity of the applied radiofrequency pulse (un-less an adiabatic pulse is used). If the strength of the radiofre-quency pulse varies from one position to another within the sub-ject, then the tip angle of the inversion pulse, and hence the quality of fat suppression, will also vary with position. Finally, the unifor-mity of fat suppression may depend on selection of an appropriate
TI.6-9 In addition, STIR alters signal from all tissues and thus decreases the contrast as well as the signal-to-noise ra-tio.2CHESS and its derivative SPIR hy-brid techniques require a homogeneous magnetic field for uniform fat suppres-sion. They fail to suppress fat signal around susceptibility distortions due to metallic hardware, sinuses, and skull base or in the regions far from the iso-center. They also increase the specific absorption rate to the patient and scan times due to use of an extra presatura-tion pulse and dephasing gradient. Uniformity of FS by CHESS/SPIR techniques is heavily dependent on ho-mogeneity of the main magnetic field (B0) and radiofrequency magnetic field (B1); hence, nonuniform fat suppres-sion occurs farther away from the iso-center of B0. Another important factor described to explain the nonuniformity of FS in the CHESS/SPIR technique in areas with a sharp variation of the shape of anatomic structures such as the floor of the mouth and the supraclavicular re-gion is the so-called bulk susceptibility phenomenon.6
The mDixon technique for FS was first described by Dixon in 1984.10This is a spectroscopic imaging technique that relies on water and fat chemical shift differences. The original technique was designed to acquire 2 sets of images, one with water and fat signal being in-phase and the other acquired when water and fat signals are at 180° out-of-phase (referred to as the “2-point Dixon technique”). Using these 2 sets of images, one can generate water-only and fat-only images.11 The water-only images serve as effective fat suppression.3,4,12The main advantage of this technique is that it is relatively insensitive to B0 inhomogeneity but not completely im-mune to it because sometimes the B0 inhomogeneity can manifest as phase errors. The fundamental assumption of the mDixon technique is that water and fat are the only 2 signal-contributing chemical species in the object to be imaged. Under this as-sumption, it is believed that water or fat each has only a single spectral peak. This assumption may be true for water but not for fat because fat is known to contain many spectral compo-nents. The B0 inhomogeneity and other system imperfections contribute to phase error results in signal contributions to both water-only and fat-only images, even from the pixels con-taining only fat tissue.2
Failure of phase correction usually leads to swapping of water and fat assignments for the affected pixels, which can sometimes present a “pseudomass” appearance or incomplete fat suppres-sion. Correlating with both water-only and fat-only images may help reduce this misinterpretation. A more recent techni-cal advance, the 3-point Dixon technique, acquires an addi-FIG 3. Axial STIR (AandB) and mDixon T2-weighted (CandD) MR images. Note incomplete fat
[image:5.594.56.376.47.353.2]tional third set of images along with the traditionally acquired 0° and 180°; it can be either⫺180°, 0, 180° or 0, 180°, 360°. This additional image set helps determine and correct the phase error.13-17 The 3-point Dixon technique is considered less prone to phase error, though it is not completely immune to it. This technique can be applied for both 2D and 3D imaging with different types of pulse sequences, including spin-echo and gradient-based echo sequences.2
Study Limitations
There are several limitations to this study: 1) It is a retrospective study and hence has a limitation of selection bias; 2) it is a relatively small cohort of pa-tients, particularly when considering comparison for 3 different techniques; and 3) a combination of different FS techniques was used in 2 separate popu-lations (groups A and B). This is partic-ularly important because uniformity of FS in certain techniques such as CHESS and its modifications (SPIR) depend heavily on the patient’s body habitus and on patient position in the magnet. In our study, we think the contribution of patient-related factors was not signif-icant, considering that there was no sta-tistically significant difference in the de-mographics and patient body habitus (in the area of interest) between the groups. Fourth, lesion detectability and conspicuity were not assessed due to heterogeneity in the scan indications. Not all patients had a focal lesion, and when a focal lesion was present, no 2 le-sions were comparable due to heteroge-neity in the type of disease, location, and stage of treatment. Fifth, there was some disagreement between readers during the subjective assessment; however, rat-ings by both readers showed similar trends between groups A and B, and the readers typically used only 2 different adjacent rating levels at each station. Therefore, while readers may have disagreed on individual ratings, they usually agreed that ratings were high (4 –5), low (1–2), or moderate (2–3 or 3– 4).
CONCLUSIONS
The mDixon technique provides more uniform fat suppression and improved image quality compared with other commonly used FS techniques such as STIR and SPIR, while reducing se-quence acquisition times in head and neck MR imaging.
Disclosures: Daniel S. Hippe—UNRELATED:Grants/Grants Pending: GE Healthcare, Philips Healthcare, Toshiba America Medical Systems,Comments: for statistical work on other studies.
REFERENCES
1. Del Grande FD, Santini F, Herzka DA, et al.Fat-suppression tech-niques for 3-T MR imaging of the musculoskeletal system. Radio-graphics2014;34:217–33CrossRef Medline
2. Ma J.Dixon techniques for water and fat imaging.J Magn Reson Imaging2008;28:543–58CrossRef Medline
3. Ma J, Singh SK, Kumar AJ, et al.T2-weighted spine imaging with a fast three-point Dixon technique: comparison with chemical shift selective fat suppression.J Magn Reson Imaging2004;20:1025–29
CrossRef Medline
4. Ma J, Jackson EF, Kumar AJ, et al.Improving fat-suppressed T2-weighted imaging of the head and neck with 2 fast spin-echo Dixon
FIG 4. Gadolinium-enhanced axial T1-weighted MR images with SPIR (AandB) and mDixon (Cand D) techniques for fat suppression. Note incomplete fat suppression (asterisks) in the submandib-ular and supraclavicsubmandib-ular regions on the SPIR technique and complete uniform fat suppression (arrowheads) in similar regions on the mDixon technique.
[image:6.594.58.374.48.358.2] [image:6.594.54.286.410.564.2]techniques: initial experiences.AJNR Am J Neuroradiol2009;30: 42– 45Medline
5. Rybicki FJ, Mulkern RV, Robertson RL, et al.Fast three-point Dixon MR imaging of the retrobulbar space with low-resolution images for phase correction: comparison with fast spin-echo inversion re-covery imaging.AJNR Am J Neuroradiol2001;22:1798 – 802 6. Tien RD.Fat-suppression MR imaging in neuroradiology:
tech-niques and clinical application.AJR Am J Roentgenol 1992;158: 369 –79CrossRef Medline
7. Bydder GM, Steiner RE, Blumgart LH, et al.MR imaging of the liver using short TI inversion recovery sequences.J Comp Assist Tomogr
1985;9:1084 – 89CrossRef Medline
8. Bydder GM, Young IR.MR imaging: clinical use of the inversion recovery sequence.J Comp Assist Tomogr1985;9:659 –75CrossRef Medline
9. Shuman WP, Baron RL, Peters MJ, et al.Comparison of STIR and spin-echo MR imaging at 1.5 T in 90 lesions of the chest, liver, and pelvis.AJR Am J Roentgenol1989;152:853–59CrossRef Medline
10. Dixon WT.Simple proton spectroscopic imaging.Radiology1984; 153:189 –94CrossRef Medline
11. Hardy PA, Hinks RS, Tkach JA.Separation of fat and water in fast spin-echo MR imaging with the three-point Dixon technique.J Magn Reson Imaging1995;5:181– 85CrossRef Medline
12. Low RN, Austin MJ, Ma J.Fast spin-echo triple echo Dixon: initial clinical experience with a novel pulse sequence for simultaneous fat-suppressed and nonfat-suppressed T2-weighted spine magnetic resonance imaging.J Magn Reson Imaging2011;33:390 – 400CrossRef Medline
13. Yeung HN, Kormos DW.Separation of true fat and water images by correcting magnetic field inhomogeneity in situ.Radiology1986; 159:783– 86CrossRef Medline
14. Glover GH, Schneider E.Three-point Dixon technique for true wa-ter/fat decomposition with B0 inhomogeneity correction. Magn Reson Med1991;18:371– 83CrossRef Medline
15. Glover GH.Multipoint Dixon technique for water and fat proton and susceptibility imaging.J Magn Reson Imaging1991;1:521–30
CrossRef Medline
16. Maas M, Hollak CE, Akkerman EM, et al.Quantification of skel-etal involvement in adults with type I Gaucher’s disease: fat frac-tion measured by Dixon quantitative chemical shift imaging as a valid parameter.AJR Am J Roentgenol2002;179:961– 65CrossRef Medline