A Smart Phone based Multi-Floor Indoor
Positioning System for Occupancy Detection
Md Shadab Mashuk
Nottingham Geospatial InstituteUniversity of Nottingham Nottingham, United Kingdom [email protected]
James Pinchin
Horizon Digital Economy Research University of Nottingham Nottingham, United Kingdom james.pinchin @nottingham.ac.uk
Peer Olaf Siebers
School of Computer ScienceUniversity of Nottingham Nottingham, United Kingdom [email protected]
Terry Moore
Nottingham Geospatial Institute University of Nottingham Nottingham, United Kingdom [email protected]
Abstract— At present there is a lot of research being done simulating building environment with artificial agents and predicting energy usage and other building performance related factors that helps to promote understanding of more sustainable buildings. To understand these energy demands it is important to understand how the building spaces are being used by individuals i.e. the occupancy pattern of individuals. There are lots of other sensors and methodology being used to understand building occupancy such as PIR sensors, logging information of Wi-Fi APs or ambient sensors such as light or CO2 composition. Indoor positioning can also play an important role in understanding building occupancy pattern. Due to the growing interest and progress being made in this field it is only a matter of time before we start to see extensive application of indoor positioning in our daily lives.
This research proposes an indoor positioning system that makes use of the smart phone and its built-in integrated sensors; Wi-Fi, Bluetooth, accelerometer and gyroscope. Since smart phones are easy to carry helps participants carry on with their usual daily work without any distraction but at the same time provide a reliable pedestrian positioning solution for detecting occupancy. The positioning system uses the traditional Wi-Fi and Bluetooth fingerprinting together with pedestrian dead reckoning to develop a cheap but effective multi floor positioning solution.
The paper discusses the novel application of indoor positioning technology to solve a real world problem of understanding building occupancy. It discusses the positioning methodology adopted when trying to use existing positioning algorithm and fusing multiple sensor data. It also describes the novel approach taken to identify step like motion in absence of a foot mounted inertial system. Finally the paper discusses results from limited scale trials showing trajectory of motion throughout the Nottingham Geospatial Building covering multiple floors.
Keywords—Occupancy; Particle Filter; Indoor Positioning; Wifi; Bluetooth; Multi sensor fusion; Motion detection
I. INTRODUCTION
The energy demand and performance of a building depends on the behavior of occupants engaged in various activities. To understand these energy demands it is important to understand how the building spaces are being used by individuals i.e. the occupancy pattern of individuals. There has been previous work in detecting occupancy of building users using PIR sensors or ambient sensors. The major shortcoming of the previous methods is the sensors limitation in detecting presence and absence of individual occupants in the room only. Indoor positioning technology can potentially be used to overcome this problem by detecting the individual’s journey throughout the building.
An understanding of occupancy in a building environment requires a robust indoor positioning solution to be deployed. Although the positioning system might not require a very high degree of positioning accuracy, the application still requires correct identification of transitions between rooms and corridors and entry and exit from the building. These details together help to get a clear picture of the journey the occupant makes which has possible applications in built environment modelling. The use of Wi-Fi in radio map fingerprinting and Bluetooth Low Energy as a proximity sensor has seen extensive research in indoor positioning over the last couple of years. Pedestrian dead reckoning solution using sensors like UWB and foot mounted inertial sensors are gaining more popularity. These sensors require devices which are bulky or have to be worn and are not very convenient for participants to be in their natural state of occupancy over a long period of time such as typical office hours. Thus it becomes a very different scenario when it comes to deployment of indoor positioning system in large areas involving continuous data collection over a long period of time in an environment like academic or office buildings. The use of BLE in indoor positioning research has made a lot of advances recently due to the fact that it is extremely cost effective, easy to deploy and has the potential to The lead author, Md Shadab Mashuk is supported by the Horizon Centre for
be used in a variety of context. Due to its short but adaptable range it has been very appealing for research in industries related to smart cars, supermarkets or hospitals requiring proximity based localization. The availability of both Wi-Fi and BLE sensors in smart phones makes it more convenient for the user to easily carry potential positioning capability on their own pocket and although the hardware capability of inertial sensors like accelerometer and gyroscope may fall short of widely used state of the art foot mounted Inertial MEMS sensors it nevertheless allow for research opportunities in novel application of indoor positioning using smart phones for personal positioning.
This research presents a novel application of indoor positioning technology proposing a prototype positioning system for occupancy detection in building environment using personal positioning. The solution is based on a particle filter that combines Bluetooth Low Energy (BLE) and Wi-Fi fingerprinting. The positioning algorithm utilizes environmental features such as map matching and computes relative heading information from an orientation filter, based on accelerometer and gyro data from the smart phone. The entire proposed positioning solution is dependent on a smart phone to be carried by participants in their pockets all the time and carry on with their daily work in an office environment. Due to the absence of foot mounted inertial sensor zero velocity based step detection is not possible since the Smart phone will be in the pocket; instead particles are propagated forward by a simple but novel step-like motion detection algorithm using accelerometer data from the smart phone. The motion detection algorithm looks for step like motion using a simple pattern matching algorithm in every constant short interval of time. Transition between floors is detected using Bluetooth Low Energy that can be used as a trigger on and off the stairways by reducing the range of BLE Beacons and deploying them strategically along the stairways.
This paper starts with a brief review of current occupancy detection methodology and indoor positioning technology. The following sections discusses experimental results of the relative heading computation based on the gyro data and the results from motion detection involving trials to account for different walk patterns (fast and slow). We then discuss the Wi-Fi and Bluetooth fingerprinting and static positioning accuracy when both Wi-Fi and BLE fingerprinting are combined compared to their accuracy when used on their own. Finally different individual sensor data are integrated in a simple multisensory integrated indoor positioning system and the results of actual trials carried out throughout the building are discussed.
II. BACKGROUND
To understanding the motivation behind this paper it is important to briefly understand the current state of occupancy detection methodology before we can move on to review indoor positioning techniques and choice of technology for occupancy detection. Occupancy detection has been the core to developing models related to understanding building energy usage and occupant behavioral models. The university of Nottingham Built Environment department has worked extensively to develop an in-house custom built Multi Agent Simulation Platform [1] incorporating behavioral models and
an occupant presence model [2]. Other methodology discussed in [3] shows the use of environmental sensors such as light, temperature and CO2 using different statistical and machine learning modelling techniques. Other similar research can be seen in [4]–[6] where authors have experimented with using camera technology, ambient sensors, agent based modelling approach etc. The application of indoor positioning sensor can be seen in [7] where iBeacons have been used as a proximity sensor to detect occupancy in building using android smart phone for data collection. Some of the important shortcoming of methods related to the use of CO2and ambient sensors is that the trials are done in a controlled and small scale and not done to detect actual occupancy covering an entire building. The PIR sensor fails to account for the presence of the participants in any other part of the building. This means even though the individual is not present in their respective office they may still be within the building. Indoor positioning technology has the potential to be used for occupancy detection. There has been a lot of research on the use of indoor positioning technology as a pedestrian positioning solution. There is a discussion on available positioning technology and algorithm in [8], with Bluetooth and Wi-Fi being the most widely researched.
Bluetooth is a wireless technology commonly used in short range communication. It is widely popular in smart phones for transmitting data within short range and traditionally operates in the 2.4 GHz spectrum, ranging from 2400 to 2485 MHz. Since Bluetooth operates in short ranges it can be understood that there is a correlation with the transmitted power and the effective area coverage. This flexibility helps to customize the range of the device for proximity based positioning. Research work related to the use of Bluetooth can be seen in [9]. The authors’ uses a client server architecture model and locates the device using a combination of Trilateration technique and signal coverage density method (SCDM). A more thorough approach to Bluetooth fingerprinting based positioning algorithm can be found in [10] where Faragheret alprovides a thorough analysis of the accuracy of Bluetooth fingerprint positioning and compares with the Wifi fingerprinting. Application of Machine learning algorithm in estimating position is discussed in [11] Proximity based positioning can be found in [12]. Bayesian and Gaussian filter based positioning solution can be seen in [13][14] and use of context or behaviour aiding traditional positioning can be found in [15].
thus reducing computation. Wi-Fi AP can also serve as proximity detectors. As seen in the paper [21] the authors were working on effective scheduling of task management in the Queens Medical Center Hospital, Nottingham. Inertial positioning solution using smart phones can be found in [22]– [24]. A thorough overview of the wide array of positioning technology is not within the scope of this paper but the intent is to provide the reader with a brief background of the possibilities and potential carried with them. In the following section we will discuss the motion detection and the heading estimation algorithm followed by the implementation our proposed positioning framework.
III. MOTIONDETECTION A. Background
[image:3.595.323.533.315.407.2]Human Steps can be analysed using the accelerometer data which can be easily retrieved from available sensors in a smart phone. Due to its periodic pattern during each step foot mounted IMU detects zero velocity updates or Peaks to identify a step. Since in this research the Smart phone is supposed to be in the user’s pocket correctly identifying a zero velocity update during each step becomes very complicated and subsequently inaccurate. This is because the phone will always be in motion both during each walking stance and when the foot is on the ground due to hip movement. Generally smart phones have poor quality of sensors which makes the output very noisy. A typical accelerometer plot showing the normalized acceleration for a period of nine seconds can be seen in Fig. 2 and of two seconds in Fig. 3. Typically during a step the acceleration varies from person to person and also depending on walking speed. As such it is difficult to analyze the data in terms of statistical measure, like variance, or covariance, since it is not possible to define a specific threshold for variance when matching the reference walk template data. Peak-valley analysis of accelerometer data is not always accurate because of random body movement due to change in postures and turns.
Fig. 1. Walking stance phase; one complete cycle [25]
This will produce acceleration peaks which are similar to a step and will be wrongly identified as one. Other alternatives are using machine learning techniques to learn steps based on individual motion characteristics and can be computationally expensive. It can be seen in Fig. 1 what a typical walking gait cycle looks like. Empirical results shows that it takes a minimum 1 sec to complete one walking cycle i.e 2 steps using both feet, starting from initial contact to terminal stance shown in the picture. Since in this research only walking is taken into consideration when detecting motion we can discard running or jogging. In this paper two different methods of identifying
motion have been discussed; peak-valley analysis of the raw accelerometer data and pattern matching using discrete fourier transform (DFT) analysis of every two seconds of accelerometer data. The peak-valley analysis is used as a complementary check with the DFT results and a combined algorithm is developed for step like motion detection.
B. DFT based motion detection
[image:3.595.326.537.447.531.2]We have developed a simple pattern matching algorithm that takes in two seconds of the accelerometer data as input in time domain and performs a Discrete Fourier Transform (DFT). The mathematical details of how the DFT calculates the amplitude is not part of the research but rather the analysis of the amplitude to find patterns that can be used to identify walk like motion. In this case accelerometer sampling rate was 50 Hz or every 0.02 millisecond thus every 2 seconds of data is worth 100 samples in the walk template. The DFT output will have 50 amplitude peaks in the frequency domain plus 1 offset peak. The idea is to look for the dominant frequencies; in this case the top 5 dominant frequencies are checked against a threshold typical of a walk like motion.
[image:3.595.36.293.482.577.2]Fig. 2. Typical Acceleration Plot over a period of 9 seconds
Fig. 3. Typical Acceleration Plot over a period of 2 seconds
[image:3.595.335.546.567.691.2]C. Peak-Valley motion detection
In a peak-valley analysis every two seconds of acceleration data is analysed for peak acceleration and adjacent valley; minimum acceleration. Since there will be peaks for any kind of motion in the smart phone whether in the pocket or in the hand we compute the average of the peak and valley acceleration values for every two seconds of data. This helps to provide more reliable average peak detection during motion. It can be seen in Fig. 4 that the green points mark the peak acceleration and the red points mark the corresponding valley acceleration for every 2 seconds of data. The purple point is the average of the two extremities. During motion there can be multiple peaks and valleys in the two second window but we take only the maximum peak and valley data. It can be seen, during regular walking motion that the average peak valley is always above a certain threshold, in this case the experimental threshold was above gravity,g,or roughly 10m/s2. At the same time it can be also seen that there are some false peaks due to the smart phone in the hand at the beginning or feet movement not implying actual walk but rather change in body postures in static scenarios. This will create the false impression of a step like motion being taken and will likely overestimate and end up with erroneous position. The paper [26] suggests using this technique alone but the conditions in which the trials were carried out were very much in controlled environment where the steps were clearly defined and prominent unlike in a real world environment where participants will be freely navigating without any constraint.
D. Combined DFT and Peak-Valley motion detection
To minimize the effect of falsely detected motion an algorithm has been developed that combines both the results during detection of step like motion. The DFT pattern is compared with a peak-valley analysis of every two seconds of accelerometer data. The DFT method is used to detect clearly identifiable step like motion that agrees with the DFT threshold for the dominant frequencies and the upper limit threshold. The average peak valley analysis result is used to identify the lower limit threshold in motion which is below a specific average. In a real life walk scenario based on experimental evaluation the average peak-valley value will never be equal to or less than the gravity g even though the individual peaks and valley may be well above g. The idea is to make a correction by checking for average peak-valley results which are below gravity g acceleration but wrongly detected as motion using the DFT method, thus providing a filtering layer to minimize error. The algorithm looks into every two seconds of accelerometer data to detect step-like motion. This implies the individual is in motion in both the seconds.
ALGORITHM STEPS
1) Smooth the normalized raw accelerometer data using a moving average filter.
2) Compute the DFT amplitude for 2 sec of actual walk 3) Analyze the top 5 dominant frequency peaks and define
a threshold αDFT(experimental threshold) for the amplitude. 4) Check if number of peaks above αDFTis greater than or equal to 2 (experimental threshold for minimum number of
peaks required to qualify for a step like motion) and the offset frequency amplitude is less than 25 (experimental upper limit)
5) If true a step-like motion is detected according to DFT method
6) Find peak and valley from the same two seconds of accelerometer data and compute the mean acceleration µPkv
7) Check if DFT motion is detected and mean µPkv is
below a threshold αPkv(experimental threshold 9.75).
8) If true update the step-like motion detection to false otherwise keep the DFT value.
9) Repeat from step 3 for every 2 second of accelerometer data till the end.
[image:4.595.324.553.547.673.2]Some of the walk trial results can be seen in the following figures. A brief analysis of the plots (at different walking pace) show peak-valley analysis in purple along the actual accelerometer plot, the DFT plot in red and the combined analysis plot in green. Fig. 5 shows the circled points where peak-valley analysis suggests a step-like motion is being taken but the DFT pattern matching correctly identifies them as no-step. In Fig. 6 and Fig. 7 the DFT has wrongly identified a step-like motion but the peak-valley analysis corrects it as shown in the circled area. The algorithm discussed above is very simple yet highly effective when detecting step-like motion and both the peak-valley and DFT template matching technique compliments and corrects each other’s output to provide a reliable step-like motion detection solution.
Fig. 5. Trial walk-1, circles showing wrongly detected motion in peak-valley average but corrected using the DFT as shown in the combined plot.
Fig. 7. Trial walk-3, circles showing wrongly detected motion in DFT but corrected using peak-valley analysis in the combined plot.
IV. HEADINGESTIMATE
In recent years, MEMS inertial sensors (3D accelerometers and 3D gyroscopes) have become widely available because of low cost and smaller size. Measurements from inertial sensors like accelerometer and gyro are obtained at high sampling rates and can be integrated to obtain position and orientation information. These estimates are accurate on a short time scale, but suffer from integration drift over longer time scales as discussed in this paper [8]. Also for collecting occupancy data it is not convenient to wear a foot mounted IMU over a long period of time. As such an IMU from the smart phone is the most practical choice instead of a foot tracker; though the sensors can be of even poorer quality and would suffer from the same drift issue. A significant amount of research has been done to understand the application of mobile phones in pedestrian dead reckoning [27]–[31] and they discuss the performance of the positioning solution and evaluate related issues such as bias and noise in mobile phone sensors.
Orientation computation is not something new and there are numerous papers [28], [30], [32] that discuss the implementation. Typically heading estimate can be computed using a fusion of gyro and magnetometer if the initial orientation of the device is known or if the earth’s magnetic north is used as a reference. It is well known that magnetometers suffer from distortion when indoor due to various reasons, most importantly due to presence of ferrous or magnetic objects. As such heading estimate using a magnetometer and gyro sometimes might give unreliable results. Thus accelerometer is also used as an alternative or in combination with a magnetometer to improve accuracy [33]. This sensor fusion may use any but not limited to the following algorithms for accurate estimation of heading; Madgwick AHRS filter [34], Mahony AHRS filter [34], Complimentary filter, Kalman filter, Compensation of Magnetic Disturbances [35]. Current smart phones are generally equipped with a tri-axial accelerometer, gyro and magnetometer. To estimate heading just by using accelerometer and gyro it is important to have a heading direction reference for initialization. Since it will be inconvenient for participant’s to start every time facing a specific direction we try to compute relative heading simply by using the gyro and accelerometer in a Mahony filter [34], [36]. The mean accelerometer data is used during the initialization period of coarse alignment known as levelling to compute error between the attitude and a known measured
direction of gravity and the rate of change of quaternion. We then use the gyro reading at every epoch and use quaternion computation to estimate the relative heading from the gyro data. In our case since the particle filter will be used and the
particles are initialized with random heading (0-360◦ uniform
distribution), it is not necessary to compute absolute heading. An accurate heading-change estimate is enough to guide the particles to propagate in the right direction.
The computation of heading using the Mahony filter is quite straightforward. Accelerometer data is collected at each epoch and applied to correct the estimated direction of gravity. During trial data collection the phone is always kept in the user’s trouser pocket with the data logger running in the background. This helps to ensure the measured direction of gravity never deviate too much due to tilting of the phone over time and will remain stable. The corrected direction of gravity is applied to the corresponding gyro data with the filter gain. Filter gain is the rate of convergence toward the measurement error, in this case in the Gyro measurement. The compensation of gyro bias in traditional Kalman filter is done in an additional state but according to Mahony et al [36] this can be easily done in simple orientation filters through the integral feedback of the error in the rate of change of orientation calculated. Thus the gyro bias drift is automatically compensated when the rate of change of quaternion is computed and subsequent integration to yield quaternion for that epoch. Heading is then obtained by computing the yaw from the quaternion vector. To get a clear idea of quaternion mathematics the reader is referred to the following paper [37].
A. Experimental Results
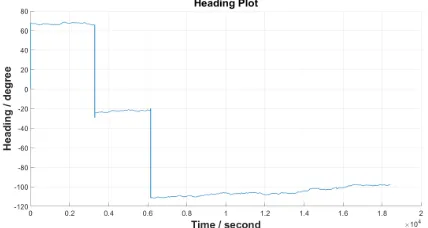
In the trial an LG Nexus smart phone was used which has a 3-axis accelerometer and a gyroscope integrated. The data collection rate was kept at 50Hz. To evaluate the accuracy and stability of the heading estimate walk trials were carried out as shown in Fig. 9. The results show stable heading estimate
[image:5.595.324.538.473.587.2]Fig. 9. Heading evaluation trial walk results showing clerly distinguishable heading changes during major turns.
with clearly identifiable heading change corresponding to the turns. To further evaluate the stability of the gyro and the accelerometer the smart phone was kept on a table for almost 6
hours with two 90◦ rotations being made. This was mainly to
check if there are any significant drift over long period of time. The resulting plot can be seen in Fig. 8.
V. MULTI SENSORPOSITIONINGFRAMEWORK In this section we evaluate and discuss the basis of the positioning framework that forms the core of the proposed positioning system in this paper. The system is developed by creating radio maps utilizing existing WLAN commonly known as Wi-Fi and Bluetooth low energy or BLE beacons deployed throughout the of Nottingham Geospatial Building. Radio maps are creating using the widely known technique of Fingerprinting; based on collection of radio signals on predefined reference points spatially located in the building layout.
A. Test Bed configuration
The site for experimental trial was the Nottingham Geospatial Building located in Jubilee Campus, University of Nottingham. It is a three storey state-of-the-art building housing academics, PhD students and researchers. The research was carried out covering the first two floors of the building. In total there were 8 Wi-Fi AP’s transmitting in both
2.4 GHz and 5GHz frequencies. Floor-A had 15 and Floor-B had 10 beacons deployed. The range and power of the beacons were configured according to the area of coverage required ensuring there is enough variability of the radio signal. A custom built Android specific data logger was developed that could log Wi-Fi, Bluetooth, accelerometer and gyro data together with system time information in separate files. The data collection rate of accelerometer and gyro was configured at 50Hz and Wifi and Bluetooth was configured at every second. In reality the actual time of data logged was sensor specific. For Wi-Fi typical scan results in the Android OS is returned after scanning all the 12 channels from all the accessible Wi-Fi AP’s, this resulted in signal data being recorded typically after every 4 second interval. Bluetooth on the other hand logged data whenever it detected a beacon within its range. These also sometimes resulted in missing some signal data completely, during instances when it cannot detect any iBeacons or Wi-Fi AP due to no-LOS, interference, obstruction or hardware malfunction.
[image:6.595.315.531.297.435.2]B. Gaussian Processed Fingerpinting
Fig. 10. Floor-A map with reference training points (TP)
[image:6.595.328.536.479.614.2]Fig. 12. BLE Heat map showing the signal variability.
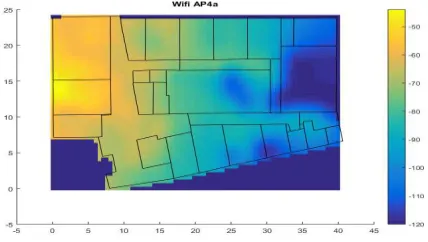
[image:7.595.301.564.111.212.2]Static fingerprint databases were created using Wi-Fi and BLE signal RSSI recorded at each of the Training reference points (TP); 181 for Floor A and 165 for Floor B marked in blue as shown in the Fig. 10 and Fig. 11. At each TP signal strength was recorded for an average duration of 5 mins resulting in nearly 30 hours of data collection spanned over several weeks. For data collection an LG Nexus 5 was used. The TP’s were then used as input in a Gaussian Process Regression (GP) similar to [10] to develop a fingerprint of 0.5m by 0.5m resolution. Gaussian Process is a supervised machine learning technique that predicts based on input mean, covariance and likelihood approximation. A typical heat map of a BLE and Wi-Fi GP fingerprint can be seen in Fig. 12 and Fig. 13. The color bar on the right hand side shows the scale of variation of the RSSI value.
Fig. 13. Wifi Heat map showing the signal variability.
C. Evaluation of Fingerprint Positioning
After generating the GP fingerprint Wi-Fi and BLE samples were collected in a stationary state at different marked points in the building to evaluate the static positioning accuracy. The collected samples were compared with their corresponding GP fingerprint database and difference map was computed. This was done using a pattern matching algorithm as mentioned in [38] such as the root mean square of the difference between measured and database signal strength for both Wi-Fi and BLE. The difference map is normalized in the scale of 0-1 to produce a probability map. Then, using a weighted K-Nearest Neighbor approach position is computed for Wi-Fi and BLE separately. Aggregate position is computed by combining the probability maps using joint probability. The results of the positioning error can be seen in Table 1.
Surprisingly the positioning error in Floor B for BLE and Wi-Fi-BLE Aggregate increased compared to Floor A. This can possibly happen because of less beacon density, large amount of furniture’s and people significantly affecting the signals.
TABLE I. STATICPOSITIONINGERRORSTATISTICS
Data Statistics
Agg Mean
BLE Mean
Wi-Fi Mean
Agg Median
BLE Median
Wi-Fi Median
Floor B 3.7m 4.2m 7.4m 3.6m 3.9m 5.2m
Floor A 4.2m 4.57m 3.2m 4.04m 4.26m 3.2m
D. Map Matching
Map matching is a part of environmental feature matching explained in [38]. It is widely used in positioning algorithms to aid movement of objects or particles so that we get a well-controlled projection of movements within the area at each epoch. In this research floor plan design files were provided in CAD format. These CAD files were converted into Matlab matrices with characteristics of the floor, like doors, walls and their association with adjacent walls and rooms. Rooms are identified as polygons with the walls as coordinates and doors are represented as coordinates accordingly. All the rooms and doors are given an ID.
E. Stair Detection
BLE beacons were used to detect transition between floors. The Kontakt BLE beacons range can be configured from the admin panel and they are tuned to the minimum to ensure detection when passing by. NGB had three stairs and appropriate numbers of Beacon’s were placed on each stairs so as to detect an individual’s entire journey time through the stairway. The Beacons for each stair also acts as a label thus providing the stair information as well. This helps to identify the transition from one floor to the other and the stair information helps to locate the entry and exit when transiting between floors.
F. Particle Filter Engine
[image:7.595.58.272.394.515.2]The sensor fusion diagram can be seen in Fig. 15. Since data is post-processed in this positioning system, at each epoch when radio observations became available the Wi-Fi and BLE GP fingerprint database is looked up respectively, compared with their recorded mean RSSI and a difference map is computed for each. Since the sampling rate of the Wi-Fi was every four seconds and BLE was every two seconds, the missing observations between the epochs were computed according to Fig. 14. The difference map of the Wi-Fi and BLE are normalized to get probability maps and their joint-probability is computed to get the aggregate observation map. This aggregate observation is used at each epoch to compute static position when stationary and alternatively when in motion passed to the particle filter engine to provide the weights of the particles. Here an epoch corresponds to a second. In our filter engine 4000 particles were used and their weights were taken directly from the Wi-Fi and BLE aggregate map as discussed before.
Fig. 14. Wi-Fi and BLE observation computed for missing epochs
Fig. 15. Sensor fusion engine showing the different sensor intergration
PARTICLEFILTER ALGORITHM STEPS
1) Initialize particles with random heading uniformly
distributed from 0-360◦ and with some uncertainty around the
initial starting position. The initial starting position is taken from the last known stationary position already computed.
2) For each epoch check if step-like motion is detected. 3) Check Stair detection, if true record stair number and repeat step 2 else go to step 4.
4) Prediction State: If step-like motion detection is true propagate particles forward based on heading and step length. Step length can vary depending on persons' height, weight and context. Also step length can vary significantly if a door encountered or if the person stops for few seconds; this situation are taken into account as well to simulate a realistic scenario as much as possible. All the values are based on experimental observation.
a)Default = 1.3m
b)Door encountered = 0.3m
c)Sudden pause = 0.8 m for next 3 seconds
Check for heading change (threshold 10◦) and update the
particle clouds’ heading together with some heading noise. Random noise is added +/-0.3 m to account for uncertainty in step length. Then the new position coordinate for each particle is predicted using the updated heading and step length.
5) Update State: Use Map matching to constrain particle movement within walls and corridors by checking if a particle crosses a wall. If a particle crosses a wall without a door within 0.5 m vicinity it is given a zero weight. Then each particle is given weight from the RSSI difference map directly. Then the particles are normalized so that∑ܹ௧=1
6) Re-sampling: After the update step the effective particle size with non-zero weights are taken and Multinomial re-sampling method is employed to re-sample the particles based on their weights. A particle trajectory history was kept and this is also resampled. This ensures the characteristics such as heading, position, weight etc. of the fittest and longest surviving particles are copied to the old ones according to the equation Ptnew= Ptold+ ϵ.
If the effective number of particles with non-zero weights become zero we reinitialize the particle distribution to the previously computed Wifi/BLE position with random heading
distribution of 0 - 360◦..
7) Finally compute the effective median position from the particle history and repeat from step 2.
The position vector is then updated with the newly computed position from the particle filter. In epochs when stairs are detected the position matrix is kept null but labelled separately with the stair number to facilitate floor transition and stair identification.
VI. RESULTS ANDDISCUSSION
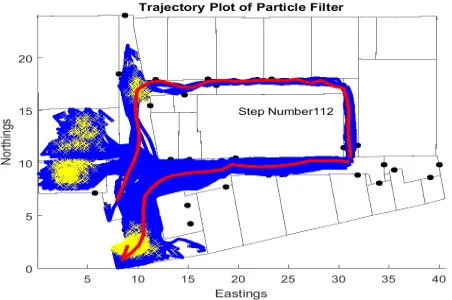
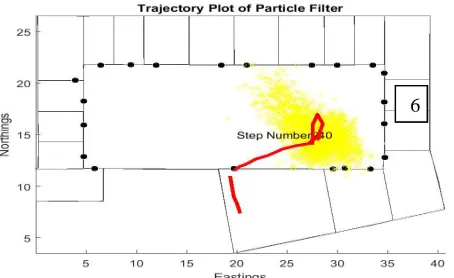
[image:8.595.44.291.433.672.2]android data logger running in the background. All the trials were done in a walking state only; the running state is not taken into consideration. The red trajectory on each plot is the aggregate position (median) from the particle filter and the yellow ones are the particles position at the end of the trial. The trial plots on different floors can be seen in Fig. 16, Fig. 17, Fig. 18. In general the results showed relatively good performance in terms of accurately identifying occupancy information i.e transition between rooms and corridors. The plot in Fig. 19, Fig. 20 and Fig. 21, Fig. 22 shows trajectories involving multiple floors and stair detection. It can be seen in Fig. 19, the trajectory halting infront of the stairway in Floor-B and then reappearing in Floor-A and then continuing as shown in Fig. 21. A Similar trial can be seen in Fig. 21 and Fig. 22 where stairs were detected and the transition between floors occurred. It should be noticed that the trajectory on Fig. 21 should have turned a bit further after the turn and ended infront of the stair marked in black and orange. Similarly in some plots the particles are clustered at more than one position. This happened mainly because of the particles receiving good weights from the fingerprint difference maps due to the less variability and an overlapping coverage area from the BLE Beacons. To ensure relatively unique signal coverage more BLE beacons could have been placed at regular intervals or at important junctions. Wi-Fi has almost no impact since it has a very large coverage area with relatively poor variability of the signal strength within short distances. The map constraint helped aid the positioning significantly especially along the narrow corridors and smaller rooms with walls.
[image:9.595.320.546.258.401.2]Finally to evaluate occupancy detection a trial was carried out for almost an hour. The plot in Fig. 23 shows the sequence of movement when in motion only. Stationary periods involved sitting on the desk for long period or talking while standing in between each trajectory to mimic a realistic occupancy scenario; evident from the occupancy plot in Fig. 24 but excluded from the trajectory plots below.
Fig. 16. Floor A Trial-1 showing the particle filter trajectory from a test walk.
Fig. 17. Floor A Trial-2 showing the particle filter trajectory from a test walk
[image:9.595.320.546.444.586.2]Fig. 18. Floor B Trial-1 showing the particle filter trajectory from a test walk
[image:9.595.52.278.475.625.2]Fig. 20. Stairway Trial 1B showing the trajectory after coming off the stair
[image:10.595.52.268.387.520.2]Fig. 21. Stairway Trial 2A showing the trajectory till the stair
Fig. 22. Stairway Trial 2B showing the trajectory after coming off the stair
1
2
3
4
5
Stairwell
Fig. 23. Multiple plots numbered (1-6) showing sequence of movements over a continuous period of time
The corresponding occupancy plot can be seen in the Fig. 24 with the entire time series of occupancy with room numbers marked. Floor changes are detected with short transition between the stairs. In the figure rooms are numbered randomly and do not represent actual physical room numbers. Stairs were labelled with a negative number for ease of presentation only. Plot, marked one on Fig. 23,shows the position almost near the wall of the next room due to the particles weight distribution from the map. The plot, marked three shows the trajectory going inside the room instead of turning toward the stairs, marked in blue. This was mainly due to the majority of the particles drifting inside the room due to good area coverage from Beacons inside resulting in erroneous positioning at the end.
Fig. 24. Occupancy time series plot showing the occupancy corresponding to the Fig 23
VII. CONCLUSION ANDFUTURE WORK
This paper has discussed the research carried out with the intention to develop a prototype multi sensor indoor positioning system, using a typical smart phone capable of detecting natural occupancy that includes transition information as well. The main objective was to evaluate the
robustness of such a positioning system if deployed in an academic office environment to understand occupancy patterns, thus highlighting the possibility of another novel application of indoor positioning.
The research showed promising results but it should be acknowledged that industrial level application of smart phone based indoor positioning technology in populated or architecturally complex environment such as office or residential buildings is still a far cry. Even though the research intended to detect occupancy in the most natural state of a person’s occupancy there were still some constraints that had to be applied. In our case we considered the walking state only, in real life there will be scenarios when a person might be rushing if not running. Even though there are papers discussing various motion-mode detection algorithms they are tested mostly in controlled environment with clearly identifiable state changes such as phone in the hand or talking etc. Phone in the hand would also impact the heading information; in our case the phone was always kept in the pocket to avoid this additional computation and integration. The particle filter showed occurrences of multiple clusters whenever there was less variability from the GP fingerprint map or similar RSS values in overlapping areas. One possible solution is to use more BLE Beacons.
So far the trials discussed in this paper were carried out by the lead author himself. Future work would cover day long trial within the existing constraints of this positioning framework already developed. Ethics approval will be sought to carrying out positioning trials involving other participants. This would help to further understand the robustness and accuracy of the system when used by different users to detect occupancy.
ACKNOWLEDGMENT
The lead author, Md Shadab Mashuk is grateful to all the Nottingham Geospatial Building staff and colleagues who supported in carrying out this research
REFERENCES
[1] D. C. J, S. PO, and Robinson, “Coupling Multi-Agent stochastic simulation of occupants with building simulation,”Proceedings of the Building Simulation and Optimization Conference, 2014. .
[2] J. Page, D. Robinson, N. Morel, and J.-L. Scartezzini, “A generalised stochastic model for the simulation of occupant presence,”Energy Build., vol. 40, no. 2, pp. 83–98, Jan. 2008.
[3] L. M. Candanedo and V. Feldheim, “Accurate occupancy detection of an office room from light, temperature, humidity and CO2 measurements using statistical learning models,”Energy Build., vol. 112, pp. 28–39, 2016.
[4] B. Donget al., “An information technology enabled sustainability test-bed (ITEST) for occupancy detection through an environmental sensing network,” Energy Build., vol. 42, no. 7, pp. 1038–1046, 2010.
[5] C. L. C. Liao and P. Barooah, “An integrated approach to occupancy modeling and estimation in commercial buildings,”Am. Control Conf., pp. 3130–3135, Jun. 2010.
[6] H. C. Shih, “A robust occupancy detection and tracking algorithm for the automatic monitoring and commissioning of a building,” Energy Build., vol. 77, pp. 270–280, 2014.
[image:11.595.60.316.395.596.2]Detection via iBeacon on Android Devices for Smart Building Management,” inDesign, Automation & Test in Europe Conference & Exhibition (DATE), 2015, 2015, pp. 629–632.
[8] R. Harle, “A Survey of Indoor Inertial Positioning Systems for Pedestrians,” IEEE Commun. Surv. Tutorials, vol. 15, no. 3, pp. 1281–1293, 2013.
[9] J. J. M. Diaz, R. de A. Maues, R. B. Soares, E. F. Nakamura, and C. M. S. Figueiredo, “Bluepass: An indoor Bluetooth-based localization system for mobile applications,” in The IEEE symposium on Computers and Communications, 2010, pp. 778–783.
[10] R. Faragher and R. Harle, “An Analysis of the Accuracy of Bluetooth Low Energy for Indoor Positioning Applications,” in Proceedings of the 27th International Technical Meeting of The Satellite Division of the Institute of Navigation (ION GNSS+ 2014), 2014, pp. 201–210.
[11] C. Gurrin, “A Comprehensive Study of Bluetooth Fingerprinting-Based Algorithms for Localization,” in 2013 27th International Conference on Advanced Information Networking and Applications Workshops, 2013, pp. 300–305.
[12] H. K. Fard, Y. Chen, and K. K. Son, “Indoor positioning of mobile devices with agile iBeacon deployment,” in 2015 IEEE 28th Canadian Conference on Electrical and Computer Engineering (CCECE), 2015, pp. 275–279.
[13] J. Rodas, C. J. Escudero, and D. I. Iglesia, “Bayesian filtering for a bluetooth positioning system,” in 2008 IEEE International Symposium on Wireless Communication Systems, 2008, pp. 618– 622.
[14] Z. Jianyong, L. Haiyong, C. Zili, and L. Zhaohui, “RSSI based Bluetooth low energy indoor positioning,” in 2014 International Conference on Indoor Positioning and Indoor Navigation (IPIN), 2014, pp. 526–533.
[15] P. Groves, H. Martin, K. Voutsis, D. Walter, and L. Wang, “Context Detection, Categorization and Connectivity for Advanced Adaptive Integrated Navigation,”Proc. 26th Int. Tech. Meet. Satell. Div. Inst. Navig. (ION GNSS+ 2013), pp. 1039–1056, Sep. 2013.
[16] N. Pritt, “Indoor positioning with maximum likelihood classification of Wi-Fi signals,” in2013 IEEE SENSORS, 2013, pp. 1–4.
[17] N. Le Dortz, F. Gain, and P. Zetterberg, “WiFi fingerprint indoor positioning system using probability distribution comparison,” in 2012 IEEE International Conference on Acoustics, Speech and Signal Processing (ICASSP), 2012, pp. 2301–2304.
[18] H. Zhou and N. N. Van, “Indoor Fingerprint Localization Based on Fuzzy C-Means Clustering,” in2014 Sixth International Conference on Measuring Technology and Mechatronics Automation, 2014, pp. 337–340.
[19] A. Baniukevic, C. S. Jensen, and H. Lu, “Hybrid Indoor Positioning with Wi-Fi and Bluetooth: Architecture and Performance,” in2013 IEEE 14th International Conference on Mobile Data Management, 2013, vol. 1, pp. 207–216.
[20] A. Baniukevic, D. Sabonis, C. S. Jensen, and H. Lu, “Improving Wi-Fi Based Indoor Positioning Using Bluetooth Add-Ons,”2011 IEEE 12th Int. Conf. Mob. Data Manag., vol. 1, pp. 246–255, Jun. 2011.
[21] J. Pinchin, M. Brown, J. Blum, D. Shaw, and J. Blakey, “Integrating
WiFi based positioning with a job management system to study task management behaviour,” in2014 IEEE/ION Position, Location and Navigation Symposium - PLANS 2014, 2014, pp. 193–200.
[22] H. Li et al., “An indoor continuous positioning algorithm on the move by fusing sensors and Wi-Fi on smartphones,” Sensors (Switzerland), vol. 15, no. 12, 2015.
[23] N. Zhu, H. Zhao, W. Feng, and Z. Wang, “A novel particle filter approach for indoor positioning by fusing WiFi and inertial sensors,”Chinese J. Aeronaut., vol. 28, no. 6, pp. 1725–1734, 2015.
[24] Z. A. Deng, Y. Hu, J. Yu, and Z. Na, “Extended Kalman filter for real time indoor localization by fusing WiFi and smartphone inertial sensors,”Micromachines, vol. 6, no. 4, 2015.
[25] “Achilles Tendinopathies in Runners: Causes, Treatment, and Prevention - Dubin Chiropractic.” [Online]. Available: https://dubinchiro.com/2013/10/achilles-tendinopathies-in-runners-causes-treatment-and-prevention/. [Accessed: 23-Jan-2018].
[26] H. Lee, S. Choi, and M. Lee, “Step Detection Robust against the Dynamics of Smartphones,”Sensors, vol. 15, no. 10, pp. 27230– 27250, Oct. 2015.
[27] A. Kos, S. Tomažič, and A. Umek, “Evaluation of Smartphone Inertial Sensor Performance for Cross-Platform Mobile Applications.,”Sensors (Basel)., vol. 16, no. 4, Apr. 2016.
[28] Z. A. Deng, G. Wang, Y. Hu, and D. Wu, “Heading estimation for indoor pedestrian navigation using a smartphone in the pocket,” Sensors (Switzerland), vol. 15, no. 9, pp. 21518–21536, Aug. 2015.
[29] M. Kok, J. D. Hol, and T. B. Schön, “Using Inertial Sensors for Position and Orientation Estimation,” Apr. 2017.
[30] A. Kos, S. Tomažič, and A. Umek, “Suitability of smartphone inertial sensors for real-time biofeedback applications,” Sensors (Switzerland), vol. 16, no. 3, p. 301, Feb. 2016.
[31] W. Kang, S. Nam, Y. Han, and S. Lee, “Improved heading estimation for smartphone-based indoor positioning systems,” in 2012 IEEE 23rd International Symposium on Personal, Indoor and Mobile Radio Communications - (PIMRC), 2012, pp. 2449–2453.
[32] A. Solin, S. Cortes, E. Rahtu, and J. Kannala, “Inertial Odometry on Handheld Smartphones,” Mar. 2017.
[33] N. Yadav and C. Bleakley, “Accurate orientation estimation using AHRS under conditions of magnetic distortion,” Sensors (Switzerland), vol. 14, no. 11, pp. 20008–20024, Oct. 2014.
[34] OlliW, “OlliW’s Bastelseiten » IMU Data Fusing_ Complementary, Kalman, and Mahony Filter.” pp. 1–18, 2016.
[35] D. Roetenberg, H. J. Luinge, C. T. M. Baten, and P. H. Veltink, “Compensation of magnetic disturbances improves inertial and magnetic sensing of human body segment orientation,”IEEE Trans. Neural Syst. Rehabil. Eng., vol. 13, no. 3, pp. 395–405, Sep. 2005.
[36] R. Mahony, T. Hamel, and J.-M. Pflimlin, “Nonlinear Complementary Filters on the Special Orthogonal Group,” IEEE Trans. Automat. Contr., vol. 53, no. 5, pp. 1203–1218, Jun. 2008.
[37] J. Solà, “Quaternion kinematics for the error-state Kalman filter,” 2017.