1
Numerical Simulation of Electromagnetic Coupling in Explicitly Meshed Wiring
Looms and Bundles
Xuesong Meng
1, Phillip Sewell
1, Ana Vukovic
1, Zhewen Zhang
1, Trevor M. Benson
1*,
Chris Jones
2, Simeon Earl
2, Rebecca Walton
2, Geoff South
21 George Green Institute for Electromagnetics Research, Faculty of Engineering, The University of Nottingham, University Park, Nottingham, NG7 2RD, UK
2 BAE SYSTEMS, Air Systems, Warton, UK * [email protected]
Abstract:In this paper, the Unstructured Transmission Line Modelling (UTLM) method based on a tetrahedral mesh is applied to model the electromagnetic coupling into wire looms and bundles with multiple cores that are typical of an aircraft system, when they are exposed to plane wave illuminations. The impact on the electromagnetic coupling into wires of both bundle configuration and the positioning of the bundle relative to simple structures are investigated using the UTLM method with explicit meshing of the wires. The work not only confirms that UTLM method as a powerful tool for dealing with wire looms and bundles but provides invaluable information on the margins to be expected in key experimental waveform parameters such as peak amplitude and frequency response.
1. Introduction
Cable and wiring looms and bundles are important features of the installation and integration of systems into complex platforms such as aircraft or modern automotive vehicles. Nevertheless, their electromagnetic performance can vary considerably from one particular aircraft or automotive platform to a nominally identical one, depending on the details and variability of the installation. This becomes particularly significant when one considers the collective demands imposed nowadays by a harsher electromagnetic environment, the increased reliance on electronic functionality, and the desire to minimise clearance tolerances. Computational Electromagnetics (CEM) has a significant role to play throughout design, test and qualification and eventual lifetime support phases of complex integrated systems, and adds the capability to understand, analyse, and extrapolate experimental measurements.
In [1] we applied The Unstructured Transmission Line Modelling (UTLM) method [2], [3] to study the coupling between a single wire and a twisted wire pair and compared results against experimental ones to provide independent confirmation of the accuracy of the UTLM simulations; the wire geometries were explicitly meshed. UTLM, a 3D full-wave electromagnetic numerical solver, is deployed on tetrahedral meshes that can have a wide range of sizes. This makes it well suited to the description and simulation of general arbitrarily shaped structures, and especially those involving curved geometry. Managing the computational requirements is a critical aspect of all such simulations and in this context, a particularly powerful feature of UTLM is the ability to group or ‘cluster’ small computational cells into larger cell bodies; this enables a larger time step to be used in the time-domain simulation without compromising accuracy [4]. The excellent agreement obtained in [1] between simulated and experimental results not only validated the viability and accuracy of the UTLM method, but indicated the potential of the UTLM method for modelling complex wire
structures. Therefore, in the present paper the work reported in [1] is extended to the study of long (8 m) wire bundles with multiple wires typical of those found in aircraft systems. The aim is to directly study the impact on electromagnetic coupling into wires of (i) the configuration of the bundle and (ii) the positioning of the bundle relative to simple structures, using an explicit meshing of the wires. In contrast to the present work, the evaluation of the electromagnetic response of a wire (or cable) bundle has hitherto largely been confined to a decoupled, two-stage, process. This has involved an evaluation of the fields along the cable route followed by an evaluation of the coupling to and between the cables [5, 6 and references therein] and includes the approximate multi-conductor transmission line (MTL) approach which consists of sampling an incident field and coupling this with a multi-conductor transmission line network that may itself be non-uniform. It is interesting to note that writing in 2002, and referring to an FDTD-based electromagnetic code, the authors of [5] noted that a direct (i.e. un-approximated) approach enabled the precise bundle description to be taken into account but recognised that ‘Nowadays, such a thing is totally impossible with a 3-D code solving Maxwell’s equations alone. Indeed, the mesh precision required to describe wires inside bundles is too small and cannot be stored in memory. In any case, even if the fastest available computers were used in the future, calculations would always take a prohibitive time.’ It is this restriction that the UTLM approach used in the present paper is able to overcome, facilitated by the clustering of cells, and the demonstration of this fact is regarded as the key purpose of this paper. In the context of ever larger simulation demands, dealing with more complex geometrical features, thus providing a designer with a straightforward method of obtaining useful results using a modest commodity cluster without the need for a priori
simplification is a highly valuable resource.
To summarise the objectives of this work. The evolution of computational power has rendered viable today simulations which were previously impossible. Having
2 previously established the validity and accuracy of the UTLM
approach to this particular class of problems in [1], this contribution demonstrates that the approach can feasibly be used to undertake an industrially relevant and complex study and yields data to permit designers to optimise design configurations. A range of results are presented to permit continued benchmarking of methods as computer power increases.
2. Problem description
The work presented here was undertaken as part of the HITEA project, Innovative Computational Electromagnetics and Novel Integration Technologies (ICENITE) [7]. The industry-led project aims at first understanding, and then optimising, the electromagnetic performance of cables and wires in bundles used in large platforms such as aeroplanes, vehicles and ships, so as to be able to restructure these bundles to minimise variations in their electromagnetic performance within different application scenarios. The canonical test cases presented in this paper were selected by a consortium of experts drawn from the HITEA project. They enable the effect on the coupling of an external electromagnetic field into the wires of a loom or bundle to be studied within a systematic framework, allowing for typical variations in the proximity of the bundle to the airframe and the number of wires within the bundle.
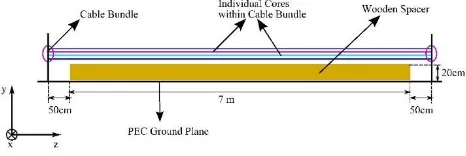
As in Figure 1, an 8-m long multicore wire bundle is placed on top of a wooden spacer positioned at a 20 cm height of a PEC ground plane. Each core in the bundle is a single core copper wire with the diameter of 2 mm. The wooden spacer is modelled as a medium with relative permittivity of 4. All cores in the bundle are terminated with a short circuit. A plane wave excites the whole problem; here the plane wave is polarised in the y direction and propagates in the x direction, i.e. orthogonal to the wire, as considered in a previous seminal paper [8]. The excitation is specified within the UTLM software in the form of a pulsed time function whose Fourier-transformed frequency spectrum is engineered to cover the frequency range 1MHz to 400 MHz. In the present paper, the impact of the wire position in the bundle on the coupling is discussed separately for wire bundles with different number of cores, i.e. one core wire bundles, three core wire bundles and ten core wire bundles. In this way information can be built up in a systematic way of the ‘worst case’ ensemble behaviour, and hence the safety margins that need to be applied when extrapolating experimental Electromagnetic Compatibility (EMC) test data towards eventual certification. Whilst in the present paper only single and multiple wire configurations are studied there is no
reason why using UTLM this could not be generalised to more general bundle configurations in the future; the description ‘wire bundle’ is thus used throughout.
[image:2.595.314.547.485.563.2]According to the configuration shown in Figure 1, the geometrical model was built using our University of Nottingham (UoN) software. For example, Figure 2 shows the geometrical model of a three core wire bundle on top of the wooden spacer and the PEC ground plane and surrounded by matched boundaries. The cable bundles are connected to the small metal plates shown in Figure 2; the short circuiting is realized by connecting the ends of the wires to the metal plates shown. The geometrical model was meshed using our UoN mesher software that produces a high-quality, multi-scale, tetrahedral mesh. The discretised model was solved using our UoN solver software, which has been experimentally validated for modelling the coupling between parallel wires and twisted wires as in [1]. Clustering [4] is used in UTLM to group the small cells together to increase the time step and is automatically applied when meshing structures in the UTLM software. The solver is fully parallelised and is run on a standard commodity cluster comprising 8-core Sandy Bridge CPUs, deployed in pairs on nodes which communicate via Infiniband interconnects. Each node has 40GB of available RAM and 39 nodes were used for the simulations presented below. The maximum mesh criterion was set at a mesh volume of 1 x 10⁻⁵ m3 which is sufficiently small to more than satisfy the usual ‘one-tenth smallest wavelength’ minimum dimension criterion for convergence at the maximum frequency of present interest, 400MHz. ((One-tenth wavelength at 400MHz)3 ~ 4.2 x 10⁻⁴ m3). Whilst this mesh volume is the smallest that can be used on such a large problem on our commodity cluster computer platform, numerical experiments with two larger mesh volumes ( 5 x 10⁻⁵ m3 and 1 x 10⁻⁴ m3) confirmed that the mesh size chosen was indeed sufficiently small to ensure numerical convergence for all simulation results presented.
Figure 1. A wire bundle placed on top of a wooden spacer and a PEC ground plane
.
Figure 2. The geometrical model of a three core wire bundle on top of a wooden spacer and a PEC ground plane built using our UoN software.
[image:2.595.50.541.633.749.2]3 3. Single core wire bundles
[image:3.595.43.247.58.224.2] [image:3.595.44.286.516.757.2] [image:3.595.311.550.534.748.2]The induced current in the wire for single core wire bundles is evaluated first. Six different wire bundles are considered, whose cross sections are shown in Figure 3. All wires considered in this paper are bare, i.e. not insulated, but we have tested that a wire coating in practice has little effect on the induced currents presented. Whilst this statement holds true for the type of common mode excitation considered (global EM field illumination), the influence of the dielectric coating would be expected to be larger if the source terms applied on each wire were different. The core has different positions for these six bundles. Figure 3 (a) shows the wire bundle 1 with its core at the centre of the bundle and r = 2 cm. Figure 3 (b) shows the wire bundle 2 with its core positioned at a distance of r/2 from the centre. Based on the core position in Figure 3 (b), the core is rotated by 45, 90, 135 and 180 degrees, which forms the wire bundle 3, 4, 5 and 6, shown in Figure 3 (c), (d), (e) and (f), respectively. This allows us to explore the impact of wire position in the bundle on the electromagnetic coupling into the wires.
The induced currents at the left end of the wires were calculated based on the observation of the magnetic fields along a circle surrounding the wire. The calculated current in the time domain is then transformed to the frequency domain
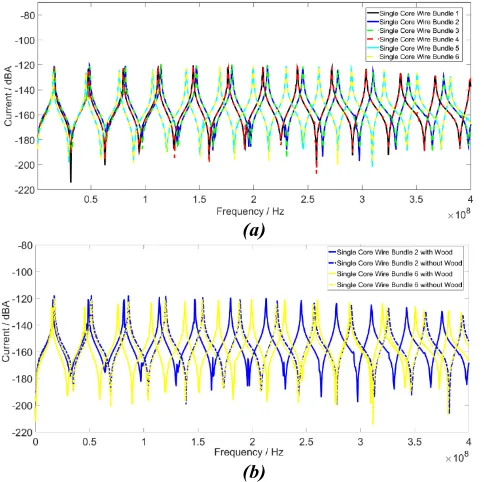
by using a Fast Fourier Transform (FFT). The induced currents for each wire bundle upon the plane wave excitation in the frequency range from 1 MHz to 400 MHz, as shown in Figure 4(a). The frequency range selected is typical of aircraft EMC test and covers the frequencies at which typical cable systems are likely to experience resonance effects. The incident electric field strength is 1 V m-1 corresponding to an incident power density of around 2.7 mW m-2; the small values of induced current observed is as expected because of the orthogonal orientation of the plane wave polarisation to the wires on which current is induced.
From Figure 4(a), it can be seen that the position of the wire affects the resonant frequencies of the induced current in the wire, but has little effect on the amplitude of the induced current in the wire. A shift can be observed between the resonance frequencies on the various wires which is seen to increase with frequency. Whilst this is perhaps at first sight surprising if one contemplates transverse electromagnetic propagation in a simple wire above an infinite ground plane, it is a consequence of the complex practical scenario studied which includes the wooden spacer. In order to investigate this further the induced currents on two of the wires, wire bundles 2 and 6, were simulated without the wooden spacer present; simulated induced currents with and without the spacer are compared in Figure 4(b). It can be seen that when the wood spacer is not present the shift in resonance frequency observed in Figure 4(a) no longer occurs. In Sections 4 and 5 wire bundles with 3 and 10 cores are studied; raw data and particular observations are discussed in each section. Observations made in each of Sections 3-5 are discussed in the broader context of the importance of simulation and systems test margins in the Conclusions.
4. Three core wire bundles
In this section, three core wire bundles are modelled and the induced current in the wires for ten sets of different wire bundles are studied upon plane wave excitation. This case explores the influence on the shielding of a wire of its position in the bundle.
Figure 5 shows the cross sections of ten sets of three-core wire bundles with their three-cores in different positions
(a) Bundle 1 (b) Bundle 2 (c) Bundle 3
(d) Bundle 4 (e) Bundle 5 (f) Bundle 6
Figure 3. The cross section of six wire bundles with single core
(a)
(b)
Figure 4. (a) The currents induced on the left end of the wires for six wire bundles upon plane wave
illumination. (b) Induced currents at the left end of wire
Figure 5. The cross section of ten wire bundles with three cores
(a) Bundle 1 (b) Bundle 2 (c) Bundle 3 (d) Bundle 4
(e) Bundle 5 (f) Bundle 6 (g) Bundle 7
(j) Bundle 10
(h) Bundle 8
4 within the bundle. Figure 5 (a) shows the wire bundle 1 with
wire 1 in the centre, wire 2 on the right top of wire 1 1.05 cm, and wire 3 on the right bottom of wire 1 1.05 cm. Figure 5 (b), (c), (d) and (e) shows the wire bundle 2, 3, 4 and 5, which are formed by rotating the wire bundle 1 by 45, 90, 135 and 180 degrees, respectivly. Figure 5 (f) shows the wire bundle 6 with wire 1 in the centre, wire 2 on the right top of wire 1 1 cm, and wire 3 on the right bottom of wire 1 1.2 cm. Figure 5 (g), (h), (i) and (j) shows wire bundle 7, 8, 9 and 10, which are formed by rotating the wire bundle 6 by 45, 90, 135 and 180 degrees, respectively.
The current induced in each wire of the ten wire bundles upon the plane wave excitation is calculated separately. Figure 6 shows the induced current, at the left end, in three wires of the wire bundle 1 upon the plane wave excitation. It can be seen that the currents in the three wires have similar behaviour, but the amplitude of the current in the centre wire (wire 1) is relatively lower.
Figure 7 compares the induced current in the single core bundle 1 (Figure 3 (a)) and the centre wire of the three-core wire bundle 1 (Figure 5 (a)). The two wires have the
same position in the bundle, but in the second case, the wire is surrounded by another two wires. It can be seen that the amplitude of the current for the second case is lower than that for the first case, which shows that the top and bottom wires in the three-core wire bundle provide certain shielding effects to the centre wire. It is also noted that the resonant frequencies in the current are split for the centre wire of the three-core wire bundle 1.
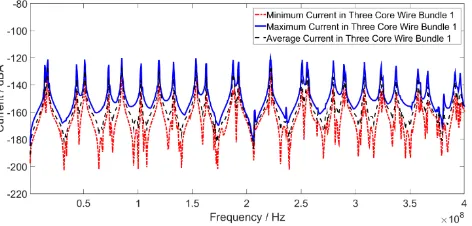
Figure 6 shows only one set of results, the induced current in the wires for the wire bundle 1. There are actually ten sets of such results. In order to analyse the results and find the effects of wire position on the coupling, the maximum current, the minimum current and the average current are calculated for each bundle based on the induced current in the three wires. Figure 8 shows the calculated maximum current, average current and minimum current at the left end of the three-core wire bundle 1.
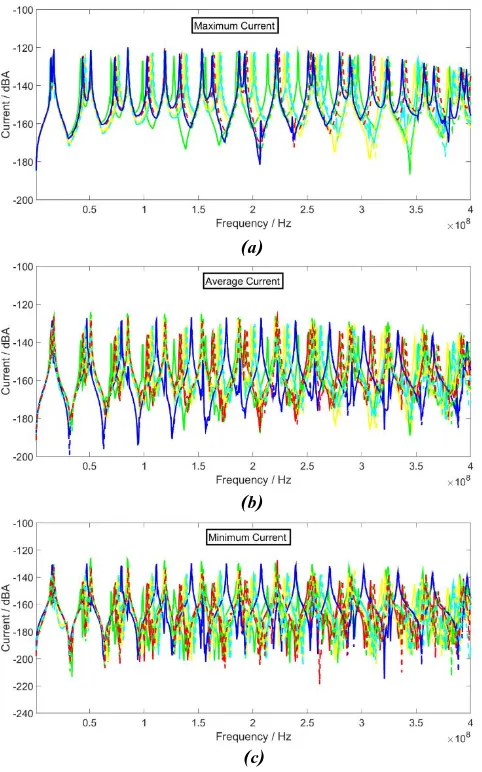
Figure 9 (a) plots the maximum current at the left end of the bundle for the ten sets of wire bundles with three cores as shown in Figure 5. It can be seen that the position of wires affects the resonant frequencies of the maximum current in the bundle. The same effects are also observed for the average current and minimum current in the bundle, as shown in Figure 9 (b) and (c) respectively. In the figures, we do not intend to show the legends of each line due to the large number of lines; what is important is the ensemble behaviour. The computational resources needed for one simulation, i.e. simulating the wire bundle 1, are shown in Table 1. The whole problem is meshed using a tetrahedral mesh.
Table 1
Mesh Run
Time* No. of Tetrahedrons
Mesh File Size 13 mins 1,169,196 613,877 Kb
Solver Time
Step
No. of Time Steps
Run Time*
Output File Size** 0.42 ps 4,000,000 82.8 hrs 45.7 Mb
* The run time is based on using a standard commodity cluster comprising 8-core Sandy Bridge CPUs, deployed in pairs on nodes which communicate via InfiniBand interconnects. Each node has 40GB of available RAM and 39 nodes were used for the simulations presented.
** The output file is referred to the file storing the observed current in one wire.
5. Ten core wire bundles
In this section, ten core wire bundles upon the plane wave excitation are modelled and the induced current in the wires for ten sets of different wire bundles are studied.
[image:4.595.46.285.308.420.2]Figure 10 shows the cross section of ten sets of wire bundles with ten cores. For wire bundle 1 as shown in Figure 10 (a), the wire separation between any two neighbouring wires is 7 mm. Wire bundles 2, 3, 4 and 5 are formed by rotating the wire bundle 1 by 45, 90, 135 and 180 degrees, respectively. The wire positions in wire bundle 6 are described in Table2. Wire bundles 7, 8, 9 and 10 are formed by rotating the wire bundle 6 by 45, 90, 135 and 180 degrees, respectively.
[image:4.595.311.542.406.510.2]Figure 7. Comparison of the current induced at the left end for the single core wire bundle 1 and the centre wire of the three-core wire bundle 1.
[image:4.595.49.289.461.573.2]Figure 8. The maximum current, the average current and the minimum current at the left end of the three-core wire bundle 1 shown in Figure 5. (a).
Figure 6. The induced current at the left end of the wires for the three-core wire bundle 1 shown in Figure 5 (a).
[image:4.595.52.288.630.743.2]5 Figure 11 shows the induced current at the left end of
ten wires of the wire bundle 1 (Figure 10 (a)) upon the plane wave excitation. It can be seen that the currents in the ten wires have similar behaviour, but the amplitude of the current in wire 6 is relatively lower.
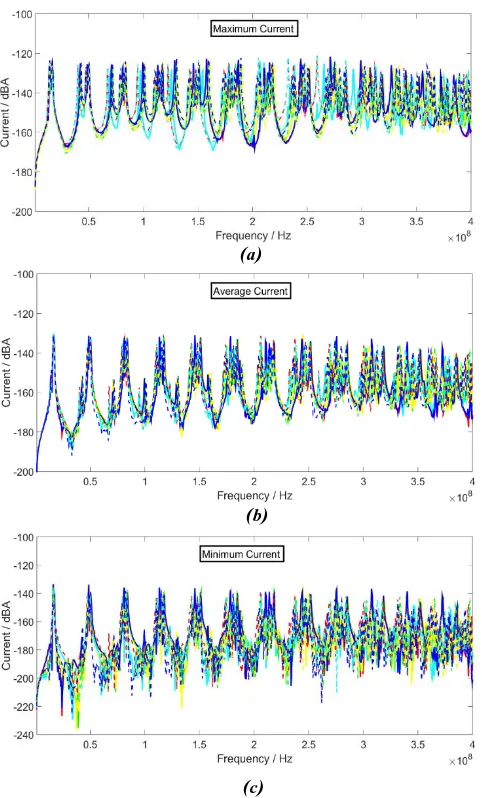
Ten sets of similar results as in Figure 11 are available, one for each of the ten sets of wire bundles shown in Figure 10. Based on these results, the maximum, average and minimum current for each bundle were calculated. Figure 12 (a), (b) and (c) plot the maximum, average and minimum current in the bundle for ten bundles, respectively. It can be seen that the resonant frequencies in the current are affected by the positons of wires in the bundle, especially for higher frequencies. Again the legends of lines are not intended to be shown in the figures due to the large number of lines in the figures as the ensemble behaviour is of most interest.
6. Conclusion
The Unstructured Transmission Line Modelling (UTLM) method has been successfully applied to model the coupling into wire bundles when exposed to plane wave illuminations with direct meshing of the wires. Canonical test cases from the HITEA ICENITE project, with bundles containing one, three and ten wires, have been modelled and analysed. The impacts of bundle configurations and wire positions around the simple structure have been given in terms of the induced currents on the wires. For the simple configurations studied in the present paper the presence of more than one wire shields wires placed in the centre of the bundle. However, when working with more than one wire the number of wires does not have major influence on the overall systems performance margins defined using the amplitude of the maximum current in the bundle, nor does the detailed position of the wires in the bundle. The work shows that the UTLM method is a powerful and very useful tool for studying wire looms and bundles without resorting to a decoupling of the incident field and coupling-into-wire processes. UTLM has the potential to deal with more complex wire looms and bundle geometries, including those with twisting and otherwise non-uniform sections and bundles also containing
Coordinates Wire 1 Wire 2 Wire 3 Wire 4 Wire 5 Wire 6 Wire 7 Wire 8 Wire 9 Wire 10
X / cm 0 0 0 0 0 -0.5 0.6 -1.0 1.2 -0.8
Y / cm 0 1.0 -1.2 0.5 -0.6 0 0 0 0 -0.8
(a)
(b)
[image:5.595.49.290.57.443.2](c)
Figure 9. Frequency dependence of: (a) The maximum current at the left end of the bundle for the ten wire bundle configurations, each with three cores as shown in Figure 5, (b) The average current at the left end of the bundle for the ten wire bundle configurations with three cores as shown in Figure 5, (c) The minimum current at the left end of the bundle for the ten wire bundle configurations with three cores as shown in Figure 5.
(a) Bundle 1 (b) Bundle 2 (c) Bundle 3 (d) Bundle 4
(e) Bundle 5 (f) Bundle 6 (g) Bundle 7 (h) Bundle 8
[image:5.595.308.549.67.271.2](i) Bundle 9 (j) Bundle 10
Figure 10The cross section of ten wire bundles with ten cores
Figure 11 The current at the left end of the wires for the ten-core wire bundle 1 as shown in Figure 10 (a).
[image:5.595.307.549.317.436.2]6 cables.Of course particular results may be available by other
methods. For instance, the configuration studied in the present paper could have been addressed with a two-step approach (field-to-transmission line) no doubt with similar success, at least at low frequencies (before the two of three first resonances). There is a good chance that a MTL approach would give very similar results for this specific configuration with parallel bare wires; the presence of the wooden spacer could even have been included in the model. However, at high frequency when the radiation impedance of the line is needed (which results from the reaction of the induced current with the field), or for non-uniform transmission-line geometrical configurations, it is well know that the MTL model has limitations (as for all the geometrical configurations sentence mentioned above). The value of the work presented in this paper is that results are obtained by a method that can be expanded to include substantial amounts of complex environmental geometry; we thus regard this paper as a marker in the literature that such a threshold has been achieved. Specifically, the present UTLM-based simulation work could be readily extended to future studies of wire bundles that are not parallel to structures, bundles in
which the wires are not parallel to each, wire bundles which lie in the proximity of non-planar, non-metallic, structures such as those made from carbon fibre reinforced plastics, and installed antenna structures where the mutual coupling between the antenna elements and the platform on which they are mounted needs to be accurately accounted for.
7. Acknowledgments
The work outlined above was carried out as part of the ICE-NITE Project (see http://www.liv.ac.uk/icenite/), supported by Innovate UK under contract reference 101665. The project consortium included BAE SYSTEMS Limited (coordinator), Bombardier, Horiba MIRA Limited, ITI Limited and the Universities of Liverpool and Nottingham.
8. References
[1] Meng, X., Sewell, P., Vukovic, A., Benson, T.:
‘Experimental benchmarking of Unstructured Transmission Line Modelling (UTLM) method in modelling twisted wires’, ACES Express Journal, 2016, 1, (3), pp. 101-104
[2] Sewell, P., Wykes, J., Benson, T., Christopoulos, C., Thomas, D. Vukovic A.: ‘Transmission-line modeling using unstructured triangular meshes’, IEEE Trans. on Microwave Theory and Techniques, 2004, 52, (5), pp. 1490-1497
[3] Sewell, P., Benson, T., Christopoulos, C., Thomas, D. W. P., Vukovic, A., Wykes J.G.: ‘Transmission Line Modeling (TLM) based upon unstructured tetrahedral meshes’, IEEE Trans. On Microwave Theory and Techniques, 2005, 53, (6), pp. 1919-1928
[4] Sewell, P., Benson, T., Christopoulos, C., Thomas, D. W. P., Vukovic, A., Wykes J.G.: ‘Implicit element clustering for tetrahedral Transmission Line Modeling (TLM),’ IEEE Trans. on Microwave Theory and Techniques, 2009, 57, (8), pp. 2005- 2014
[5] Paletta, L., Parmantier, J., Issac, F., Dumas, P., Alliot, J.: ‘Susceptibility analysis of wiring in a complex system combining a 3-D solver and a Transmission-Line network simulation’, IEEE Transactions on Electromagnetic Compatibility, 2002, 44, (2), pp. 309-317
[6] Arianos, S., Francavilla, M. A., Righero, M., Vipiana, F., Savi, P., Bertuol, S., Ridel, M., Parmantier, J., Pisu, L., Bozzetti, M., Vecchi, G.: ‘Evaluation of the modeling of an EM illumination on an aircraft cable harness’, IEEE Transactions on Electromagnetic Compatibility, 2014, 56, (4), pp. 844-852
[7] ‘ICENITE Project’,
https://www.liverpool.ac.uk/icenite/about/, accessed 01 12
2016
[image:6.595.48.289.55.454.2][8] Harrison, C.W. ‘Generalized theory of impedance loaded multiconductor transmission lines in an incident field’, IEEE Transactions on Electromagnetic Compatibility, 1972, 1, 56-63.
Figure 12 Frequency dependence of (a) The maximum current in the bundle, (b) The average current in the bundle, (c) The minimum current in the bundle, all for the ten wire bundle configurations with ten cores shown in Figure 10.
(a)
(b)
(c)