ISSN Online: 2153-1188 ISSN Print: 2153-117X
DOI: 10.4236/msa.2019.1012053 Nov. 29, 2019 733 Materials Sciences and Applications
Effect of Ti
4+
Doping on Structural,
Electrical and Magnetic Properties
of Ni
0.4
Cu
0.2
Zn
0.4
Fe
2
−
x
Ti
x
O
4
Ferrites
Sajal Chandra Mazumdar
1*, Farhad Alam
2, Umma Habiba Tanni
1, Kamrunnahar Kali
1,
Bablu Chandra Das
3, Mohammed Nazrul Islam Khan
41Department of Physics, Comilla University, Cumilla, Bangladesh
2Department of Physical Sciences, School of Engineering and Computer Science, Independent University,
Dhaka, Bangladesh
3Departments of Physics, Bangladesh University of Engineering and Technology, Dhaka, Bangladesh
4Materials Science Division, Atomic Energy Centre, Dhaka, Bangladesh
Abstract
Ti4+ doped Ni0.4Cu0.2Zn0.4Fe2−xTixO4 (x = 0.0, 0.02, 0.05, 0.07, 0.10) chemical
compositions are prepared by conventional solid state reaction technique. The ferrite phase formation has been confirmed from the pattern of XRD. The theoretical density (ρth), bulk density (ρB), and porosity are calculated
from the XRD data and using approximate formulas. Value of ρth is found to
be greater than the value of ρB indicating the formation of pores inside the
bulk specimens. The micro-structural investigation has been done using Field Emission Scanning Electron Microscope and it is found that the average grain size reduces with the increase of Ti content. Saturation magnetization (Ms)
also reduces with the increase of Ti content, contrarily remanent magnetiza-tion (Mr) and coercivity (Hc) increases with the concentration of Ti in the
composition due to the pinning effect. The real part of the initial permeability is found to be maximum for the x = 0.02 sample which could be due to the homogeneity and high density of the sample. For increasing frequency, the dielectric constant and dielectric loss are observed to decrease.
Keywords
Ferrite, X-Ray Diffraction, VSM, SEM, Dielectric Properties, Magnetization
1. Introduction
Polycrystalline Nickel-Copper-Zinc ferrite is a semi-conducting material that How to cite this paper: Mazumdar, S.C.,
Alam, F., Tanni, U.H., Kali, K., Das, B.C. and Khan, M.N.I. (2019) Effect of Ti4+ Doping on Structural, Electrical and Mag-netic Properties of Ni0.4Cu0.2Zn0.4Fe2−xTixO4 Ferrites. Materials Sciences and Applica-tions, 10, 733-745.
https://doi.org/10.4236/msa.2019.1012053
Received: October 24, 2019 Accepted: November 26, 2019 Published: November 29, 2019
Copyright © 2019 by author(s) and Scientific Research Publishing Inc. This work is licensed under the Creative Commons Attribution International License (CC BY 4.0).
DOI: 10.4236/msa.2019.1012053 734 Materials Sciences and Applications possesses high eddy current losses and high electrical resistivity, and shows skin effect. Metal doped Nickel-Copper-Zinc ferrites are very important for their wide applications in technology. They can be used as inductors, particularly as Multilayer Chip Inductor (MLCI), transformer core, recording heads and sto-rage devices and in diagnosis purposes [1] [2] [3]. They are also attractive in re-search and technology for their high magnetic permeability, low magnetic losses, lower cost and easy manufacturing process and for superior magnetization properties [4] [5].
Mixed metal oxides with iron (Fe3+) oxide with the general formula MFe 2O4
are known as Ferrites. They exhibit spinel structure and hence are also named as spinel ferrites. It is non-conducting ferromagnetic ceramic composites obtained from hematite (Fe2O3) or magnetite (Fe3O4) and oxides of other transition
met-als. Such ceramics are fragile and strong. Ferrites are technically very important because they exhibit spontaneous magnetization below the Curie temperature. There is a continuous interest on development of ferrites with excellent electrical and magnetic properties due to their potential applications. Actually the size, shape and structure of the material determine these properties [6]. General for-mula to represent a binary oxide spinel is A1-xBx[AxB2−x]O4; here x is called
de-gree of inversion. For x = 0, it’s a normal spinel, whereas for x = 1 it’s an inverse spinel. A physical property of the ferrite depends on cation distribution on the sites, doping, and particle size and also on the method of preparation of the composition of the ferrite [7] [8] [9]. Nature of the dopant can also influence the ultimate magnetic and electrical characteristics [10] [11]. Ionic radius and va-liancy of the substituted ion also affect the alteration of these magnetic proper-ties along with its site of preference [12] [13] [14]. Ti doped Ni-Cu-Zn ferrites are quite important in the field of microwave industry which is a mixture of NiFe2O4, ZnFe2O4, CuFe2O4 with long range ferromagnetic ordering. Rathi etal. [15] investigated the stuctrural, electric and magnetic properties of Ti doped Ni-Cu-Zn ferrite. The dielectric constants are found to vary as a function of fre-quency and composition at room temperature. It is observed that with the in-crease in the concentration of Ti4+ ions, the dielectric constant increases. On the
other hand the saturation magnetization decreases with the increasing concen-tration of Ti4+ ions. Fe3+ is replaced by Ti4+ in Ni
0.4Cu0.2Zn0.4Fe2−xTixO4, Ti4+ ions
preferentially occupy the octahedral site and the Fe3+ ions are displaced to the
tetrahedral sites. In this paper, synthesis of Ni0.4Cu0.2Zn0.4Fe2−xTixO4 (x = 0.0,
0.02, 0.05, 0.07, 0.10) by conventional solid state reaction technique and the ef-fect of Ti substitution on structural, morphological, electrical and magnetic properties of Ni-Cu-Zn ferrites have been discussed.
2. Experimental Procedure
2.1. Synthesis
Solid state reaction technique is assumed to synthesis Ti4+ substituted Ni-Cu-Zn
ferrites of stoichiometric compositions Ni0.4Cu0.2Zn0.4Fe2−xTixO4 (x = 0.0, 0.02,
DOI: 10.4236/msa.2019.1012053 735 Materials Sciences and Applications Fe2O3 are used as raw materials for the preparation of Ni-Cu-Zn ferrites. The
constituent components in required stoichiometric proportions are weighted and the weighted powders are mixed mechanically by milling to decrease the particle size of the powders to the micron range. For this preparation, mortar and pestle are used for milling operation and each sample was milled for 6 hours. The resulting powder is calcined at 800˚C for 4 hours and grounded into fine powder by milling for 2 hours. Grounded powder is then used in X-ray dif-fractometer for XRD for phase identification, Scanning Electron Microscope (SEM) for micro-structural investigation and Vibrating Sample Magnetometer (VSM) for magnetic properties measurement. For the investigation of dielectric properties, the powders are then pressed into disc and toroid shaped sample at a pressure of 10 - 15 KN/m2. These disc and toroid are sintered at 1200˚C for 4
hours.
2.2. Measurements Technique
XRD was performed using PHILIPS PW 3040 X-ray diffractometer with Cu-Kα radiation in the range 5˚ to 70˚. Lattice parameter (a0), theoretical density (ρth),
porosity (P), bulk density (ρB) were calculated for all the samples using the
fol-lowing Equations (1)-(5) and were tabulated in Table 1 [16].
2 2
2 2 2
hkl
a d
h k l
=
+ + (For cubic spinel) (1)
( )
1(
2) (
2)
cos sin cos
2
F θ = θ θ + θ θ (2)
3 0 8 th A M N a
ρ = g/cm3 (3)
( ) (
% x B)
100% xP ρ ρ
ρ
−
= × (4)
2 π B
m r t
ρ = (5)
where h, k and l represent the crystal plane’s Miller indices, NA denotes the
number of Avogadro, M means molecular weight, a0 is the lattice constant of
[image:3.595.211.538.610.731.2]spinel structure, m equal mass, r indicates radius and t signifies the pellet or ring thickness [16].
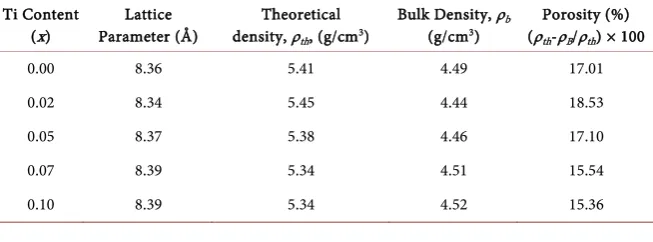
Table 1. The structural parameters of Ni0.4Cu0.2Zn0.4Fe2−xTixO4 ferrites. Ti Content
(x) Parameter (Å) Lattice density, ρTheoretical th, (g/cm3)
Bulk Density, ρb
(g/cm3) (ρPorosity (%) th-ρB/ρth) × 100
0.00 8.36 5.41 4.49 17.01
0.02 8.34 5.45 4.44 18.53
0.05 8.37 5.38 4.46 17.10
0.07 8.39 5.34 4.51 15.54
DOI: 10.4236/msa.2019.1012053 736 Materials Sciences and Applications The grain structures of the sample were visualized under Field Emission Scanning Electron Microscope (FESEM). Measurement of the magnetic hystere-sis loop and the magnetic properties of the materials were performed using a Vibrating Sample Magnetometer (VSM) within a range of 10 kOe (1 Tesla). For dielectric tests, etched, well-polished pellets were used. For good electrical con-tact, silver paste had been used on both sides of the samples. Wayne Kerr Im-pedance Analyzer is used to carry dielectric measurements at room temperature in the frequency ranged 1 kHz to 100 kHz. The variation of dielectric properties (dielectric constant, dielectric loss) and magnetic properties (magnetic loss, rela-tive quality factor, resistivity) for all the samples were measured and calculated using the following Equations (6)-(9) [2] [3].
Dielectric constant,
0
C C
ε ′ = (6)
Dielectric loss, tan E
ε δ
ε
′′ =
′ (7)
RQF, RQF
tan E
ε δ ′
= (8)
Resistivity, RA
l
ρ= (9)
where, C is the capacitance of the samples and C0 is the capacitance of the
capa-citor without the dielectric materials and C0=ε0A l, 0 is the permittivity of
the free space and A = πr2 is the area of the cross section of the pellet shaped
sample, R is the resistance of the sample, l is the thickness of the pellets and A is the surface area.
The measurement of complex permeability of the ring shaped samples was performed at room temperature in the frequency range from 1 KHz to 100 MHz using the following formulas,
Real part, 0 s i L L
µ′ = (10)
Imaginary part,
tan
i i M
µ′′=µ′ δ (11)
where, LS is the inductance of the sample and
2 0 o N S L d µ π
= and that is derived
from geometric of the samples, L0 is the inductance of the winding coil except
the sample, N represents the number of turns of the coil (N = 5), S indicates the cross sectional area of the ring shaped samples as given below,
S
= ×
d h
(12)And
2 1
2
d d
d= − (13)
where, d1 is the inner diameter and d2 is the outer diameter, h represents the
DOI: 10.4236/msa.2019.1012053 737 Materials Sciences and Applications and can be written as,
1 2
2
d d
d = + (14)
Then Equation (10) can be written as
2 2 0
1
2 i
S
L d
d d
N h
π µ
µ ′ =
−
(15)
3. Results and Discussion
3.1. Phase and Density Analysis
X-ray diffraction pattern of Ni0.4Cu0.2Zn0.4Fe2−xTixO4 (x = 0.0, 0.02, 0.05, 0.07,
0.10) ferrite is shown in Figure 1. In XRD patter, from the reflected peaks it is clear that the samples are of crystalline cubic spine structure. Having differences in the ionic radius of Ti4+ (0.68 Å) with that of Fe3+ (0.64 Å), there is an
increas-ing trend of lattice parameter a0 of the lattice with increase in Ti4+ concentration.
The increase in lattice parameter could be ascribed to Ti4+ ions can be located at
the boundaries of grain [16]. That’s why it hinders the growth of grain and in-creases the rinsing of grains and the tips to increase the lattice parameter.
Figure 2 shows that lattice parameter increases with the Ti content except x = 0.02. It has been observed by Mali etal. that the rise of the crystallite size with the substitution of Ti4+ is attributed to the substituting of Ti4+ (0.68 Å) at Fe3+
(0.64 Å) site [17].
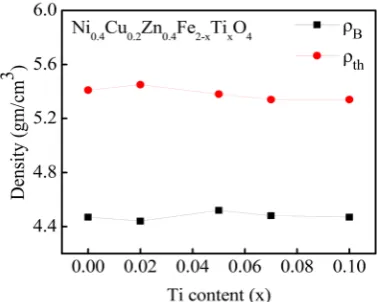
Figure 3 illustrates the variation of bulk and theoretical densities of Ni0.4Cu0.2Zn0.4Fe2−xTixO4 (x = 0.0, 0.02, 0.05, 0.07, 0.10). From this figure it is
ob-served that theoretical density of these samples reduces almost linearly with the concentration of Ti except for x = 0.02. Theoretical density decreases because the atomic mass of Ti (47.867 g/mol) is less than that of Fe (55.845 g/mol). And for x = 0.02, the theoretical density rises because in this case the lattice constant (a0)
decreases. From Figure 3, it has also been noted that bulk density of these sam-ples rises linearly with the concentration of Ti except for x = 0.02 and x = 0.05. It is obvious that theoretical density is higher than bulk density, this variation is explained in the way that when the samples were sintered, they may contain crack and microscopic pores and lattice vacancies on the atomic scale [18]. But theoretical density which is precisely measured from lattice parameter and unit cell volume of the sample is free from these defects.
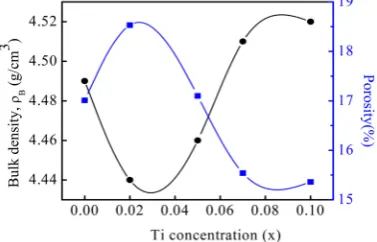
Figure 4 represents the variant of the porosity and bulk density (ρB) with the
concentration of Ti. The variant of ρB with the concentration of Ti might be
DOI: 10.4236/msa.2019.1012053 738 Materials Sciences and Applications and x = 0.10 is due to the compact microstructure of the samples. It is evident from Figure 4, that the ρB and porosity show the opposite behavior to each
other. The structural parameters of Ni0.4Cu0.2Zn0.4Fe2−xTixO4 ferrites have been
[image:6.595.279.465.147.299.2]presented in Table 1.
Figure 1. XRD pattern of Ni0.4Cu0.2Zn0.4Fe2−xTixO4
[image:6.595.278.470.346.490.2]ferrites.
Figure 2. Variation of lattice parameter depending on the concentration of Ti.
[image:6.595.279.468.537.688.2]DOI: 10.4236/msa.2019.1012053 739 Materials Sciences and Applications
Figure 4. Variation of porosity and bulk density as a function of Ti content.
3.2. Particle Size Analysis
Scanning Electron Microscopy of Ni0.4Cu0.2Zn0.4Fe2−xTixO4 (x = 0.0, 0.02, 0.05,
0.07, 0.10) compositions with 5000× magnification are shown in Figure 5. Micro structural images of Ni-Cu-Zn-Ti ferrite samples are taken for morphological study, so that an insight of grain structures can be seen. The average grain size (D) of the samples is estimated using a linear intercept technique [20]. Value of D reduces with the increase in concentration of Ti except for x = 0.02 and de-creases from 18.89 μm to 10.85 μm (for x = 0.02 the grain size is 19.76 μm). Pores at grain boundary becomes very less when the grain size is smaller. The addition of Ti content might have suppressed the growth of grain boundary. Hence, the D reduces with the increase in concentration of Ti. Decrease in D could also be due to a decrease in oxygen vacancy [21].
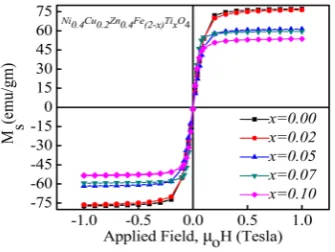
3.3. Hysteresis Loops
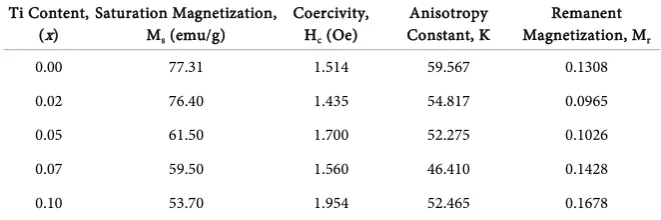
Hysteresis loops (M-H) of different ferrite samples are shown in Figure 6. Satu-ration magnetizations (Ms), Coercivity (Hc), Anisotropy constant (K) and
Re-manent magnetization (Mr) of Ni0.4Cu0.2Zn0.4Fe2−xTixO4 are measured and
tabu-lated in Table 2. From Table 2 we see that the samples have low Hc and high Ms
that enable them to be used as soft magnetic materials. From Table 2, it’s also noted that, though the (Ms) is decreased with the concentration of Ti but
coer-civity (Hc) is increased except for x = 0.02 i.e.; there is an inverse relationship
between Ms and Hc as shown in Figure 7.
It could be concluded that value of coercivity rises with the rising concentra-tion of Ti except for x = 0.02 due to the enough defects or porosity in the sample. Moreover, as can be seen clearly in Figure 8 that anisotropy K reduces with in-crease in Ti concentration due to decreasing grain size which is evident from SEM images.
3.4. Magnetic Permeability
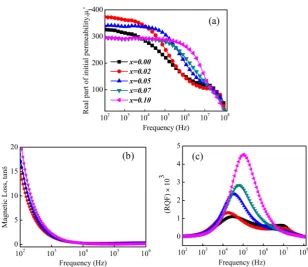
Figure 9(a), Figure 9(b) and Figure 9(c) illustrate the frequency dependency of initial permeability (μi), relative quality factor (RQF), magnetic loss tangent
DOI: 10.4236/msa.2019.1012053 740 Materials Sciences and Applications the permeability increases with Ti substitution of x = 0.02 and x = 0.05 and it reduces for x = 0.07 and x = 0.10. The µi of a ferrite depends on average grain
[image:8.595.234.512.139.523.2]size, intra-granular porosity, domain walls bulging and reversible domain walls displacement etc. [22].
Figure 5. Scanning electron microscope images of Ni0.4Cu0.2Zn0.4Fe2−xTixO4
for x = 0.00 to 0.10, respectively.
Figure 6. M-H loop of Ni0.4Cu0.2Zn0.4Fe2−xTixO4, ferrite for x = 0.0, x
[image:8.595.291.459.568.694.2]DOI: 10.4236/msa.2019.1012053 741 Materials Sciences and Applications
[image:9.595.287.463.238.377.2]Figure 7. Variation of Ms and Hc with Ti content.
Figure 8. Variation of anisotropy constant (K) with the concentration of Ti.
Figure 9 (a) Variation of µi′ with frequency; (b) Magnetic loss tangent (tanδ) with
[image:9.595.218.527.419.686.2]DOI: 10.4236/msa.2019.1012053 742 Materials Sciences and Applications
Table 2. Saturation magnetization, coercivity, anisotropy constant and remanent magne-tization of Ni0.4Cu0.2Zn0.4Fe2−xTixO4 (x = 0.0, 0.02, 0.05, 0.07, 0.10).
Ti Content,
(x) Saturation Magnetization, Ms (emu/g)
Coercivity, Hc (Oe)
Anisotropy
Constant, K Magnetization, MRemanent r
0.00 77.31 1.514 59.567 0.1308
0.02 76.40 1.435 54.817 0.0965
0.05 61.50 1.700 52.275 0.1026
0.07 59.50 1.560 46.410 0.1428
0.10 53.70 1.954 52.465 0.1678
Figure 9(b) illustrates the frequency dependency of magnetic loss (tanδ). The tanδ value declines with frequency, approaching the minimum value, and then becomes almost static. The reason behind the reduction of tanδ with rising fre-quency may be above a certain frefre-quency of applied external electric field; the motion of the domain wall may not match the external electric field. Figure 9(c) shows the variation in relative quality factor (RQF) with frequency. It is revealed that RQF rises with the increase of frequency and after a certain frequency RQF slightly decreases with frequency increase. In fact RQF has the maximum value at that frequency level where the magnetic loss tangent has the minimum value.
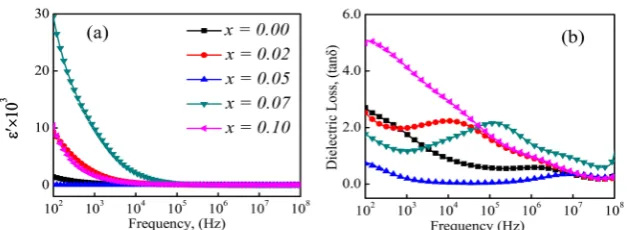
3.5. Dielectric Properties
Figure 10(a) shows the variation of dielectric constants with frequency range 1 kHz to100 MHz at room temperature. From that figure, it is evident that the di-electric constant decreases with increasing frequency at higher frequencies easily reaching constant value. The variance shows the dispersion due to interfacial polarization of the form Maxwell-Wagner [23] [24] that is confirmed by the phenomenological theory of Koop [25]. The Koop’s phenomenological theory explains the higher dielectric constant values observed at lower frequencies. It may happen owing to the majority of the class of similar Fe2+ ions, oxygen
va-cancy, interfacial disruption pile-ups and grain boundary imperfection, etc. Due to the fact that any species paying for polarizability is bound to show the sheathing behind the applied field at higher frequencies, the dielectric constant is reduced with frequency.
Figure 10(b) indicates the frequency dependence of the dielectric loss tangent (tanδ) at room temperature. Dielectric loss decreases as the frequency increases. The tanδ decreases significantly with increasing frequency for each ferrite com-position and becomes flat. If the frequency of the externally applied ac electric field at neighboring octahedral sites is much lower than the rate of hopping elec-trons between Fe2+ and Fe3+ ions, the electrons will obey the field and the loss is
therefore maximum. The rate of hopping of the electron exchange between Fe2+
and Fe3+ ions at higher frequencies of the applied electric field cannot match the
DOI: 10.4236/msa.2019.1012053 743 Materials Sciences and Applications
Figure 10. (a) Real part of dielectric constant as a function of frequency; (b) Dielec-tric Loss (tanδ) as a function of frequency.
and again increases with higher concentration this may be due to the presence of impurity in the samples although no unreacted component is seen in XRD phase identification. The values of dielectric loss may be subject to content ratio, availability of Fe2+ and Fe3+ content and mechanical stability of the composition
and preparation technique.
4. Conclusion
In the current research, Ni0.4Cu0.2Zn0.4Fe2−xTixO4 (x = 0.0, 0.02, 0.05, 0.07, 0.10) is
confirmed by the solid state combustion method XRD patterns as the synthe-sized powder exhibiting spinel cubic structure. Increase of lattice constant with Ti content for x = 0.0, x = 0.05, x = 0.07 & x = 0.10 is justified by the fact that in-dicates that the ionic radii of Ti is greater than that of Fe that is why lattice spacing increases for replacing Fe3+ (0.64 Å) by Ti4+ (0.74 Å). It is clearly visible
that the theoretical density of these samples reduces linearly with the concentra-tion of Ti except for x = 0.02. The theoretical density decreases because the atomic mass of Ti (47.867 g/mol) is less than that of Fe (55.845 g/mol). And for x = 0.02, the X-ray density increases because in this case the lattice constant (a) decreases. The bulk density decreases initially for x = 0.02 and x = 0.05 is due to these two samples the microstructure contains intergranular porosity and in-crease of bulk density for x = 0.07 and x = 0.10 is due to the compact micro-structure of the samples. The increase and decrease of permeability could be ex-plained with regard to porosity. The samples with larger porosity have smaller initial permeability. Saturation magnetization decreases with the concentration of Ti4+; this might be due to lesser magnetic moment of Ti than that of Fe3+. The
frequency dependent dielectric constant does not follow particular growth or decay for the increase in Ti4+ content may be due to the presence of some
im-purity point although it is unrevealed. Such observed values of magnetic para-meters might make the present ferrites very useful for magnetic resonance im-agining (MRI), antibacterial, catalyst and magnetic sensors. Hence Ti4+ doped
Ni-Cu-Zn ferrites can be used for data storage and biomedical applications.
Conflicts of Interest
DOI: 10.4236/msa.2019.1012053 744 Materials Sciences and Applications
References
[1] Praveena, K., Sadhana, K., Bharadwaj, S. and Murthy, S.R. (2009) Development of
Nanocrystalline Mn-Zn Ferrites for High Frequency Transformer Applications.
Journal of Magnetism and Magnetic Materials, 321, 2433-2437.
https://doi.org/10.1016/j.jmmm.2009.02.138
[2] Praveena, K., Sadhana, K. and Murthy, S.R. (2012) Elastic Behavior of Microwave
Hydro-Thermally Synthesized Nanocrystalline Mn1-xZnx Ferrites. Materials
Re-search Bulletin, 47, 1096-1103.https://doi.org/10.1016/j.materresbull.2011.11.054
[3] Praveena, K. and Murthy, S.R. (2013) Magneto Acoustical Emission in
Nanocrystal-line Mn-Zn Ferrites. Materials Research Bulletin, 48, 4826-4833.
https://doi.org/10.1016/j.materresbull.2013.08.042
[4] Reddy, M.P., Kim, I.G., Yoo, D.S., Madhuri, W., Reddy, N.R., Kumar, K.V.S. and.
Reddy, R.R.K. (2012) Characterization and Electromagnetic Studies on Nizn and
Nicuzn Ferrites Prepared by Microwave Sintering Technique. Materials Sciences
and Applications, 3, 628-632.https://doi.org/10.4236/msa.2012.39091
[5] Bacchav, S.G., Patil, R.S., Ahirrao, P.B., Patil, A.M. and Patil, D.R. (2011)
Micro-structure and Magnetic Studies of Mg-Ni-Zn-Cu Ferrite. Materials Chemistry and
Physics, 129, 1104-1109.https://doi.org/10.1016/j.matchemphys.2011.05.067
[6] Hosseinpour-Mashkani, S.M., Maddahfar, M. and Sobhani-Nasab, A. (2016) Novel
Silver-Doped CdMoO4: Synthesis, Characterization, and Its Photocatalytic
Perfor-mance for Methyl Orange Degradation through the Sonochemical Method. Journal
of Materials Science: Materials in Electronics, 27, 474-480.
https://doi.org/10.1007/s10854-015-3776-7
[7] Singh, A.K., Srivastava, O.N. and Singh, K. (2017) Shape and Size-Dependent
Mag-netic Properties of Fe3O4 Nanoparticals Synthesized Using Piperidine. Nanoscale
Research Letter, 12, 298.https://doi.org/10.1186/s11671-017-2039-3
[8] Gyergyek, S., Makovec, D., Iztok Arcon, A.K., Jagodic, M. and Drofenik, M. (2010)
Influence of Synthesis Method on Structural and Magnetic Properties of Cobalt Ferrite Nanoparticles. Journal of Nanoparticle Research, 12, 1263-1273.
https://doi.org/10.1007/s11051-009-9833-5
[9] Aakash, R.C., Das, D. and Mukherjee, S. (2016) Effect of Doping of Manganese Ions
on the Structural and Magnetic Properties of Nickel Ferrite. Journal of Alloys and Compounds, 668, 33-39. https://doi.org/10.1016/j.jallcom.2016.01.198
[10] Chakrabarty, S., Dutta, A. and Pal, M. (2015) Enhanced Magnetic Properties of
Doped Cobalt Ferrite Nanoparticles by Virtue of Cation Distribution. Journal of
Alloys and Compounds, 625, 216-223.https://doi.org/10.1016/j.jallcom.2014.10.179
[11] Rezlescu, N., Rezlescu, L., Popa, P.D. and Rezlescu, E. (2000) Influence of Additives
on the Properties of a Ni-Zn Ferrite with Low Curie Point. Journal of Magnetism
and Magnetic Materials, 215-216, 194-196. https://doi.org/10.1016/S0304-8853(00)00114-1
[12] Mahalakshmi, S., Srinivasa, M.K. and Nithiyanantham, S. (2014) Electrical
Proper-ties of Nanophase Ferrite Doped with Rare Earth Ions. Journal of Superconductivity Novel Magnetism, 27, 2083-2088.https://doi.org/10.1007/s10948-014-2551-y
[13] Bharathi, K.K. and Ramana, C.V. (2011) Improved Electrical and Dielectric
Proper-ties of La-Doped Co Ferrite. Journal of Materials Research, 26, 584-591.
https://doi.org/10.1557/jmr.2010.37
[14] Heiba, Z.K., Mohamed, M.B., Arda, L. and Dogan, N. (2015) Cation Distribution
DOI: 10.4236/msa.2019.1012053 745 Materials Sciences and Applications
Nickel Ferrite. Journal of Magnetism and Magnetic Materials, 391,195-202.
https://doi.org/10.1016/j.jmmm.2015.05.003
[15] Rathi, R. and Neogi, R., (2016). Structural, Electric and Magnetic Properties of Tita-nium Doped Ni-Cu-Zn Ferrite. Materials Today: Proceedings, 3, 2437-2442.
https://doi.org/10.1016/j.matpr.2016.04.159
[16] Pandit, A.A., Shitre, A.R., Shengule, D.R. and Jadhav K.M. (2005) Magnetic and
Di-electric Properties of Mg1+xMnxFe2-2xO4 Ferrite System. Journal of Materials Science,
40, 423-428.https://doi.org/10.1007/s10853-005-6099-x
[17] Mali, A. and Ataie, A. (2005) Influence of Fe/Ba Molar Ratio on the Characteristics
of Ba-Hexaferrite Particles Prepared by Sol-Gel Combustion Method. Journal of
Alloys and Compounds, 399, 245-250.https://doi.org/10.1016/j.jallcom.2005.03.017
[18] Cullity, B.D. and Stock, S.R. (2001) Elements of X-Ray Diffraction. 3rd Edition, Prentice, Hall, Englewood Cliffs, NJ, 169.
[19] Valenzuela, R. (1994) Magnetic Ceramics. Cambridge University Press, Cambridge,
5.https://doi.org/10.1017/CBO9780511600296
[20] Ahmed, F.U., Yunus, S.M., Kamal, I., Datta, T.K., Azad, A.K. and Asgar, M.A. (1998) Neutron Diffraction Study of ZnxNi1-xFe2O4 (x = 0.25 and 0.85) Ferrite.
Nuc-lear Science and Applications, 7.
[21] Brinkman, K., Iijima, T., Nishida, K., Katoda, K. and Funakubo, H. (2007) The
In-fluence of Acceptor Doping on the Structure and Electrical Properties of Sol-Gel Derived BiFeO3 Thin Films. Ferroelectrics, 357, 35-40.
https://doi.org/10.1080/00150190701527597
[22] Smit, J. and Wijn, H.P.J. (1959) Ferrites. Philips Technical Library, Eindhoven, 150.
[23] Maxwell, K.C. (1873) Electricity and Magnetism. Oxford University Press, London,
328.
[24] Wagner, K. W. (1913) Zur Theorie der Unvollkommenen Dielektrika. Annalen der
Physik, 40, 817-855.https://doi.org/10.1002/andp.19133450502
[25] Koops, C.G. (1951) On the Dispersion of Resistivity and Dielectric Constant of
Some Semiconductors at Audiofrequencies. PhysicsReview, 83, 121.
https://doi.org/10.1103/PhysRev.83.121
[26] Murthy, V.R.K. and Shobanadri, J. (1976) Dielectric Properties of Some Nickel-Zinc Ferrites at Radio Frequency. Physica Status Solidi A, 36, K133-K135.