http://www.scirp.org/journal/ijcns ISSN Online: 1913-3723
ISSN Print: 1913-3715
MPSO Algorithm Based QoS Parameter
Optimization for LTE Networks
F. L. Zhao1, G. T. Chen2
1China Mobile Group Fujian Co., Ltd., Fuzhou, China
2School of Electronics and Information, Fuqing Branch of Fujian Normal University, Fuzhou, China
Abstract
QoS Optimization is an important part of LTE SON, but not yet defined in the specification. We discuss modeling the problem of QoS optimization, improve the fitness function, then provide an algorithm based on MPSO to search the optimal QoS parameter value set for LTE networks. Simulation results show that the algorithm converges more quickly and more accurately than the GA which can be applied in LTE SON.
Keywords
LTE, Self-Organizing Networks (SON), Quality of Services (QoS), Genetic Algorithm (GA), Multi-Level Particle Swarm Optimization (MPSO)
1. Introduction
Spectral efficiency has been greatly improved in LTE networks, but it still cannot carry the explosive growth of service data volume. Faced with this situation, the mobile communication operators decide to cancel “unlimited package”, and launch “traffic management” to improve the revenue per bit. Differentiated transmission and charging is the only way to achieve the operators’ goal, in which 3GPP QoS Framework and its associated technologies played an impor-tant role. The QoS related contents occupy a lot of spaces in 3GPP specification [1] [2], which is a key feature in LTE [3]. The optimization of QoS is to find the optimal parameter set for radio resource management (RRM) which can max-imize network spectral efficiency when customer experiences are met.
Related researches had become a hot topic in this field. Because of the impor-tance of QoS optimization, NGMN Alliance clearly stated in the requirements to realize the QoS self-optimization [4]. Furthermore, SOCRATES projection [5] and E3 projection [6] that were initiated by the major equipment manufacturers, How to cite this paper: Zhao, F.L. and
Chen, G.T. (2017) MPSO Algorithm Based QoS Parameter Optimization for LTE Networks. Int. J. Communications, Net-work and System Sciences, 10, 1-13. https://doi.org/10.4236/ijcns.2017.105B001
although some progress had been made, no realizable methods had been re-ported so far as we know. In addition, reference [7] applied genetic approach (GA) to QoS optimization for WCDMA mobile networks, which provided a good reference, but this method was not related with SON. Specially, GA cannot make full use of priori knowledge, and the output is always unstable, so it is not suitable to be applied in LTE SON.
The contribution of this paper is presentation of a multi- level discrete particle swarm optimization (MPSO) combined with GA and BPSO (Binary Particle Swarm Optimization), which performs well in terms of accuracy, speed of con-vergence and moderate computation complexity. The algorithm is expected to be applied in LTE SON QoS optimization. The paper is organized as follows: Section 2 addresses the problem and some conceptions, Section 3 provides the algorithm and realization, Section 4 is simulation and analysis, and Section 5 concludes the paper.
2. Problem Description
2.1. Problem Description
The main functionality of SON includes: self-planning, self-configuration, self-maintenance and self-optimization, one of self-optimization features is QoS related parameter optimization (E.g., admission control, congestion control and packet scheduling parameter optimization) [4]. NGMN require QoS Optimiza-tion to support packet based QoS, which embraces both service based QoS and user profile ToS (Tier of Service) concept in one robust solution [4].
3GPP provided a complete QoS framework, and defined the conception of bearer and the process of standardized signaling, but didn’t state how QoS pa-rameter be used in the RRM entity. Many literature [8] [9] have pointed out that packet scheduler in MAC layer determine how resources were allocated, so it was the key to system performances such as throughput, delay, loss rate and fairness. based on [10] scheduling algorithm, we will explore how to get a op-timal QoS parameter set according to service characteristic and traffic mix, which can make the system work perfectly, that is to say, spectral efficiency is maximized and the ratio of satisfied users is above the threshold.
2.2. QoS Parameters
stage. To non-GBR bearer, the AMBR includes APN-AMBR and UE-AMBR. These AMBR values are defined separately for uplink and downlink, but we will not distinguish these four AMBR values in later sections. For more details about QoS parameters, see [11].
2.3. User Satisfaction
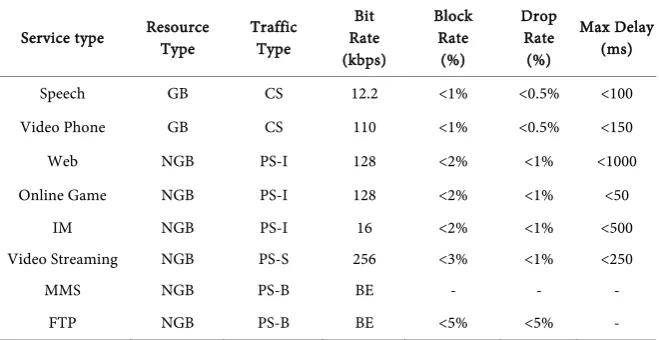
The same level performance of two services will bring different experience to user, which is related to service characteristic. For all services, no block and no drop of the bears is required. The differences in the degree of satisfaction are primarily due to the integrity of the services. The interactive services are real- time traffic that cannot exceed the tolerable delay. The data services must have high bit rate and low bit error ratio, or else packet cannot be recovered in appli-cation layer. In this paper, the bearer will be dropped if the bit error ratio (BER) passes the allowed limit. As for MMS and P2P, these services run quietly in the background beyond intuitive perception, to simplify, always are satisfied.
Service satisfaction ratio is defined as the ratio of satisfied user of that service. A service is satisfied or not can be judged by a target threshold (90%), that is, if the percentage is greater than 90%, the service is suitable be provided. If all the services in a cell are all above their thresholds, we call the cell is satisfied.
2.4. Spectral Efficiency
The spectral efficiency is defined as cell throughput normalized with respect to the bandwidth (bps/Hz). According to the definition, the optimization problem can be modeled as:
( ) 1 1 1 1 ( ) 1 max
max(( ( ) ( ) ( ) ( )) ( ))
max(( ( ) ( )) ( ))
. . ( ) ( ) ( ) ,1
( ) 1 0 ST i N ij i j N RB RB i N RB RB i ST i ij j ij Thp BW
T i A i S i NRB i Thp M BW
P i NRB i Thp M BW
s t SU i ST i TS i i N
SU i a
Satisfied a Unsatisfied = = = = = = ∗ ∗ ∗ ∗ = ∗ ∗ ∗ ≥ ≤ ≤ = =
∑ ∑
∑
∑
∑
, , (1)target performance threshold. Obviously, the spectral efficiency is related with network technology (TM, MCS and SINR), services (traffic mix and characteris-tic) and user satisfaction.
3. Algorithm Realization
3.1. Algorithm Description
Because of the limited number of parameters and the finite set size of all values, the optimal solution can be found by employing the enumeration method. It is clear that the efficiency is every low.
Discrete particle swarm optimization (DPSO) is a newly emerging method for swarm intelligence optimization [12]. DPSO has many advantages such as im-plicit parallelism, global solution space search ability and the final solution in-dependent of the initial value. But DPSO is easy to fall into the premature, and the precision of solutions sometime is low. The operation of selection, crossover and mutation in GA can maintain the diversity of the population, which has the better global search capability. The combination of these two algorithms will get all these advantages-more accuracy and more stable solution. Based on binary code mode, we provide an improved MPSO algorithm to solve the single-objec- tive combination problem.
3.2. Algorithm Realization
1) Problem coding
The position of the i-th particle is described by vector Xi, the d-th element Xid of the vector represents a value of QoS parameter i (shown in Table 1), the vec-tor magnitude is equal to the number of QoS parameters. Then, the speed and position of particle can be updated by the following two formulas:
1 1
2 2
( 1) ( ) ( ( ))
( ( ))
id id id id
gd id
V t wV t c r P X t
c r P X t
+ = + −
+ − (2)
_ , ( 1) ( ( 1)) / ( 1) ( ( 1))
_ , ( 1) ( ( 1)) / ( 1) ( ) ( ( 1)) /
( 1)
_ 1, ( 1) ( ( 1)) /
id id id
id id id
id
id id
Value M M sigmoid V t M r t sigmoid V t
Value i M i sigmoid V t M r t M i sigmoid V t M X t
Value r t sigmoid V t M
− ⋅ + ≤ + < +
− − ⋅ + ≤ + < − ⋅ +
+ =
+ < +
(3)
where w is the inertia weight, which value is decreased during a run, that is
1 2 2
( ) MAXITER iter
w w w w
MAXITER
−
= − ⋅ + , w1 = 0.9, w2 = 0.4 [13]. At the beginning,
the swarm of particles fly over a larger area to find approximate position quickly, as w decreasing from 0.9 to 0.4 linearly, the velocity of particle will slow down, then the swam can converge to a small area, until they find the optimal posi-tions. c1 and c2 are two constants, generally are set as 2. r1 and r2 are random values in the interval [0, 1]. Pid and Pgd denote the d-th dimension local best po-sition of the i-th particle and the d-th dimension global best popo-sition of all the particles respectively. MAXITER is the maximum number of iteration.
Table 1. The main service satisfaction requirement.
Service type Resource Type Traffic Type Rate Bit (kbps) Block Rate (%) Drop Rate (%) Max Delay (ms)
Speech GB CS 12.2 <1% <0.5% <100 Video Phone GB CS 110 <1% <0.5% <150 Web NGB PS-I 128 <2% <1% <1000 Online Game NGB PS-I 128 <2% <1% <50
IM NGB PS-I 16 <2% <1% <500 Video Streaming NGB PS-S 256 <3% <1% <250
MMS NGB PS-B BE - - -
FTP NGB PS-B BE <5% <5% -
of value set is not the same. We use non-homogeneous multi-level coding mode to code the position, as shown in Formula (3), where the value space of function sigmoid(V) = 1/(1 + exp(−V)) is divided into M = |Φd| equal segments. In the t-th iteration, element Xid take the k-th element φdk from collection Φd (φdk∈Φd) if random value fall in the k-th interval.
2) Fitness Function
The fitness of each particle represents the quality of its position. Utilizing the optimization technique, the swarm will converge to optimal positions with the best fitness value. As you know, the spectral efficiency maximum must accord with the fitness function inflection points.
We can model N kinds of services taking place in a cell as N Bernoulli Expe-riments, each experiments is repeated ST(i) trails, the probability of a success on each trial is TS(i), and the number of successful trials is SU(i). The random va-riable Xi = {0, 1, 2,∙∙∙, ST(i)} will follow the binomial distribution with parameters ST(i) and TS(i), we write Xi ~ B(ST(i), TS(i)). The probability of getting exactly SU(i) successes in ST(i) trials can be calculated as:
( ) ( ) ( ) ( )
( )
( ( )) SU i SU i(1 )ST i SU i
i ST i
P X =SU i =C p −p − (4)
So, the fitness function can be defined as a variable based on z-test statistics which reflects the difference between the mean of population and the mean of sample, where z-test statistics are expressed as:
( ) ( ) ( ) ( )
( ) (1 ( ))
( ) SU i
TS i
X ST i
Z i
n TS i TS i
ST i µ σ − − = =
⋅ − (5)
In reference [7], the fitness function is implied as: { 1,..., }min
{ }
( )i N
Fitness Z i
=
= − ,
which does not include the factor of the number of RB used by the services. If the worst performing service needs the least of RB, the total number of active RB
1
( ) ( )
N
i
P i NRB i =
∗
is not the maximum. We can revise it as:
{ 1,..., } 1
1
min ( ( ) ( ))
N
i N i
Fitness NRB i Z i
M
= =
= − ⋅
∑
(6)The fitness function is a statistic that yields positive or negative values if the cell is under load or overload in the sense of the target set for the ratio. To get stable results, the number of trail should be sufficiently high, As refer to [14], the binomial distribution requires that np and n(1-p) is greater than or equal to 5. It implies that ST(i) ≥ 50 with TS(i) = 90%.
3) Realization Procedure
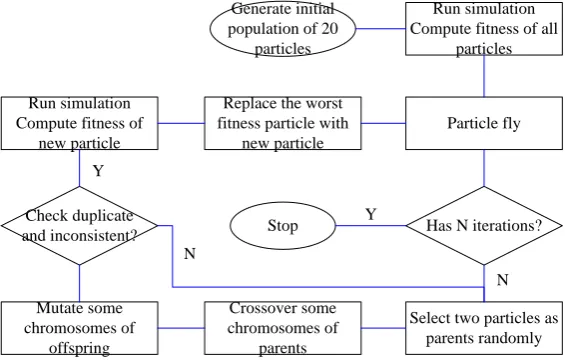
Figure 1 shows the structure of the searching process, including the outer loop based on MPSO algorithm to find the optional QoS parameters setting quickly, the inner loop based on the QoS aware scheduler and the Monte-Carlo approach to simulate the services transmitted through the network, to collect the numbers of total users and satisfied users for each service type and to calculate the fitness for parameter values related.
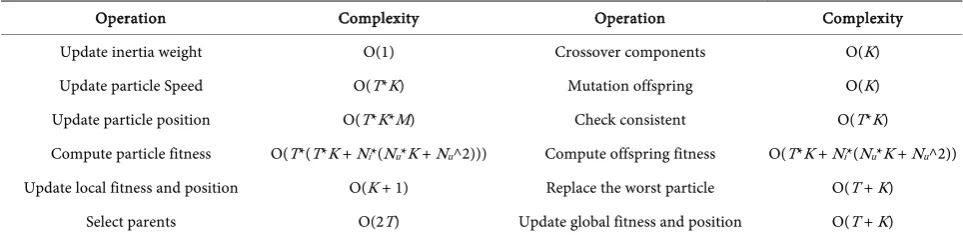
3.3. Computation Complexity Analysis
Assuming the number of iterations is N, the size of the swarm of particles is T, the number of QoS parameters is K, the size of value space of every parameter is M. In the i-th iteration, some action need to accomplish such as: updating the inertia weight; calculating the fitness value and updating the K-dimensional speed and position of each particle; selecting two parents with the best fitness values, crossing the components of two parents and gener-ating the offspring with mutation; examining the particle for duplicate or inconsistence; calculating the new particle’s fitness value and replacing the worst particle; updating the global best fitness value and position. The computation complexities of these operations are shown in the Table 2.
Thus, the overall complexity of the algorithm is O(N*T*(T*K + Ni*(Nu*K + Nu^2))), where Ni*(Nu*K + Nu^2) is the complexity of fitness computation, Ni is
Figure 1. Simulation flow chart.
Run simulation Compute fitness of all
particles
Particle fly
Has N iterations?
Select two particles as parents randomly Crossover some
chromosomes of parents Mutate some
chromosomes of offspring Check duplicate
and inconsistent? Stop
Generate initial population of 20
particles
Run simulation Compute fitness of
new particle
Replace the worst fitness particle with
new particle
Y
N
[image:6.595.232.516.535.715.2]Table 2. Computation complexity.
Operation Complexity Operation Complexity
Update inertia weight O(1) Crossover components O(K) Update particle Speed O(T*K) Mutation offspring O(K) Update particle position O(T*K*M) Check consistent O(T*K)
Compute particle fitness O(T*(T*K + Ni*(Nu*K + Nu^2))) Compute offspring fitness O(T*K + Ni*(Nu*K + Nu^2))
Update local fitness and position O(K + 1) Replace the worst particle O(T + K) Select parents O(2T) Update global fitness and position O(T + K)
the number of iterations, Nu is the total number of users served. Because of Nu >> K, Nu >> T, the complexity can be reduced to O(N*T*Ni*Nu^2) and the value is about O(10^13) in this paper.
4. Simulation and Analysis
4.1. Simulation Parameter
In this section, an advanced dynamic system-level simulator is used to conduct the study for a DL network with a regular hexagonal layout. The cluster is con-sists of 19 sites (57 cells) and a wrap-around technique is adopted to build a borderless network by copying and shifting the cluster. The users with 3km/h moving speed are distributed in the homogeneously network that all cells have uniform traffic. Some important parameters and the detail of scheduler can refer to [10] [15] respectively. There are 8 services provided in the system which sta-tistical character can be found in [16]. Table 3 shows the load and mixture of each service.
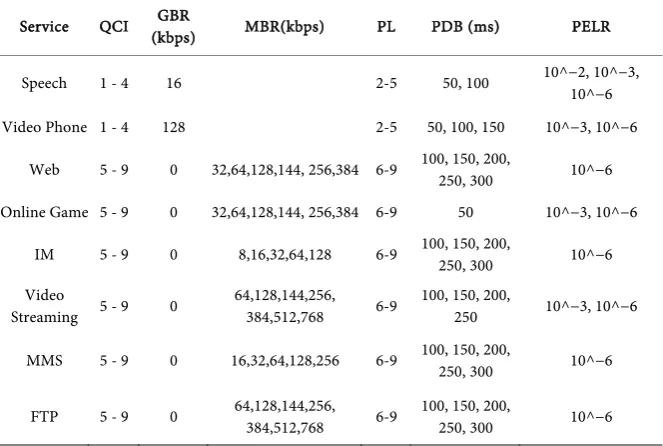
According to the QoS requirements provided in Table 1 and 3GPP EPS QoS guarantee mechanism, the ranges of the QoS parameters and their mapping onto 8 services are list in Table 4.
4.2. Simulation Process
Table 3. The load and mixture of each service.
Serive subscription Share of (%)
Duration time(s)
Arrival interval (h)
Equivalent volumn
(mErl)
Offered load (kB/h)
Traffic mixes (%) Speech 100 90 0.25 100.00 594 9.73%
Video Phone 3 120 6 5.56 275 4.50%
Web 30 600 0.5 333.33 1200 19.66%
Online Game 5 1200 3 111.11 400 6.55%
IM 30 1 0.0028 100.00 90 1.47%
Video Streaming 10 600 5 33.33 1536 25.16%
MMS 10 10 2 1.39 10 0.16%
FTP 20 180 1 50.00 2000 32.76%
Table 4. QoS parameter and value set.
Service QCI (kbps) GBR MBR(kbps) PL PDB (ms) PELR
Speech 1 - 4 16 2-5 50, 100 10^−2, 10^−3, 10^−6
Video Phone 1 - 4 128 2-5 50, 100, 150 10^−3, 10^−6
Web 5 - 9 0 32,64,128,144, 256,384 6-9 100, 150, 200, 250, 300 10^−6
Online Game 5 - 9 0 32,64,128,144, 256,384 6-9 50 10^−3, 10^−6
IM 5 - 9 0 8,16,32,64,128 6-9 100, 150, 200, 250, 300 10^−6 Video
Streaming 5 - 9 0 64,128,144,256, 384,512,768 6-9 100, 150, 200, 250 10^−3, 10^−6
MMS 5 - 9 0 16,32,64,128,256 6-9 100, 150, 200, 250, 300 10^−6
FTP 5 - 9 0 64,128,144,256, 384,512,768 6-9 100, 150, 200, 250, 300 10^−6
and low delay, so it is easy to be harmed. Web has a high portion of volume in the system and it is a real-time traffic, so it has more noticeable influence of the performance of the system than other services.
In the above simulation process trace, we can see all call and session are gen-erated following a Poisson process and according to the given traffic mix. Each connection is associated with a certain service which is mapped onto a corres-ponding QoS parameter setting. The packet scheduler performs well at the MAC layer which is controlled by the parameters such as RT, PL, PDB, PELR and GBR. As expected, the simulator can be used for the optimizing and analyzing of the QoS parameters.
4.3. Algorithm Performance Comparison
[image:8.595.207.539.292.515.2](a)
[image:9.595.231.515.71.549.2](b)
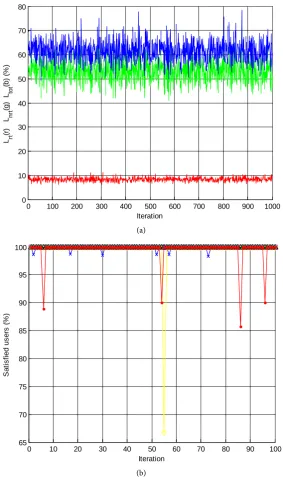
Figure 2. A snapshot of simulation process. (a) Load status in a cell during the last 1000 snapshot; (b) Percentage of satisfied users as a function of the iteration number.
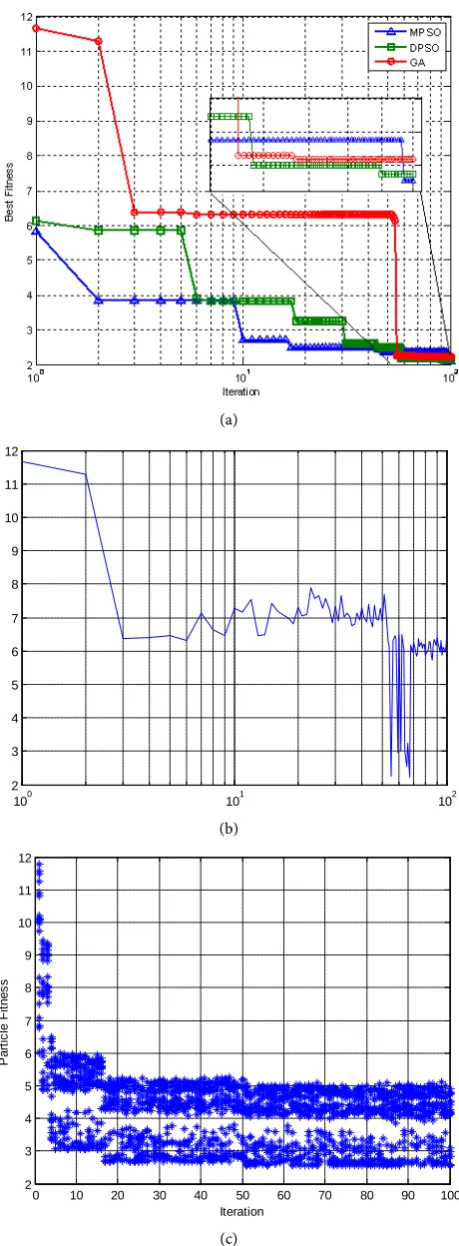
rithm, the algorithm 2 is ordinary particle swarm optimization algorithm, and the algorithm 3 is MPSO combined with the merits of GA and DPSO. Figure 3 shows the comparison of different algorithm in the term of accuracy and speed of convergence.
Figure 3(a) shows that MPSO has quicker speed of convergence and higher accuracy than GA and DPSO. The improvement of the fitness function was neg-lectable after 18, 32 and 56 iterations corresponding to MPSO, DPSO and GA., respectively. After that, the optimization process could have been stopped and the fitness functions at this point were 2.10, 2.14 and 2.23, respectively. It meant
0 100 200 300 400 500 600 700 800 900 1000 0
10 20 30 40 50 60 70 80
Iteration
L rt
(r) L
n
rt
(g
) L
to
t
(b
) (%
)
0 10 20 30 40 50 60 70 80 90 100 65
70 75 80 85 90 95 100
Iteration
S
at
is
fi
ed us
er
s
(
%
(a)
(b)
[image:10.595.258.488.68.692.2](c)
Figure 3. Algorithm performance comparison. (a) Fitness value as a function of the itera-tion number; (b) Fitness value as a funcitera-tion of the iteraitera-tion number for GA; (c) Fitness value of all particles as a function of the iteration number for MPSO.
100 101 102
2 3 4 5 6 7 8 9 10 11 12
0 10 20 30 40 50 60 70 80 90 100
2 3 4 5 6 7 8 9 10 11 12
Iteration
P
ar
ti
c
le F
it
nes
that MPSO achieves 4.00% and 5.76% gain over DPSO and GA, respectively. In addition, there is an important feature that the particle swarm algorithm is more stable than the genetic algorithm. Comparing Figure 3(b) and Figure 3(c), we can notice that the GA may arise “rebound” phenomenon in iteration process because of crossover and mutation operations character with a certain degree of randomness, but it was revealed from Figure 3(c) that the swarm could fly to the best position directionally, however, this improvement had a cost that the computation complexity would go up sharply. After all, the robustness of the optimization process was much more practical to applications.
4.4. Spectral Efficiency Gains
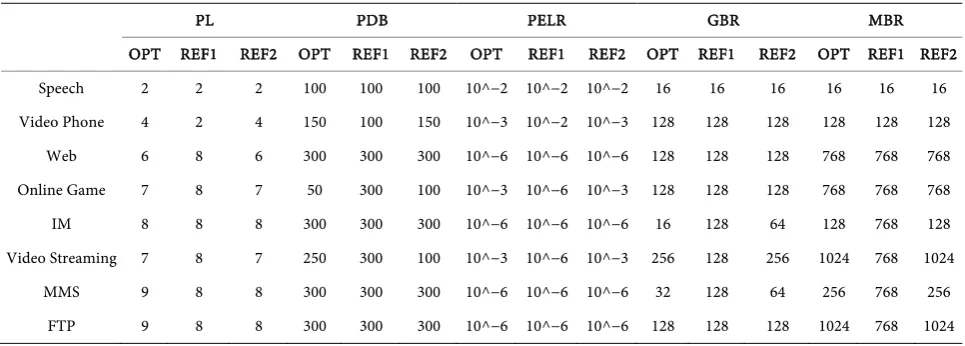
There are 3 QoS parameters setting schemes. The OPT scheme is found by the MPSO algorithm. The REF1 scheme divides all services into GBR class and non- GBR class, every class has its own undifferentiated setting. The REF2 scheme adopts a single fixed differentiated setting. Table 5 reports the parameter values for each of schemes, and the columns are denoted as OPT, REF1 and REF2, re-spectively.
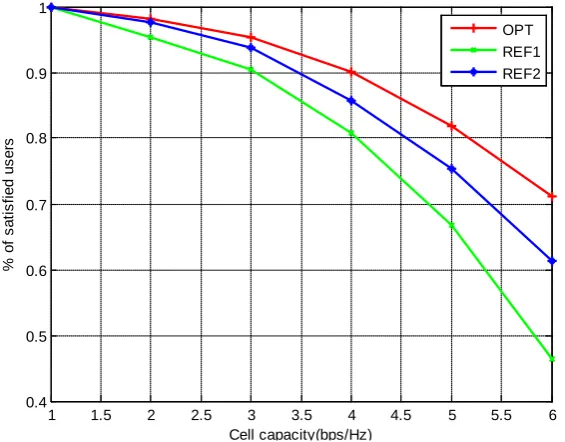
We can increase more load through reducing service mean arrival (A(i)) step by step, log the ratio of users satisfied of the worst forming service using a cer-tain parameter settings. The relationship between the spectral efficiency and user satisfied ratio is exemplified in Figure 4.
[image:11.595.232.515.495.716.2]Figure 4 revels that efficiency gains can be achieved by proper tuning of the QoS parameters and the gain increases with the cell load. The result indicates that its beneficial to adopt the optimal setting. The gain is obtained by improv-ing the user satisfaction of non-GBR services which implies that the perfor-mance of the elastic services is reduced to allow bearing more low priority ser-vices volumes. In this case, the spectral efficiency 2.27bps/Hz corresponds to the ratio.
Figure 4. Spectral efficiency again comparison.
1 1.5 2 2.5 3 3.5 4 4.5 5 5.5 6 0.4
0.5 0.6 0.7 0.8 0.9 1
Cell capacity(bps/Hz)
%
of
s
at
is
fi
ed us
er
s
OPT REF1
Table 5. QoS parameters setting scheme.
PL PDB PELR GBR MBR
OPT REF1 REF2 OPT REF1 REF2 OPT REF1 REF2 OPT REF1 REF2 OPT REF1 REF2 Speech 2 2 2 100 100 100 10^−2 10^−2 10^−2 16 16 16 16 16 16 Video Phone 4 2 4 150 100 150 10^−3 10^−2 10^−3 128 128 128 128 128 128 Web 6 8 6 300 300 300 10^−6 10^−6 10^−6 128 128 128 768 768 768 Online Game 7 8 7 50 300 100 10^−3 10^−6 10^−3 128 128 128 768 768 768 IM 8 8 8 300 300 300 10^−6 10^−6 10^−6 16 128 64 128 768 128 Video Streaming 7 8 7 250 300 100 10^−3 10^−6 10^−3 256 128 256 1024 768 1024
MMS 9 8 8 300 300 300 10^−6 10^−6 10^−6 32 128 64 256 768 256 FTP 9 8 8 300 300 300 10^−6 10^−6 10^−6 128 128 128 1024 768 1024
of satisfied users 90%, 80.82% and 85.63% for respectively OPT, REF1 and REF2 scheme, that is, the gain of spectral efficiency provided by the optimal setting (OPT) with respect to undifferentiated setting (REF1) and fixed differential set-ting (REF2) is 11.51% and 5.24%.
It is worth to point out that the gain of spectral efficiency is not only related to the cell load, but also related to the traffic mix. The optimal setting is specifically for the differential mixture of traffic volumes and the gains have large differenc-es accordingly. In a word, the gain can be achieved obviously when the cell is close to or exceeds the full load and the proportion of high-priority services is not very high (generally not more than 1/3). It also suggested that to adopt di-verse setting with different traffic mix is beneficial. Due to space limitations, not further explored.
5. Conclusion
Taking into account that the real-time optimization for QoS is not necessary (hour granularity to reflect the changes in traffic volumes among different hours), together with the fact a high sufficient number of users is always needed (the granularity may be either neighbor cell cluster or cells connected with the same SGW), a centralized SON framework is advised, and the QoS self- opti-mizing can be realized as following: firstly,eNodeBs collect the measurement
results of traffic type and traffic volumes, then these data is submitted to the EMS, further the EMS searches for the optimal QoS parameter values, in turn, it provides these optimal QoS parameters to eNodeBs involved to complete the process of automatic optimization. Due to the faster speed of convergence and more stable results obtained by the method proposed in this paper than that from other algorithms (GA and DPSO), despite of rather high computation complexity, the method can be realized by the high-performance EMS system with strong computation power.
References
Architecture.
[2] 3GPP TS 36.300 v10.0.0. (2010) Evolved Universal Terrestrial Radio Access Net-work (E-UTRAN); Over- all Description Stage 2 (Release 10).
[3] 3G Americas (2011) Benefits of SON in LTE.
[4] NGMN Requirement Document (2008) NGMN Re- commendations on SON and OAM Requirements.
[5] SOCRATES. Self-Optimisation and Self-Configura- tion in Wireless Networks. https://www.fp7-socrates.eu
[6] E3. End-to End Efficiency: E3 Overview. https://ict-e3.eu/project/overview/overview.html
[7] Soldani, D. and Kimmo, V. (2005) Genetic Approach to QoS Optimization for WCDMA Mobile Networks. IEEE-VTC, 4, 2269-2273.
https://doi.org/10.1109/vetecs.2005.1543739
[8] Rabie, K.A., Mohamed, H.A. and Octavia, A.D. (2010) Performance Analysis of Proportional Fair Scheduling in OFDMA Wireless Systems. IEEE-VTC, 1-5. [9] Fraimis, I.G. and Kotsopoulos, S.A. (2011) QoS-Based Proportional Fair Allocation
Algorithm for OFDMA Wireless Cellular Systems. Communications Letters, IEEE, 15, 1091-1093.
http://doi.org/10.1109/LCOMM.2011.081211.111417
[10] Diaz, I.F., Dimitrova, D.C. and Spaey, K. (2010) Sensitivity Ananlysis of the Opti-mal Parameter Settings of an LTE Packet Scheduler. IEEE-VTC, 1-6.
[11] 3GPP TS 23.203 v10.2.0. (2010) Policy and Charging Control Architecture (Release 10).
[12] Kennedy, J. and Eberhart, R.C. (2001) Swarm Intelligence. Morgan Kaufmann, San Mateo.
[13] Shi, Y.-H. and Eberhart, R.C. (1998) Parameter Selection in Particle Swarm Opti-mization. Evolutionary Programming VII: Proceedings of the Seventh Annual Con-ference on Evolutionary Programming, Springer-Verlag, New York, 591-600. http://doi.org/10.1007/BFb0040810
[14] Johnson, R.R. and Kuby, P.J. (2003) Elementary Sta- tistics. 9th Edition, Duxbury Press.
[15] 3GPP TR36.942 v10.0.0. (2010) Radio Frequency (RF) System Scenarios (Release 10).
Submit or recommend next manuscript to SCIRP and we will provide best service for you:
Accepting pre-submission inquiries through Email, Facebook, LinkedIn, Twitter, etc. A wide selection of journals (inclusive of 9 subjects, more than 200 journals)
Providing 24-hour high-quality service User-friendly online submission system Fair and swift peer-review system
Efficient typesetting and proofreading procedure
Display of the result of downloads and visits, as well as the number of cited articles Maximum dissemination of your research work
Submit your manuscript at: http://papersubmission.scirp.org/