IPENZ Transactions, Vol. 24, No. 1/EMCh, 1997
Mechanical modelling of wood
microstructure, an engineering approach
R J Astley,
1BSc (Hons), MSc, PhD, FIPENZ
J J Harrington,
2BE(Hons)
K A Stol,
3BE(Hons)
The macroscopic elastic behaviour of wood derives from the mechanical performance of the cells which form its microstructure. Numerical finite element models are presented which relate the elastic properties of the wood continuum to local cell characteristics such as cell size, wall thickness, moisture content and microfibril angle. Preliminary results show good agreement with observed values.
Keywords: wood microstructure - finite element analysis - elastic properties
1
Professor, 2PhD Student, and 3Research Assistant, Department of Mechanical Engineering, University of Canterbury, Private Bag 4800, Christchurch
This paper, presented at the 1996 IPENZ Conference, was received for publication on 2 December 1996.
1. Introduction
The macroscopic elastic behaviour of softwood timber is governed by nine orthotropic elastic constants in a coordinate system aligned locally with the grain direction. These are determined by the local microstructure of the wood cells. In this article, analytic and computational tools routinely applied to the analysis of large-scale engineering structures (laminate theory and finite element methodology) are used to predict these macroscopic elastic constants. This is done by treating the timber as a micro-cellular structure formed from composite laminated plate elements. The work described forms part of a broader interdisciplinary programme which seeks to predict the effect of specific cell-anatomical characteristics on the mechanical properties of radiata pine in order to improve its commercial value by the selection of genetic stock to give improved stiffness. Notwithstanding this specific application, the computer modelling techniques which have been developed are applicable to a broader range of problems involving the mechanics of wood deformation. These include studies of internal checking and cell collapse during drying and analysis of the non-linear mechanisms which occur at a cellular level during more extreme forms of wood processing such as slicing, splitting, tearing and sawing.
homogeneous structure for the cell wall and cannot readily be used to assess the effects of the cell-wall internal structure. The models presented in this article permit both aspects of the problem to be represented, albeit in an idealised fashion.
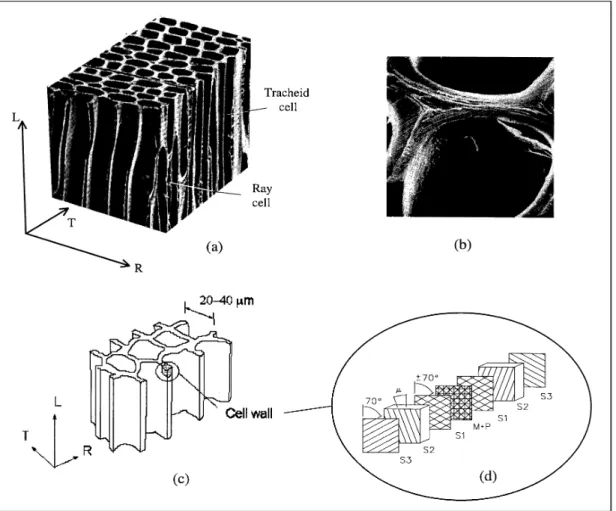
FIGURE 1: (a) Image of tracheid cells, (b) image of the cell wall, (c) model of cellular geometry, (d) model of cell-wall laminate
2. The theoretical model and simplifying assumptions
constants are available for each ply of the laminate. This leads to consideration of the smallest scale of representation in the current model, that of a fundamental volume element within each cell wall layer.
3. Modelling the cell wall lamellae
At a nano-structural level characteristic of the thickness of a single lamella, the wood cell wall is an interpenetrating network of carbohydrate and lignin macromolecules and water. The principal component of the wall is cellulose, a linear homopolymer consisting of β-1-4 linked glucose residues. Cellulose is present as highly crystalline microfibrils whose diameter is approximately 5 nm. These microfibrils are embedded in a matrix of polyoses (hemicelluloses) and lignin. There is good evidence to suggest that the polyoses, also polymers of sugar residues, are oriented in a similar fashion to the cellulose chains, and are intimately associated with the cellulose at the surface of the microfibrils, and form bridging links between microfibrils. Lignin on the other hand is a highly branched polymer of coniferyl alcohol, and has no preferred orientation. It is, however, not evenly distributed, but is thought to form tangential lamella, probably because of the lower degrees of molecular order in zones where successive lamellae have differing microfibrillar orientations. The polyose and lignin are covalently bonded at certain sites, and are very finely mixed. The microfibrils occur in concentric lamellae, each lamella approximately a single microfibril thick. Within a lamella the microfibrils are unevenly spaced, but are approximately parallel. In the secondary wall the microfibrils are also reasonably straight. In its natural state the cell wall is water-saturated. X-ray diffraction observations indicate that while amorphous cellulose is highly hygroscopic, the crystalline form is inaccessible to water. Isolated polyose fractions are also highly hydrophilic [6] though this affinity for water may well be modified in situ by the blocking of sorption sites by the lignin. The removal of moisture from the wall results in shrinkage, as well as increased stiffness.
4. A representative volume element
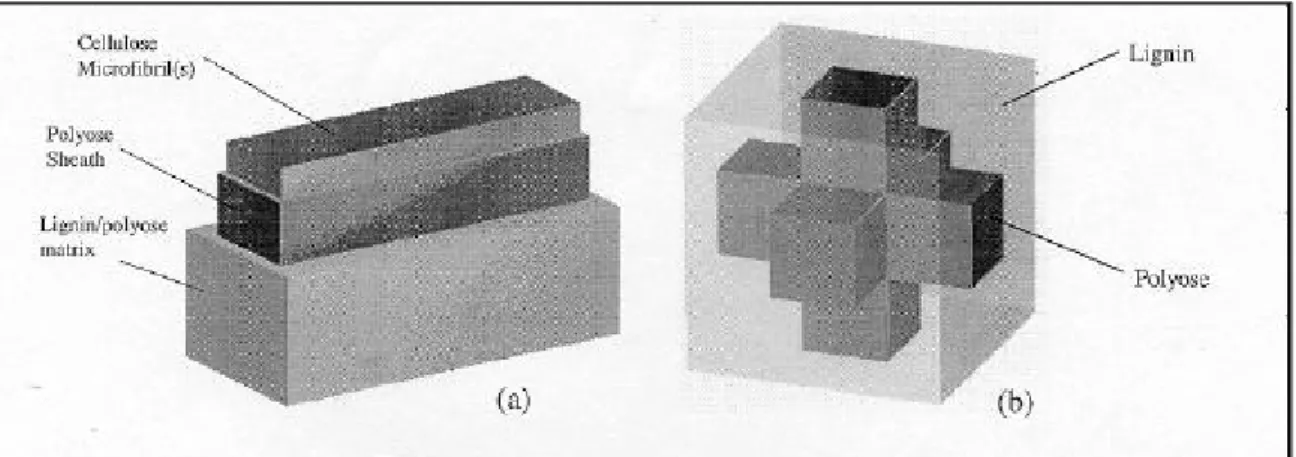
Although at this scale, the cell wall is truly a molecular complex, the wall lamellae can be considered as a first approximation to be continuous-fibre reinforced composites, and furthermore the microfibrils can reasonably be treated as straight and parallel. This allows the application of micromechanical tools developed to determine the overall properties of a heterogeneous material from the constituent properties, composition and structure of that material. Fundamental to all micromechanical homogenisation techniques is the concept of a representative volume element (RVE), or a portion of the heterogeneous material which can be considered to be in some way statistically indicative of the whole. In the case of the cell wall a suitable, albeit simple, RVE is shown in Figure 2(a). The central core of the RVE is a tangential agglomeration of microfibrils, which accounts for the uneven distribution of the microfibrils within a lamella, and is treated as a single entity because of the high degree of bonding provided by the associated polyoses. While crystalline cellulose has only monoclinic symmetry, the core is transversely isotropic, since there is no evidence to suggest that the crystallites are oriented in any transverse plane. Surrounding the crystalline core is a cellulose/polyose cortex, or sheath. This sheath is also transversely isotropic, and serves to account for the partial alignment of the polyoses in the microfibrillar direction, and to couple the core to the remainder of the matrix. This sheath is of uniform thickness since there is no reason to believe otherwise. The remainder of the RVE is occupied by an isotropic lignin/polyose matrix. This is unevenly distributed to account for the observed tangential lamellation. Since the matrix is a mixture of lignin and polyose, a second RVE is required to provide its properties.
A simple model where the lignin is considered to be an inclusion in a polyose filler, or vice versa, is unacceptable because of the large difference in the mechanical properties of these two constituents. For this reason the RVE shown in Figure 2(b) is employed. It should be borne in mind that this is just a convenient model and does not significantly represent the actual cell wall nanostructure.
5. Homogenisation
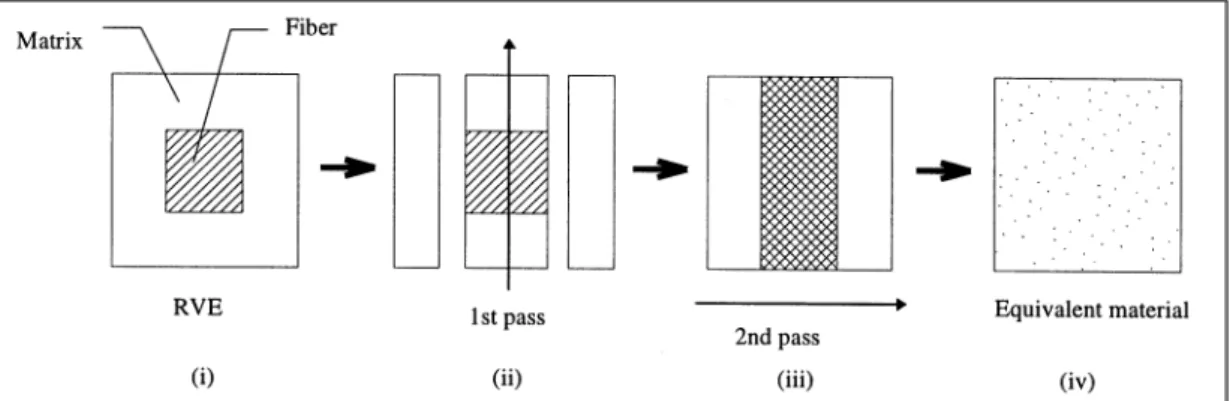
Having chosen to treat the wall-lamella as heterogeneous continua, it remains to select a suitable homogenisation procedure to determine the properties of the equivalent homogeneous material. While much of what follows is applicable to other properties, for example the expansional coefficients or linear visco-elastic parameters, only the elastic moduli have been considered here. Numerous homogenisation techniques, of varying degrees of sophistication, exist in the literature. In this case the method developed by Chou and Carleone [7] was adopted, partly because it had been used before [8] and also because it is quite straightforward to implement. This method is directly applicable to layered media, but it can be adapted for use on a general orthotropic fibre reinforced RVE by making multiple homogenisation passes in orthogonal directions as illustrated in Figure 3.
FIGURE 3:The homogenisation procedure for the cell wall RVE.
First the central portion is treated as a laminate, and is homogenised to yield an intermediate equivalent material. This material is then considered as part of a second laminate in an orthogonal direction. The homogenisation of this second laminate gives the equivalent material properties. While this multi-pass method rides roughshod over a number of assumptions made in the development of the theory, results using this method compare well with those obtained using a periodic FE homogenisation procedure (very much like the one used subsequently to find the equivalent elastic properties of the cellular structure), at least for the geometry and constituent properties chosen for the comparison (see Table 1).
TABLE 1: Comparison of FE and multi-pass homogenisation results (values in GPa).
TABLE 2: Cell wall layer compositions (oven-dry mass fractions).
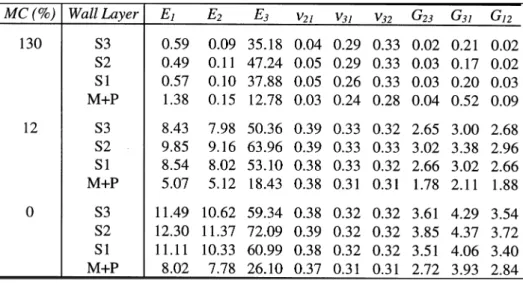
The nanostructural geometry was based on a tangential agglomeration of only 3 microfibrils, each having a 3.5 nm diameter. For lack of information, both the polyose sheath and the lignin/polyose matrix were uniformly distributed around the periphery of the microfibrillar core. Since the cellular FE model makes no attempt to incorporate the stresses developed by shrinkage, or the changes in layer thicknesses due to the removal of moisture, the effect of moisture content was limited to changes in constituent properties. However, the moduli computed are referred to the oven-dry dimensions. This was crudely accomplished by assuming that the RVE shrank (or swelled) only in the transverse direction, since the microfibrils are known to be unaffected by moisture, and that the change in total volume corresponded to the volume of moisture held by the wall constituents. The moisture content of the constituents (except for cellulose which was considered to remain dry) was determined by assuming that the relative humidity corresponding to the whole-wood moisture content (MC) of interest was constant throughout the wall. This relative humidity (RH) was found using data from the sorption curves of Pinus radiata sapwood [11]. The moisture contents of the polyose and lignin were then determined from the MC/RH curves given by Cousins [6,9,10]. The properties of the constituents at the determined moisture contents were taken from the work of Cave [3] and Cousins [6,9,10] with minor modifications. The nine engineering constants which are required to describe an orthotropic elastic material for each of the major cell wall layers were calculated using this procedure and are listed in Table 3. They are given at three representative whole-wood moisture contents. These moisture contents correspond to wood states commonly found in practice, namely green timber (130% MC), in-service structural timber in a normal atmosphere (12%), and oven-dry timber (0%). The subscripts refer to the a set of cartesian coordinates, the 3-axis being in the direction of the microfibrils, the 2-3-axis being normal to the lamella, and the 1-3-axis lying in the plane of the lamella and normal to the microfibrils.
TABLE 3: Calculated elastic constants for the cell wall layers of Pinus radiata (moduli in GPa).
6. The cellular FE model
regular cell array with the same statistics. The collection of such data by manual means is tedious but can be performed quite simply if an image processing program - such as METAMORPH - is used. The repeatability of a cyclic cellular unit in the resulting model means that an infinitely large collection of cells can be modelled, in this way, without approximation, by applying cyclic constraints (these correspond to a state of bulk uniform strain, direct or shear). A model of this type is shown in Figure 4.
FIGURE 4: A cyclically repeated sub-unit of a regular array.
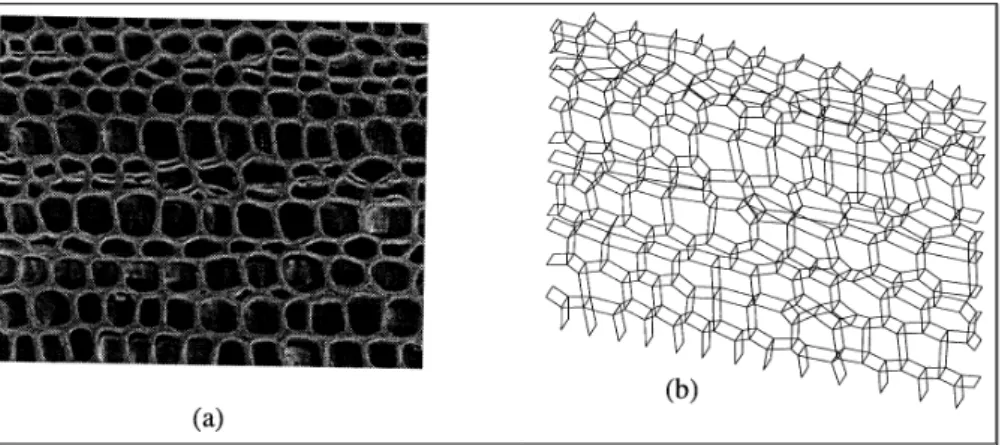
The second type of model is obtained by skeletising the original micrograph image and extruding the resulting planar cell arrangement to form a prismatic FE model based on the real cell geometry. The resulting model is no longer cyclical and a rigid “constant strain” constraint must be applied at its boundaries. Provided that a reasonable number of cells is used - of the order 100-200 - the edge effects involved in this approximation have been found to be small. An FE-irregular(geometry) model of this type and the micrograph from which it is derived are shown in Figure 5. The FE code ANSYS was used for the analysis of both types of model (“statistical” and “irregular”) . In each case the double cell wall is treated as a “thick” composite shell element with the laminate structure of figure 1(d) and layer moduli of table III. By imposing a state of uniform strain on the boundary of the model - either in a cyclical sense or directly - the effective direct and shear moduli can be obtained from the computed overall ratios of load to deflection. If the cellular arrangement is typical of the continuum, these translate directly into orthotropic elastic moduli for a piece of timber with this particular cell geometry.
FIGURE 5: (a) Cellular geometry, (b) ANSYS FE model.
7. Comparison with analytic solutions for regular arrays
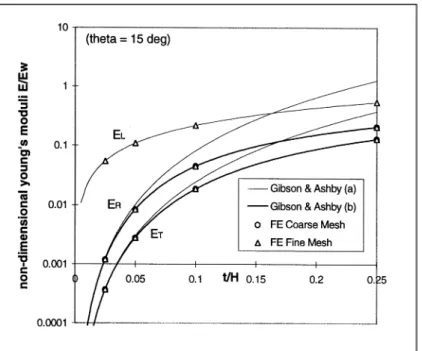
FIGURE 6: Computed and analytic moduli for a regular cell array with isotropic walls.
8. Results for “real” cell geometries
A number of parametric studies have been performed using the full model described above (i.e. including the internal structure of the cell wall as discussed in Sections 2-5) and varying cell parameters. Results from some of these are shown in Figure 7. The wood analysed is fictitious in the sense that the cell geometry has been taken from a particular micrograph of earlywood Pinus radiata and then used to test the effect of varying internal cell-wall parameters. Data is presented here for the particular case of a moisture content of 12 % and a basic density of 390 kg/m3.
FIGURE 7: Calculated values of elastic constants; (a) radial, tangential and axial Young’s moduli (ER, ET and EL), (b) shear moduli (GRL, GTL and GRT).
angles can be attributed to the axial contributions of the S1 and S3 layers, which are included in the FE representation but not in Cave’s analysis, and which become more significant as the microfibril angle increases. A unique feature of the current approach is its ability to relate transverse values of the elastic moduli directly to microfibril data. The variation is not great, ER and ET increasing by approximately 30% as the
microfibril angle ranges from 0 to 50°. The values obtained for the shear moduli (Figure 7(b)) and Poisson’s ratios (not presented here) show somewhat greater variation.
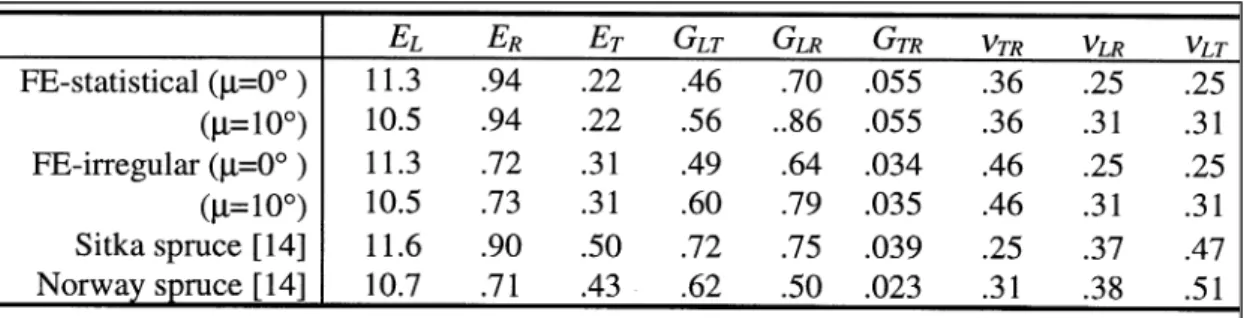
Comprehensive validation of the current model will be possible only through comparison of predicted and measured orthotropic moduli for clearwood samples of known microfibril orientation and cellular geometry. No such data exists at present but a measurement programme with this objective is currently in hand [13]. We can, however, check that the values predicted by the FE model are at least in broad agreement with those which have been measured for similar species. A comparison of this type is presented in Table 4. This shows computed values for the nine orthotropic elastic constants obtained using the statistical and irregular meshes already discussed. Comparison is made with measured values [14] for Norway and Sitka spruce. It is almost certain that these latter data are collected from outerwood with a low microfibril angle. For comparison, computed data is presented only for microfibril angles in the range 0-10°. The comparison is not entirely valid since the measured data derives from wood which includes both earlywood and latewood bands whereas the FE models currently simulate an “equivalent” earlywood material (i.e. having the same basic density). Nonetheless, the correspondence is generally quite close and appears to be somewhat improved when the irregular model is used.
TABLE 4: Computed and measured orthotropic elastic constants (basic density 390 kg/m3, moisture content 12 %, moduli in GPa).
9. Conclusions
Finite element models have been constructed which permit a realistic micro-structural representation of softwood timber taking into account cell geometric effects and the complex laminated structure of the cell wall. Such models are able to predict macroscopic timber stiffness for a given cellular geometry and assumed distribution of microfibril angle within the cell wall. The orthotropic elastic moduli predicted in this way have been compared to theoretical predictions for regular arrays of uniform cells (with isotropic cell walls) and to existing published data for softwood of low microfibril angle. Close correspondence is achieved in both instances. Further validation of this approach to the prediction of macroscopic wood stiffness requires the collection of measured orthotropic data for the elastic moduli of fully characterised wood samples. Such a programme of measurement is currently in hand and will be reported at a later date.
10. Acknowledgements
The work reported here is supported by the Public Good Science Fund. The second author is supported also by the Forest Research Institute (FRI). The assistance and advice of Brian Butterfield and John Walker has been central to much of this research and is greatly appreciated, as is the help and participation of Rolf Booker at FRI. The first author would also like to express his appreciation to Bob Hanna for his helpful comments.
11. References
[1] Cave, I. D. 1968. The anisotropic elasticity of the plant cell wall. Wood science and technology, 2(4), 268-278. [2] Cave, I. D. 1969. The longitudinal Young’s modulus of Pinus radiata. Wood science and technology, 3(1), 40-48. [3] Cave, I. D. 1978. Modelling moisture-related mechanical properties of wood - Part II: Computation of properties of a
[4] Gibson, L. J. and Ashby, M. F. 1988. Cellular Solids; Structure and Properties. Pergamon, Oxford. [5] Kahle, E. and Woodhouse, J. 1994. Journal of materials science, 29, 1250-1259.
[6] Cousins, W.J. 1978. Young's modulus of hemicellulose as related to moisture content. Wood science and technology. 12:161-167.
[7] Chou, P.C., Carleone, J., and Hsu, C.M. 1972. Elastic constants of layered media. Journal of composite materials. 6:80.
[8] Koponen, S., Toratti, T., and Kanerva, P. 1989. Modelling longitudinal elastic and shrinkage properties of wood.
Wood science and technology. 23(1):55-63.
[9] Cousins, W.J. 1976. Elastic modulus of lignin as related to moisture content. Wood science and technology. 10:9-17. [10] Cousins, W.J. 1977. Elasticity of isolated lignin: Young's modulus by a continuous indentation method. New Zealand
journal of forestry science 7(1):107-112.
[11] Kininmonth, J.A. and Whitehouse, L.J. (eds.) 1991. Properties and Uses of New Zealand Radiata Pine: Volume One - Wood Properties. New Zealand Ministry of Forestry, Rotorua.
[12] Tsehaye, A., Buchanan, A.H., and Walker, J.C.F. 1995. Stiffness and tensile strength variation within and between radiata pine trees. Journal of the Institute of Wood Science 13(5) 513-518.
[13] Winklemann, K. and Pugh, M.D. 1996. Mechanical property measurements in small wood specimens. Proceedings IPENZ annual conference, Dunedin, Feb 9-13.