Abstract- Old documents are in printed form. Their archiving and retrieval is expensive according in terms of space requirement and physical search. One solution is to convert these documents into electronic form using scanners. The outputs of scanners are images contaminated with noise. The outcomes are more storage requirement and low OCR accuracy. A solution is noise reduction. This paper employs KFCM algorithm to cluster pixels into text, background and noise according to their features. As a result, noise removal and binarization is done simultaneously.
Index Terms— preprocessing, document noise, binarization,
noise removal algorithms, clustering
I. INTRODUCTION
ransforming old documents from printed into digital format makes searching and archiving much easier. The transformation requires scanning but, noise is an inevitable outcome of scanning and affects the OCR accuracy and increases the storage requirement. Pre-processing of scanned document images (SDI) including noise reduction (NR) and binarization are key steps to overcome this problem. Noise of SID can be categorized into six groups: rule lines, marginal, clutter, stroke like pattern (SPN), salt and pepper and background [1] [2]. Normally, NR algorithms focus on reducing specific noise. With an exception of background noise reduction algorithms, other ones work on binary document images (BDI). This means that a binarization step is performed before NR which causes undesirable effects. Moreover, NR algorithms may result in producing another type of undesirable noise. This paper focuses on reducing different types of noise and binarization simultaneously by employing kernel fuzzy c-means (KFCM) to cluster pixels into text, background and noise with respect to proper features. As a result, noise reduction and binarization is performed simultaneously.
Manuscript received Dec 12, 2015; revised Jan 24, 2017.
Farahmand is an M.Sc. student with the Department of Computer Engineering, Faculty of Engineering, Kharazmi University, Tehran, I.R. Iran (e-mail: [email protected]).
Abdolhossein Sarrafzadeh is a Professor and Director, Unitec Institute of Technology, Auckland, New Zealand (Phone +64 9 815 4321 ext. 6040; email: [email protected]).
Jamshid Shanbehzadeh is an Associate Professor with the Department of Electrical and Computer Engineering, Kharazmi University, Tehran, I.R. Iran (phone: +98 26 34550002; fax: +98 26 34569555; (e-mail: [email protected]).
II. BACKGROUND
Noise appears in foreground or background of an image and it can be generated before or after scanning. Examples of SDI noise are presented in the following paragraph.
The page rule line is a source of noise which interferes with text objects. Its reduction algorithms can be categorized into mathematical morphology, Hough transform and Projection Profile. Mathematical morphology based methods are limited by designing and application of the structuring elements. This often requires the knowledge of font size or trial and error [3]. Algorithms based on Hough transform are more robust against noise and, work better with broken lines in comparison with other methods although they are computationally expensive [4]. Projection profile methods ignore the thickness of lines. Therefore, in the NR phase, the characters with horizontal strokes will be broken. Another problem of this group of algorithms is their sensitivity to rotation. In comparison to former algorithms, because of dimension reduction capabilities, these groups of algorithms are computationally more efficient [5, 6].
Marginal noise usually appears in a large and dark region around the document image and can be textual or non-textual. We can divide the algorithms of marginal noise reduction into two major categories. The first one identifies and reduces noisy components [7, 8, and 9]. The second one identifies actual content area or the page frame of the document [10, 11].
Some forms of clutter noise appear in SDI because of scanning skew or punch holes. Agrawal [12] proposes a robust algorithm with respect to clutter’s position, size, shape and text connectivity.
SPN is independent of size or other properties of the text in a SDI. In 2011, Agrawal [13] mentioned the difference between SPN and rule-lines for the first time and proposed a classification algorithm for its removal.
Background noise, like uneven contrast, appears through effects, interfering strokes and background spots. We can categorized NR algorithms in 5 major groups: binarization and thresholding [14], fuzzy logic based [15], histogram [16], morphology [17] and genetic algorithm [18].
III. PROPOSEDMETHOD
The proposed algorithm consists of two steps. The first step clusters the SDI pints into text, noise and background
Noise Removal and Binarization of Scanned
Document Images Using Clustering of
Features
Atena Farahmand, Abdolhossein Sarrafzadeh and Jamshid Shanbehzadeh,
by KFCM and, the second step corrects the result by a simple post-processing algorithm.
A. SDI Point Clustering
KFCM is a modification of Fuzzy C-means (FCM) that employs a new kernel-based metric in the original Euclidean norm metric of FCM [19]. It partitions a dataset X = {x1,
x2,…,xn} ⊂ Rp, where p is the dimension, into c fuzzy
subsets by minimizing the following objective function:
Where c is the number of clusters and it is determined by a prior knowledge, N is the number of data points, uik is the
fuzzy membership of xk in class I, m is a weighting exponent
on each fuzzy membership and, Φ is the set of cluster and it is an implicit nonlinear map where:
And
If we use the Gaussian function as a kernel function, K( )=1 so Equation 1 can be written as:
Minimizing Equation (4), we will have:
The proposed algorithm employs features which distinguish noise from other parts of the SDI. The input of KFCM are two feature including the average intensity of an 8*8 sub-window of neighboring pixels and the intensity of each pixel [20]. By finding the maximum membership of each pixel, we can identify the cluster of each pixel. To remove noise and binarize simultaneously, we use appropriate color for pixels in each cluster, so we assign black for text cluster, white for background and remove noise cluster completely. In this way, the resulting image is a two-level binarized image without clutter, rule line and non-textual marginal pixels. Fig. 1 is an example that shows the input and output of this step.
Fig. 1. (a) example of clustering (b) final result of step 1
B. Step 2: Post processing step
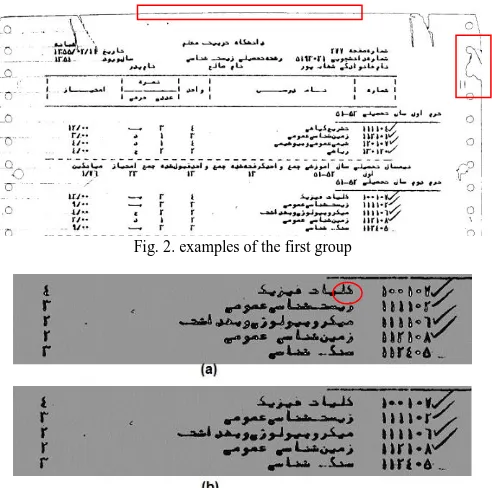
[image:2.595.319.534.48.236.2] [image:2.595.45.292.331.456.2]We perform post-processing to correct the clusters of each pixel. This is a commonly used process in most articles which employ clustering for document images. Fig. 2 and Fig. 3 show the two groups of pixels in the incorrect clusters. They are noise in the text cluster (group 1) and the texts in the noise cluster (group 2).
Fig. 2. examples of the first group
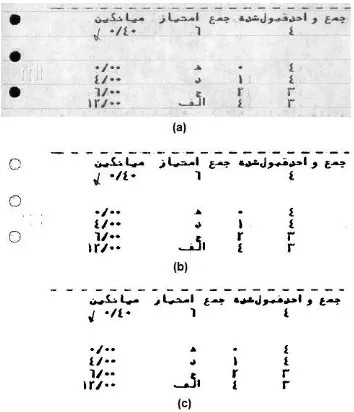
Fig. 3. example of the second group
The first group includes clutter edges similar to small text components such as alphabet dots, which are in the text cluster by mistake. The remaining edges after clutter removal are Stroke-like Pattern Noise (SPN). This step of algorithm removes SPN. The second group consists of text pixels surrounded by several text pixels and a few background pixels, so they are in the noise cluster. We use two phases to correct the corresponding cluster of these two groups of pixels:
[image:2.595.305.551.358.602.2]use stroke width [21] as threshold and choose pixels under the threshold to examine in the second phase.
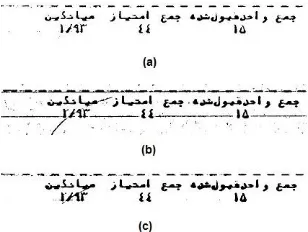
Phase 2: In this phase, we use clusters of 8*8 sub window of neighbors of all the pixels selected from the first phase. According to Markov Random Field theory, pixels are usually in the same cluster with their neighbors. We change the cluster of pixel cluster, if more than half of its neighbors belong to a different cluster. Fig. 4 shows the original image, the output of the first step and the final result after post processing.
Fig. 4. (a) original image (b) result of the first step (c) result of the second step
IV. EXPERIMENTALRESULTS
The test bed for experiment consists of SDI of old documents of Kharazmi University, the ground truth images that are generated by Pix Labeler software [22] and F-Measure as the evaluation criteria. SDIs of Kharazmi University consists of images with almost the same font size with different types of background noise (lines and patterns in background, uneven contrast …), clutter noise and marginal noise. Fig. 5. (a) Shows an example.
To prepare the ground truth for this database, we used Pix Labeler software [22]. As shown by Fig. 5. (b), the ground truth consists of text labels in blue color, scanned noise in green color and background labels in white color.
Fig. 5. (a) sample of Kharazmi dataset (b) ground truth of that sample
To evaluate the proposed method, in each cluster (text, noise and background) TP rate, FP rate, FN rate and FP rate
are used. Also, we used F-Measure which is calculated as follows:
Where:
A. Evaluation of text, noise and background clustering
[image:3.595.80.257.178.384.2]Table I, II and III show the result of clustering with the above rates for 5 samples of our dataset:
Table I. Evaluation result for text clustering
Im
ag
e
N
o
.
Precision Recall F- measure
(%)
1 0.99 0.99 99
2 0.98 0.99 98.4
3 0.99 0.992 99.09
4 0.98 0.998 98.88
5 0.97 0.996 98.28
Table II. Evaluation result for noise clustering
Im
ag
e
N
o
.
Precision Recall F- measure
(%)
1 0.99 0.984 98.72
2 0.98 0.992 98.59
3 0.99 0.997 99.34
4 0.98 0.992 98.59
5 0.97 0.973 97.14
Table III. Evaluation result for background clustering
Im
ag
e
N
o
.
Precision Recall F- measure
(%)
1 0.99 0.998 100
2 0.99 0.999 100
3 0.98 0.999 99.45
4 0.99 0.994 99.19
[image:3.595.317.538.255.790.2] [image:3.595.46.291.594.732.2]Table VI summarizes the F-measure of 30 samples of dataset.
Table VI. Summary of clustering evaluation
F-Measure (%) Cluster 98.74 Text 97.54 Noise 98.84 Background 98.37 Average
B. Evaluation of noise removal
As mentioned before, our method has the advantage of removing different types of noise simultaneously. We compare our final results with some famous algorithms in removing specific types of noise. All the algorithms are implemented by the same CPU and memory using MATLAB.
1.Evaluation of background noise removal
[image:4.595.353.500.354.491.2]Background noise in our dataset consists of uneven contrast and rule lines. One of the common and successful ways to remove background noise is thresholding. This part compares our method with a famous global thresholding method (Otsu's algorithm) and a local method (Niblack's algorithm). Table V presents the results of all the methods based on the average F-measure of 5 samples of dataset.
Table V. Comparison of methods on background noise removal F-measure M et h o d Im age 1 Im age 2 Im age 3 Im age 4 Im age 5 F -me a su re Ot su
92.76 91.38 93.24 93.29 90.6 92.25
N
ib
la
ck
75.13 68.53 67.43 75.81 53.62 68.1
Pr o p o sed M et h o d
97.45 96.37 95.22 93.64 91.58 94.85
Otsu's algorithm finds a unique threshold for binarizing the image; hence it removes background patterns successfully at the cost of removing some details of an image. On the other hand, local methods preserve image details but some part of noise is classified as text. We can see the final result of Otsu, Niblack and our proposed
Fig. 6. (a) Otsu result (b) Niblack result (c) Our proposed method
This part evaluates our method in clutter noise removal in compare with Shi algorithm [23]. In Table VI we can see the accuracy of clutter removal in five samples of database and the last column shows the average accuracy of both algorithms.
Shi algorithm has two disadvantages: first it fails in removing clutter edges so the final result of algorithm still faces with some clutter edges and the algorithm has no other step to correct the final result. Second, it detects thick parts of texts as clutter noise so the final result loses some important text parts. Fig. 7 shows the final results of the Shi method and our proposed method:
[image:4.595.56.281.463.699.2]Fig. 7. (a) Shi result (b) Our method
Table VI. Comparison of methods on clutter noise removal
Me th od Im age 1 Im age 2 Im age 3 Im age 4 Im age 5 Clu tt er r em oval ac cu rac y (%)
Shi 72.06 70.01 69.34 56.35 60.05 65.56
Our Method
98.46 99.2 99.17 89.27 98.98 97.01
V. CONCLUSION
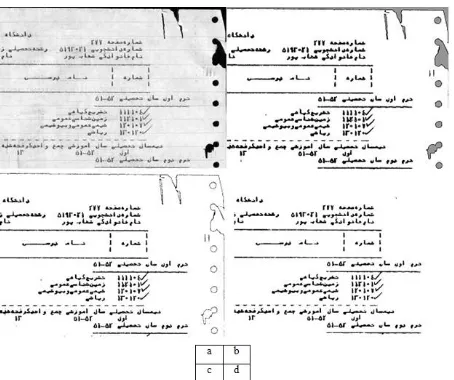
[image:4.595.319.535.536.677.2]Fig. 8. (a) Original Image (b) Step 1 result (c) Remained edges (d) Final result
Fig. 9. (a) Original Image (b) Step 1 result (c) Remained edges (d) Final result
REFERENCES
[1] Research council of OCR, “Research review of Persian OCR,” The supreme council of Information, 90-10982, 2010.
Available: http://www.emdad.ir/mcontent/Afta/Research/research.pdf [2] A. Farahmand, A. Sarrafzadeh, and J. Shanbehzadeh, “Document image
noises and removal methods,” IMECS, Newswood Limited, 436–440, 2013.
[3] J. Said, M. Cheriet, and C. Suen, “Dynamical morphological processing: a fast method for base line extraction,” ICDAR, pages 8– 12, 1996.
[4] Lei Xu, E. Oja, and P. Kultanen, “A New Curve Detection Method: Randomized Hough Transform (RHT),” Pattern Recognition Letters, Vol.11, pp331-338, 1990.
[5] H. Cao, R. Prasad, and P. Natarajan. “A stroke regeneration method for cleaning rule lines in handwritten document images, ” In MOCR ’09: Proceedings of the International Workshop on Multilingual OCR, pages 1–10, New York, NY, USA, 2009.
[6] Zhixin Shi, Srirangaraj Setlur, Venu Govindaraju, “Removing Rule-Lines from Binary Handwritten Arabic Document Images Using Directional Local Profile, ” ICPR 2010: 1916-1919
[7] Zheng Zhang and Chew Lim Tan, “Recovery Distorted Document Images from Bound Volumes”, IEEE, 2001, pp.429-433.
[8] Kuo-Chin Fan, Yuan-Kai Wang, and Tsann-Ran Lay, “Marginal noise removal of document images,” Pattern Recognition Society, Elsevier Science Ltd., 2002, pp.2593-2611.
[9] W. Peerawit and A. Kawtrakul, “Marginal Noise Removal from Document Images Using Edge Density,” Proc. Fourth Information and Computer Eng. Postgraduate Workshop, Jan. 2004.
[10] Faisal Shafait, Joost van Beusekom, Daniel Keysers, and Thomas M. Breuel, “Document cleanup using page frame detection,” IJDAR 11(2): 81-96 (2008).
[11] F. Shafait and T. M. Breuel, “A Simple and Effective Approach for Border Noise Removal from Document Images,” Proc. 13th IEEE Int’l Multi-Topic Conf., Dec. 2009.
[12] M. Agarwal, D. Doermann, “Clutter noise removal in binary document images,” in [Proc. Intl. Conf. on Document Analysis and Recognition], 556–560 (2009).
[13] M. Agrawal, D. S. Doermann: “Stroke-Like Pattern Noise Removal in Binary Document Images, ” ICDAR 2011: 17-21
[14] J. Sauvola, M. Pietikainen, “Adaptive document image binarization,” Pattern Recognition, (2000), Vol. 33 Issue 2, pp. 225-236
[15] R. Parvathi, S. K. Jayanthi, N. Palaniappan, S. Devi, “Intuitionistic Fuzzy approach to Enhance Text Documents,” Proceedings -3rd IEEE International Conference on Intelligent Systems (IEEE IS ’06), 2006, p733-737.
[16] Kim, J.Y., Kim, L.S., Hwang, S.H., “An advanced contrast enhancement using partially overlapped sub-block histogram equalization, ” IEEE Trans. Circuits Syst. Video Technol. 11, 2006, 475–484.
[17] S. Nomura, K. Yamanaka, T. Shiose, H. Kawakami, O. Katai, “Morphological preprocessing method to thresholding degraded word images, ” Pattern Recognition Letters 30 (8) (2009) 729–744. [18] H. Deborah and A. M. Arymurthy, “Image Enhancement and Image
Restoration for Old Document Image using Genetic Algorithm,” Proceedings of Second International Conference on Advances in Computing, Control and Telecommunication Technologies (ACT 2010), p 108-12, 2010.
[19] D.-Q. Zhang, S. Chen, “A novel kernelized fuzzy c-means algorithm with application in medical image segmentation,” Artificial Intelligence in Medicine, vol. 32, pp.37-50, 2004.
[20] Cohen, Rafi, et al. “Robust text and drawing segmentation algorithm for historical documents,” Proceedings of the 2nd International Workshop on Historical Document Imaging and Processing. ACM, 2013.
[21] Valizadeh, M., et al., “Degraded document image binarization based on combination of two complementary algorithms,” Advances in Computational Tools for Engineering Applications, 2009. ACTEA'09. International Conference on. IEEE, 2009.
[22] Saund, Eric, Jing Lin, and Prateek Sarkar, “Pixlabeler: User interface for pixel-level labeling of elements in document images,” Document Analysis and Recognition, 2009. ICDAR'09. 10th International Conference on. IEEE, 2009.
[image:5.595.56.283.47.237.2] [image:5.595.61.272.273.422.2]