Abstract— In order to optimize the performance of a
Formula SAE car and its driver, data on the car’s systems must be collected; interpreted and necessary adjustments must then be made. To address the need for optimization of Purdue Northwest’s FSAE race car, a telemetry and data acquisition system was implemented. This paper provides a brief about the construction of the Purdue Northwest Formula SAE team’s telemetry and data acquisition system. Included topics are the concepts, designs, sensors, components, programming tools, simulation tools, and methodologies used to create a working telemetry and data acquisition system. The system is based on an Arduino Mega microcontroller and its shields, which gather and transmit data from multiple sensors that measure parameters such as suspension travel, throttle/brake position, steering angle, fuel pressure, lateral/longitude/vertical acceleration, engine/coolant temperature and many more sensor values from the engine control module (ECU) via CAN-BUS. Though many of these devices were not meant to work directly with one another, the use of communication protocols allowed the system to successfully relay data back to the pit via graphical display for assessment by the engineering students of Purdue Northwest’s FSAE team.
Index Terms— Data Collection, Formula SAE Car Racing
Remote Sensing, Telemetry
I. INTRODUCTION
Purdue Northwest competed in its first Formula SAE competition in the past year of 2016. The goal of the team has since been to make significant improvements on its systems and designs. One such improvement has been the implementation of a telemetry and data acquisition system. A telemetry and data acquisition system allows for the collection and interpretation of data from sensors on the car, which enables the team to not only diagnose and solve issues with the other systems of the car, but to fine-tune and optimize the geometry of the mechanical systems as well as making suggestions to the driver based on data.
A sub-team of the Purdue Northwest Formula SAE team was tasked with the creation of a telemetry and data acquisition system that fits within budgetary constraints. The team wished to measure various parameters including, but not limited to: suspension travel of all 4 wheels, throttle
Manuscript received June 6, 2017; revised July 30, 2017. This work was supported in part by the Purdue University Northwest Department of Engineering Technology.
A. Ayaad was a student in Mechatronic Engineering with Purdue University Northwest Department of Engineering Technology, Hammond, Indiana 46323 USA, ( [email protected])
M. Fathizadeh, PhD, PE is a Professor of Electrical and Computer Engineering at Purdue University Northwest Department of Engineering Technology, Hammond, Indiana 46323 USA ([email protected]).
and brake position, steering angle, fuel pressure, lateral/longitude/vertical acceleration, engine/coolant temperature, and other sensor values from the Engine Control Module (ECU). To accomplish this task, various devices and computer programming tools and software were used. The telemetry system in the car is based largely on an Arduino Mega microcontroller and compatible shields. Some devices used in this project were not necessarily made to be used together, but through the use of communication protocols such as CAN-BUS, I2C, and SPI, the system was able to produce a reliable flow of data. This data is then transmitted via wireless communications and displayed graphically using LabVIEW. The end result was a reliable, affordable data acquisition system. The goal of this paper is to explain the concepts and design of the system; components, sensors, and software used; the necessary calculations made; the problems that were encountered and the methodologies used to solve the problems; and safety measures taken during the construction of the system.
II. SYSTEM DESCRIPTION AND LAYOUT A. Review Stage
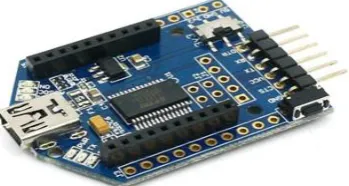
The Arduino Mega 2560, a microcontroller board based on ATmega2560, controls the collection of data for the PNW telemetry system through measurements taken by the potentiometers and data logged and transmitted through the shields.
The Arduino Mega 2560 is 101.52mm long, 53.3mm wide, and weighs in at 37g. The microcontroller has 54 digital input/output pins (15 provide PWM output), 16 analog input pins, 4 UARTs (hardware serial ports), a 16 MHz crystal oscillator, a USB connection, a power jack, an ISCP header, and a reset button. It operates at 5VDC, and its recommended input voltage is 7-12V, but it has a limit of 6-20V. The DC current per input/output pin is 20 mA, while the DC current for the 3.3V pin is 50 mA. It has a flash memory of 256 KB of which 8KB is used by the bootloader. It has a static random access memory (SRAM) of 8 KB, while its read only memory (EEPROM) size is 4 KB. Its clock operates at a speed of 16 MHz (Arduino, 2016).
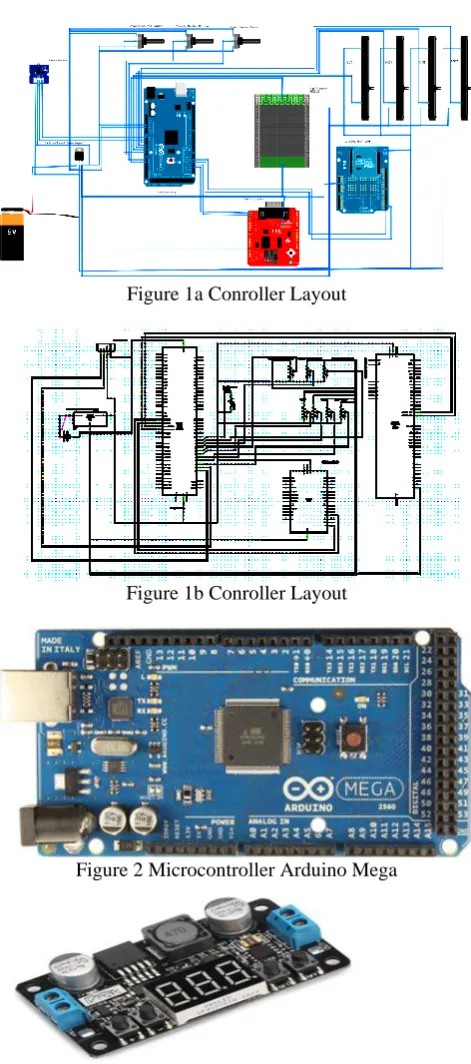
The control layouts are shown in figures 1a and b respectively. The Arduino Mega 2560 circuit is given in figure 2.
B. Buck Converter Voltage Regulator
A DROK 090029 regulated Buck Converter power supply is used to provide power to the critical data collection devices. Steady and constant voltage is very important since variation of supply voltage can cause error in data collection and transmission. This power supply can have an input of 5-32 V DC and maintain a regulated output
Telemetry and Data Collection to Improve
Formula SAE Car
of 0-30 VDC. It is rated at 30 W with the maximum output current of 1.5 A. The output voltage preset resolution is 0.1 V DC. The voltage testing accuracy is (± 1%, + 2) digits. The output is set to a constant 5 V DC which should not change as the system load changes drastically (DROK, 2013). The voltage regulator is shown in figure 3.
Figure 1a Conroller Layout
Figure 1b Conroller Layout
Figure 2 Microcontroller Arduino Mega
Figure 3 Buck Converter Voltage Regulators C. CAN-BUS
The CAN-BUS shield for Arduino allows for the logging of data from the ECU of the vehicle. This data can then be stored and displayed on a screen. The CAN-BUS shield is 101.6 mm long, 6.35 mm tall and 101.6 mm wide. The shield features CAN v2.0B up to 1 Mb/s. It uses the Microchip MCP2515 CAN controller and the MCP 2551
transceiver. A standard 9-way sub-D, used with an OBD-II cable, enables the CAN connection. The shield has a micro-SD card holder, a serial LCD connector, and a connector for an EM506 GPS module. It has a high speed SPI Interface of 10 MHz On the shield, there is a reset button, joystick menu navigation control, and two LED indicators. Power can be supplied to Arduino by the sub-D via a resettable fuse and reverse polarity protection (Sparkfun Electronics, n.d.)
[image:2.595.370.506.175.316.2]The Sparkfun 6479999 Shield CAN-BUS circuit is shown in figure 4.
Figure 4 Sparkfun 6479999 Shield CAN-BUS D. Triple-Axis Accelerometer Breakout
[image:2.595.324.537.487.624.2]The triple-axis accelerometer is used to determine acceleration forces in longitude, latitude, and vertical directions within the FSAE car. The accelerometer has a supply voltage of 1.95 V to 3.6 V. Its interface voltage is 1.6 V to 3.6 V. Its current consumption is 6 μA to 165 μA. The accelerometer possesses an I²C digital output interface that operates to 2.25 MHz with a 4.7 kΩ pullup. It is manufactured by Adafruit Part identification number: MMA8451QT. The circuit board for Triple-axis Accelerometer is shown in figure 5.
Figure 5 Triple-axis Accelerometer E. UartSBee v4.0 Shield
The UartSBee v4.0 connects the XBee-Pro 900 HP RF module to the universal serial interface of the computer (USB). The UartSBee v4.0 shield, connected to the XBee-Pro 900 HP RF module, is used to transmit and receive data collected by the Arduino Mega 2560. The data, which is stored on an SD card of the data logging shield, is also transmitted a computer running LabView software which simulates a virtual instrument panel for displaying types of data.
interface is a mini-B USB and a 2.54 mm pitch pin header. The communication protocols for this shield are UART, eight Bit-bang inputs/outputs, and SPI. Its adapter socket is XBee compatible with a 2.0 mm pitch female pin header. The shield is FTDI compatible and has a USB 2.0 compatible Serial Interface. It has 3.3V and 5V inputs/outputs and 3.3V and 5V dual power outputs. Its typical and maximum input voltage is 5Vdc, and it has a current consumption of 500 mA. Its minimum output voltage is 3.3 Vdc, while its maximum output voltage is 5 Vdc (Seeed Development Limited, 2016)
[image:3.595.83.258.229.322.2]Manufacturer: Seeed Studio Part identification number: INT110B2P
Figure 6 UartSBee v4.0 Shield F. XBee-Pro 900 HP RF Module
The XBee-Pro 900 HP RF module allows wireless connectivity to devices. Connected to the UartSBee v4.0 shield, the RF module will receive and transmit data from the Arduino Mega 2560. The data will be stored on the SD card of the data logging shield and simultaneously transmitted to a computer running LabView software which simulates a virtual instrument panel for displaying types of data.
To set up the XBee-Pro 900 HP RF module shown in figure 7, XCTU software is used. The specified antenna used is RP-MSA. It has fifteen digital inputs/outputs, four 10-bit ADC inputs, and two PWM outputs. The RF module transmits data at a rate of 10Kbps or 200 Kbps. The lower the transmit speed, the longer the range and the slower the transmission and collection of data. The higher the transmit speed, the shorter the range and the faster the transmission and collection of data. The data rate will operate in between those values for the purposes of the PNW Formula SAE vehicle. The frequency range needed is 902-928 MHz. The supply voltage is 3.6 Vdc. The transmit power is 250 mW. Its transmit current is 215 mA. Its reception current is 29 mA. Its outdoor/line-of-sight range is 10 Kbps or up to 9 miles (15.5 km) (Digi International Inc., 2015).
Manufacturer: Digi International Part identification number: 602-1299-ND
Figure 7 XBee-Pro 900 HP RF Module
III. SENSORS A. Linear Potentiometer-Diameter
The 75 mm linear travel potentiometer senses the linear displacement between two points when connected directly to the points of measure. These linear potentiometers can be used for measuring damper compression or extension and steering rotation, which is measured by rack displacement. Each use has its own specific software management. The linear potentiometers in Purdue Northwest’s Formula car will be utilized to measure damper compression.
The linear potentiometer is housed in aluminum and has a spherical bearing of Ø5 mm. Its cable is a 450mm Raychem 55A 24 AWG. Its environmental sealing is rated IP65, meaning the component is totally protected against dust ingress and limited ingress of low pressure water jets from any direction. The component best operates at a temperature range of -40 degrees to 125 degrees. It has a mechanical life of greater than 25 million cycles and operates at a maximum speed of 10 m/s. Its maximum supply voltage is 40 Vdc. The component’s resolution is essentially infinite. The repeatability, or retest reliability, of the component is less than or equal to 0.01mm and its independent linearity is less than or equal to ±0.5% (AiM Infotech).
Manufacturer: AiM Sportline Part identification number: X05SNLP075
B. Rotary Potentiometer - 10G Kit
The 10G rotary potentiometer kit used in Purdue Northwest’s Formula SAE car includes a 10G steering potentiometer (1), one toothed belt (2), two toothed pulleys (3), one Allen key (4) and one bracket kit (5). The rotary potentiometer, once installed and calibrated, will measure angular displacement. For the purposes of the Formula SAE competition, the rotary potentiometer will measure and collect data on the angular displacement of the steering wheel. The rotary potentiometer has a nominal resistance of 10kΩ, with a tolerance of ±5%. It has a high precision of 0.030%. Mechanically, its displacement is 1080 degrees/5 or 10 laps. The component operates at a temperature range of -55 degrees Celsius to 125 degrees Celsius. At 40 degrees Celsius, the power of the 10G potentiometer dissipates at 2.4 Watts. At 70 degrees Celsius, its power dissipates at 1.5 Watts (AiM Infotech). Manufacturer: AiM Sportline Kit identification number: X05SNST10G
C. Throttle Potentiometer
The throttle potentiometer will measure the displacement of the throttle. Its nominal resistance is 5kΩ linear. The potentiometer has a tolerance of ±20 % and a linearity of ±2 %. It allows an electrical displacement of up to 106°. Mechanically, the displacement is up to 130°. The sensor fatigues after 10^6 complete cycles. Its cable length is 240 mm (AiM Infotech).
Manufacturer: AiM Sportline Part identification number: X05SNRP972.
IV. CALCULATIONS AND CALIBRATIONS A. Fuel Pressure Transducer
[image:3.595.64.216.694.757.2]Arduino Uno, which allowed for the reading and display of analog input and pressure via the serial monitor of the Arduino code. To display the correct values for pressure, an equation relating analog input from the Arduino microcontroller to the pressure reading on the pressure sensor had to be found and added to the Arduino code. The original equation for the pressure sensor reading had to be adjusted to return proper values for the pressure reading. Originally with this equation, all pressure readings read by the microcontroller code were incorrect. To solve this issue, a linear equation relating analog input and pressure was established. There were several steps involved in finding the proper function. This function was used to determine what analog input is read when the pressure sensor reads a certain pressure. At zero psi, the analog input was 96. When the gauge read 60 psi, the serial monitor displayed an analog input of 591. Using a graphing calculator program Geogebra. the points (97, 0) and (591, 60) were plotted on an analog input versus pressure gauge reading graph. A best fit line equation was calculated for these two points using the features provided by the Geogebra program. After inputting this equation in the Arduino code, the serial monitor reading in psi was compared to the actual reading on the pressure gauge in psi. To calculate the percent error of the serial monitor reading, the following equation was applied:
Err% =
(
)
x100%An average of all the percent errors for each point was calculated. It was 0.6516%. Given that the average error for the readings were so low, it can be inferred that the program and formula found is accurate.
B. Suspension Displacement Potentiometer
The first step in the calibration process for the linear suspension potentiometer was converting its length to imperial units. The length of 75 millimeters corresponds to 2.95 inches. Next, the length of displacement at full extension and full compression of the potentiometer had to be measured with a set of calipers. Fully extended, the length of displacement of the potentiometer was 4.1185 inches. Fully compressed, the length of extension of the potentiometer was 1.1315 inches. From these two values, an equation was developed to represent the suspension displacement. This equation enabled the proper reading of the displacement of the sensor in both positive and negative directions relative to the midpoint.
Once an equation was established and implemented into the code, the error of each point was considered. The output value from the serial monitor was compared to the actual caliper reading. Percent error between the caliper reading and the displacement output from the sensor was estimated using the formula:
Err% = (
) x100%
In the Arduino code the equation is employed to obtain the proper reading of the displacement of the sensor in both positive and negative directions relative to the midpoint.
∆X= [(Suspension*0.0028528265)-1.4635]*100
The average percent error for the negative and positive directions on the sensor was 0.49% and 0.04%, respectively. These percent errors indicate that the calibration was highly accurate.
C. Steering Angle Displacement Potentiometer
The calibration process for the rotary potentiometer began with the calculation of a multiplier and a function to use in the Arduino code during testing. The rotary potentiometer has the capa ility of 360 rotation, meaning that the center position would e at 1 0 . Since this potentiometer is linear and the maximum analog input from the Arduino is known to be 1023, the analog input at the ma imum 360 rotation would also e 1023. At the center position of 1 0 , the analog input would read 511.5.
Readings in the positive and negative directions were recorded. The percent error of these values was found to be 6.5%. The following formula was used to calculate the percent error:
Err% =
(
)
x100%To reduce the error, the program Geogebra was used to plot ideal analog input versus the ideal displacement values. Using the best fit line function, the following formula was calculated to be used in the Arduino code:
ΔX = [(Steering-Angle*3.05)-1564.37)]
After implementing this new function, a second trial was conducted and a new data was found to have an average percent error of only 3.1%.
D. Brake Position Sensor
The pedal maximum was found and the new extreme value relevant to the pedal position was noted. Within the Arduino code, the new minimum and maximum analog read values were scaled from 0-100 to represent 0%-100% deflection.
V. SIGNAL PROCESSING
LabView is an electrical simulation and data display software produced by National Instruments. The software utilizes graphical code to ease the process of programming its functions. The LabView Front Panel is functioning as the graphical user interface for the system shown in figure 8. It is displaying the gauges and readings of each data channel being obtained from the vehicle. LabView receives a custom string of bits over a serial COM port and imports the string into this program.
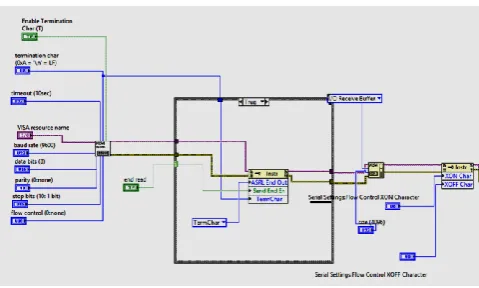
Figure 8 Systems Graphical User Interface
Figure 9 The Block Diagram (VISA function) After the string data was obtained through the designated COM port and the VISA function shown in figure 9, it was later sent to be processed and dissected into its intended custom sections. Each section starts at an offset value and extends to a designated length. The offset determines how many bits from the beginning of the string shall be skipped, and the length determines the bit count of usable data for a specific channel. The string section is then processed and then sent to be displayed.
VI. SYSTEM IMPACT A. Suspension
The design relies heavily on dynamics simulations performed on specific software. Data acquired from these simulations are then saved and reference for future designs. However, with the introduction of a data acquisition system incorporated into the FSAE car, real time data can be analyzed and collected to improve the handling of the car. Sensors such as the shock, the linear variable differential transformer (LVDT) and accelerometer will display what roll gradient the car experiences when driving around sharp corners and can be adjusted for quicker or slower damper response. Based on data collected, different suspension setups can be prepared ahead of time for each dynamic event at the FSAE Michigan event. The addition of a data acquisition system will aid in verifying computer simulation designs and provide data to improve immediate handling as well as future suspension designs.
B. Drive Train
The data acquisition system not only helps fine-tune and adjust the mechanical systems of the vehicle, it will also allow the FSAE team to diagnose any faults that may occur especially the ones that may lead to catastrophic failures. For instance, detecting abnormally high engine temperature readings or low oil pressure readings at the right time can help avert a major engine failure.
VII. CONCLUSION
In summary, the time, labor, and funds that contributed to the construction of the telemetry and data acquisition system resulted in a functional system that returns reliable data. This system allowed for the monitoring of multiple parameters of the vehicle. From the data gathered, Purdue Northwest Motorsports could make necessary adjustments to the suspension system and the drive train system as well
as detect and predict mechanical failures before they occur. It also provided the opportunity in making suggestions to the driver to improve their performance. The overall cost of this system was $1553.84. Though slightly over budget, the creation of this system proves that a functional telemetry system can be made in-house at an affordable price with outstanding functionality.
Each part and process has an average price that is used for creating this standardized cost report. The cost of this system, based on these values, is then compared to the cost of other telemetry systems on the FSAE cars.
REFERENCES
[1] AiM Infotech. (n.d.). Car/Bike Linear Potentiometer Diameter 13. Retrieved December 20, 2016, from AiM
Sportline:
http://www.aim-sportline.com/download/doc/eng/sensors/Datasheet_CarBike LinearPotentiometer13_100_eng.pdf.
[2] AiM Infotech. (n.d.). Rotary Potentiometer for Car/Bike/Kart.
Retrieved December 20, 2016, from AiM Sportline:
http://www.aim-sportline.com/download/doc/eng/sensors/Datasheet_CarBike RotatoryPotentiometerSteering_103eng.pdf
[3] AiM Infotech. (n.d.). Throttle Potentiometer. Retrieved January 29, 2017, from AiM Sportline: http://www.aim-sportline.com/download/doc/eng/sensors/Datasheet_CarBike RotatoryPotentiometerThrottle_103_eng.pdf
[4] Arduino. (2016). Arduino MEGA 2560 & Genuino MEGA 2560. Retrieved December 20, 2016, from Arduino: https://www.arduino.com/
cc/en/Main/ArduinoBoardMega2560
[5] Digi International Inc. (2015). XBee-Pro 900HP. Retrieved
December 20, 2016, from Digi:
https://www.digi.com/pdf/ds_xbeepro900hp.pdf
[6] DROK. (2013, March 22). DROK LM2596 Numerical Control Voltage Switching Regulator DC Buck Converter . Retrieved from Amazon: https://www.amazon.com/DROK-
Numerical-Switching-Regulator-adjustable/dp/B00BYTEHQO
[7] Electronics-Salon. (2013). DIN Rail Mount Screw Terminal Block Adapter Module, For Arduino MEGA-2560 R3. Retrieved from Electronics-Salon: http://www.electronics-salon.com/index.php?route=product/product&product_id=547 18
[8] Eyourlife. (2014, December 23). Eyourlife Universal 100PSI Pressure Transducer Sender Solenoid. Retrieved January 28, 2016, from Amazon: https://www.amazon.com/Eyourlife-Universal-Pressure-Transducer-Solenoid/dp/B00RCPDPRQ [9] NKC Electronics. (2015, June 4). Sparkfun CAN-BUS Shield
for Arduino and Compatibles. Retrieved December 20, 2016,
from Amazon.com:
https://www.amazon.com/gp/product/B00YUUOVSS/ref=oh_ aui_detailpage_o00_s02?ie=UTF8&psc=1
[10]Seeed Development Limited. (2016). UartSBee V4. Retrieved December 20, 2016, from SeeedWiki: https://seeeddoc.github.io/UartSBee_V4/