Molecular Dynamics Analyses of Deformation Behavior
of Long-Period-Stacking-Ordered Structures
Ryosuke Matsumoto
+, Masayuki Uranagase and Noriyuki Miyazaki
Department of Mechanical Engineering and Science, Graduate School of Engineering, Kyoto University, Kyoto 615-8246, Japan
Magnesium alloys containing long-period-stacking ordered (LPSO) phases have attracted considerable attention because they have been reported to exhibit excellent mechanical properties, including high strength and reasonable ductility. It is thought that the LPSO phase plays a critical role in producing these favorable mechanical properties. We analyze the deformation behavior of the LPSO phases with different stacking sequences using molecular dynamics simulations. To highlight the specific deformation behavior of the LPSO phases, we also perform deformation analyses of hexagonal-close-packed and face-centered-cubic (FCC) structures. We focus on the influence of the stacking order rather than the segregated atoms around the FCC-structured layers, and we model an LPSO structure by single element composition where the interatomic interaction is described by a smoothed Lennard-Jones potential. Our simulations indicate that an LPSO structure with a shorter stacking sequence tends to exhibit a higher compressiveflow stress, because FCC-structured layers inhibit twinning deformations and non-basal slips. Kinking deformation is observed for an LPSO structure when both compression and shear deformation are present. It is shown that the first-order pyramidal-hcþaidislocation disarranges the stacking of an LPSO structure and leaves behind many lattice defects. In addition, those lattice defects activate numerous basal slips. Finally, basal dislocations arrange in a line and generate a misorientation angle. Furthermore, this angle originates the compressive deformation. We also observed some prismatic-haidislocations and cross slips to the basal plane. These results suggest the importance of non-basal slips for kinking deformation. [doi:10.2320/matertrans.MI201211]
(Received November 16, 2012; Accepted January 17, 2013; Published March 8, 2013)
Keywords: molecular dynamics simulation, long-period-stacking-ordered structure, magnesium, kinking deformation, twinning deformation, dislocation, slip system
1. Introduction
Because Magnesium (Mg) is the lightest structural metal, one would expect it to be used in various industrial applications. However, poor ductility and formability of regular Mg alloys have severely restricted their application potential. Recently developed Mg alloys that contain long-period-stacking-ordered (LPSO) phases, called Mg/LPSO two-phase alloys, have attracted considerable attention because they have been reported to exhibit excellent mechanical properties, including high yield stress and reasonable ductility.15) For example, the Mg97Zn1Y2 alloy
with the Mg/LPSO two-phase structure fabricated by a non-equilibrium, rapid solidification process exhibits outstanding strength above 480 MPa and an elongation of 5 to 16%.1)It is thought that the LPSO phase plays a critical role in producing those excellent mechanical properties.5) Some literatures
show that the LPSO phases yield by kinking deformation under compression,68)while conventional Mg alloys with a hexagonal close-packed (HCP) structure yield by twinning deformation. It is assumed that the kinking deformation is caused by the nucleation of many basal dislocation pairs and their motion in the opposite direction.9)However, the detailed
mechanisms of kinking deformation, e.g., dislocation source for the massive nucleation of basal dislocations, have not yet been clarified.
This study aims to obtain a microscopic picture of the kinking deformation of the LPSO phase and to reveal the relationship between kinking deformation and novel mechan-ical properties of LPSO alloys. We analyzed the deformation behavior of the LPSO phases with different stacking sequences using molecular dynamics (MD) simulations. To
highlight the specific deformation behavior of the LPSO phases, we also performed deformation analyses of HCP and face-centered-cubic (FCC) structures.
2. Calculation Method and Simulation Model
2.1 Modeling of LPSO phases
Various polytypes of LPSO structures such as 10H (hexagonal), 18R (rhombohedral), 14H and 24R have been observed.10,11) A conventional Mg alloy has an HCP structure, and it has a two-layer periodic structure with basal plane stacking, generically expressed as AB, AB, AB, +. Conversely, for example, LPSO structures with 18R stacking have 18-layer periodic structures described as
ABAB-ABCACACABCBCBC, ABABABAB-ABCACACABCBCBC,+.
Namely, LPSO structures have a long period stacking order with FCC-structured layers, i.e., ABC stacking, in HCP structures. Furthermore, LPSO structures also have a chemi-cal order with segregation of added elements such as Zn and Y in FCC-structured layers.2,1214)Thus, the mechanical properties of LPSO structures are supposedly influenced by both their stacking order and chemical order.
Conversely, when performing MD simulations, the interatomic potentials of the constituent atoms and detailed atomic configuration of the initial structure are required. However, as far as is known, the interatomic potential of a ternary system that exhibits an LPSO phase is not available, and the development of a reliable potential is extremely difficult. Furthermore, detailed configurations of added elements in FCC-structured layers are known only for a limited number of systems.1214) For these reasons and for simplification, we focused on the influence of the stacking order rather than the chemical order, and we modeled LPSO structures by single element composition.
+Corresponding author, E-mail: matsumoto@solid.me.kyoto-u.ac.jp
2.2 Interatomic potential
So far, some interatomic potentials of Mg have been proposed. They include the embedded-atom-method (EAM) potential by Sun et al.,15) Pasianot and Savino,16) and Liu et al.,17)the modified EAM potential by Baskeset al.,18)and the generalized EAM potential developed by Zhou et al.19) Some of these potentials are applicable to deformation analyses of Mg lattices.20) However, if we employed an
interatomic potential of Mg, FCC-structured layers in LPSO structures easily disappear under a small resolved shear stress along a basal-slip direction by generating partial dislocation pairs because an FCC structure (or a stacking fault in HCP structures) is not global stable.
In this study, we employ a smoothed Lennard-Jones (SLJ) potential, which is a modified form of the conventional 12-6-type Lennard-Jones (LJ) potentialºLJ, to fulfill the continuity
of the potential energy and itsfirst derivative,º0LJ¼dºLJ=dr,
at the cut-off distancerc.21,22)The interaction energy between
two atoms is expressed as follows.
ºSLJðrÞ ¼ºLJðrÞ ºLJðrcÞ ðrrcÞº0LJðrcÞ
ºLJðrÞ ¼¾ r0
r 12 2 r0 r 6
: ð1Þ
Hereris an interatomic distance, and¾ andr0 are potential
parameters to determine the bonding energy and fi rst-neighbor distance, respectively. The change of rc alters the
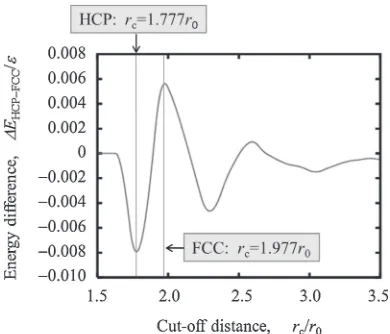
number of interacting atoms and the potential curve itself, and thus, the energy difference between HCP and FCC structures (¦EHCPFCC=EHCP¹EFCC) varies depending
onrc.¦EHCPFCCdetermines stability of structures. Figure 1
shows the relationship between¦EHCPFCCandrc. Hence, we
use rc=1.740r0, where ¦EHCPFCC/¾ is the smallest, for
atoms in HCP layers at an initial state (initial HCP atoms), and rc=1.936r0, where ¦EHCPFCC/¾ is the largest, for
atoms in FCC layers at an initial state (initial FCC atoms), and we obtain stable LPSO structures.¾is defined such that the maximum bonding energy between two atoms corre-sponds to that of the LJ potential of Mg (0.256©10¹19J (0.16 eV)).23,24) We employed r
0=0.3184 nm, which is the first-neighbor distance of HCP-structured Mg,15) for both
the initial HCP and FCC atoms. We defined the potential
parameters between the initial HCP and FCC atoms as follows.
rc FCCHCP ¼
ðrc FCCþrc HCPÞ
2 ¾FCCHCP ¼ ffiffiffiffiffiffiffiffiffiffiffiffiffiffiffiffiffiffiffiffiffiffiffiffi¾FCC¾HCP
p
[image:2.595.71.266.69.236.2]ð2Þ
Table 1 shows the potential parameters. We employed the atomic mass of Mg (m=4.036©10¹26kg) for all atoms.
Although a structural change occurs between the HCP structure and FCC structure, or FCC structure and HCP structure, during the deformation simulations, we do not change the potential parameters in accordance with the local structure, as is the case in conventional MD simulations, but use potential parameters for the initial structure. This is because it is thought that the FCC-structured layers in LPSO structures are stabilized by added elements such as Zn and Y, and those atoms rarely diffuse during deformation.
The energy difference between an HCP and FCC structure ®¦EHCPFCC® is ¹2.724©10¹22J/atom (¹0.0017 eV/atom) for the initial HCP atom and 1.602©10¹22J/atom (0.0010 eV/atom) for the initial FCC atom, respectively. These values are almost 1/10 of the value for the actual Mg atom (2.083©10¹21J/atom (0.013 eV/atom)15)).
2.3 Initial structures
We analyzed the deformation behavior of the LPSO phases with different stacking sequences, i.e., 10H, 18R, 14H and 24R, using MD simulations. The interlayer spacing between two FCC-structured layers is the closest in 10H (3 HCP-structured layers), and becomes sparser in the order corresponding to 18R (4 HCP-structured layers), 14H (5 HCP-structured layers) and 24R (6 HCP-structured layers). To highlight the specific deformation behavior of the LPSO phases, we also performed deformation analyses of HCP and FCC structures.
For the construction of LPSO-structure and HCP-structure models, we periodically arranged those unit structures11)
whose basal plane is parallel to the y-z plane and a basal slip direction is along theydirection (i.e., [0001] (orc-axis) is along the x direction, [1120] (or a-axis) is along the y direction, and [1100] is along the zdirection). For the FCC-structure model, we set a slip plane (111) parallel to the y-z plane and a slip direction [110] along the y direction. Figure 2 shows the simulation model with an LPSO structure with 18R stacking. All simulation models have dimensions lxµ18.1 nm, lyµ31.8 nm and lzµ18.7 nm, and they are constructed from about 490000 atoms. No periodic boundary condition is applied, and thus, the calculation models have a square-pillar shape.
[image:2.595.304.549.86.147.2]Fig. 1 Energy difference between HCP and FCC structures obtained by SLJ potential with different cut-off distances.
Table 1 Parameters for SLJ potential.
First-neighbor distance,
r0/nm
Bonding energy, ¾/10¹20J(/eV)
Cut-off distance,
rc/ro
HCP-HCP
0.3184
3.408 (0.2127) 1.740
FCC-FCC 3.001 (0.1873) 1.936
[image:2.595.364.489.220.256.2]2.4 Relaxation and deformation conditions
The boundary regions were defined as the upper and bottom four layers along the ydirection as shown in Fig. 2, and the x and y directional motions of the atoms in the boundary regions were constrained. The time integration was performed by the velocity Verlet algorithm using a time step ¦t=2 fs. The temperature was controlled at 300 K by the velocity scaling method in all MD simulations.
We performed relaxation during 63 ps under the fixed boundary. During the relaxation, the atomic velocity of all atoms was reset every 6 ps to remove vibration, and the model sizes were scaled such that the average stresses were reduced to zero.
We defined the deformation direction using the parameters ¡¼ £_xy=¾_yy, where £_xy and ¾_yy are the shear and tensile strain rates, respectively. Following the relaxation, the simulation models were deformed by giving all atoms x and y directional displacements at each time step, which correspond to¡=0 or 4 under the constant equivalent strain rate¾_eq=108 or 109s¹1.
3. Results and Discussion
3.1 Overview of deformation behavior
In this section, we give brief overview of simulations results, and classify deformation behavior into four typical deformation modes. The detailed deformation process of each deformation mode and relation with stressstrain curve are given in the following sections.
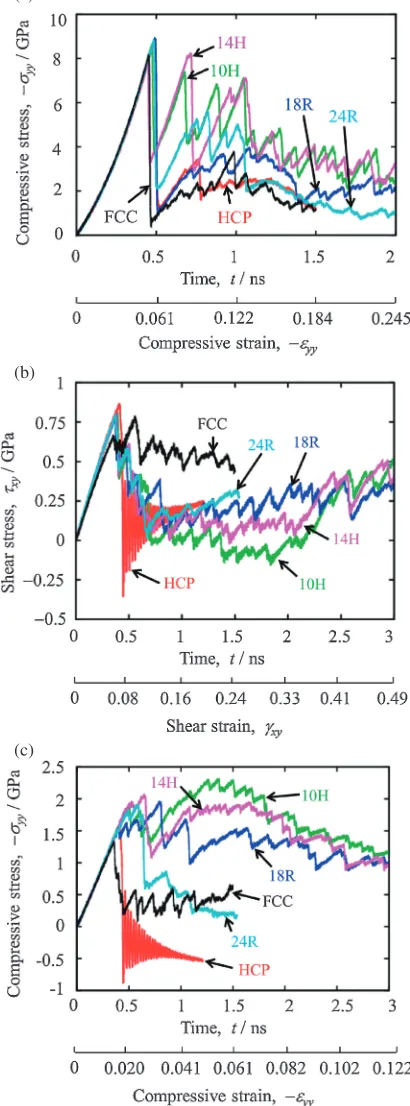
Figure 3 shows the stressstrain curves under the equiv-alent strain rate _¾eq=108s¹1. Although a quantitative
discussion is difficult because of the extremely high strain rates employed in the MD simulations and the absence of initial lattice-defect conditions, we can qualitatively discuss the influence of FCC-structured layers on the deformation resistance. It is clearly shown that a gradual stress change with typical serration is observed in the stressstrain curves of LPSO structures (especially 10H and 14H in Fig. 3(a) and 10H, 18R and 14H in Fig. 3(c)). Conversely, the compressive stress of the HCP structure sharply decreases to small magnitude after yielding and keeps small order. A rapid oscillation of stress is also observed for the HCP structure under ¡=4 (Figs. 3(b) and 3(c)). This is because FCC-structured layers inhibit twinning deformations, and LPSO
structures mainly exhibit kinking deformation or deformation by non-basal dislocations, while the HCP structure deforms by the catastrophic propagation of twinning deformation, as shown later.
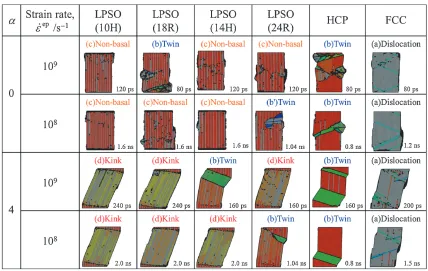
Figure 4 presents the typical deformation state at each deformation condition in tabular form. To visualize the atomic structure, wefirst use common neighbor analysis25)to
Fig. 2 Initial structure (Three-dimensional LPSO model with 18R stacking order).
(a)
(b)
(c)
Fig. 3 Comparison of stressstrain curves under equivalent strain rate of _
¾eq=1©108s¹1 ((a) Compressive stressstrain relation under ¡=0,
[image:3.595.60.280.69.213.2] [image:3.595.324.529.79.632.2]categorize the atoms according to the local structure into (i) HCP-structured atoms, (ii) FCC-structured atoms, and (iii) defect atoms that have a structure other than that of the HCP and FCC structures. For (i) HCP-structured atoms, we defined the c-axis ([0001]) using the positional relationship of six second neighbor atoms and estimated the angle ¤ between the projection vector of the c-axis on the x-yplane and xdirection. Next, the HCP-structured atoms are colored according to«¤«, i.e., red, green and blue indicates«¤«=0, 45 and 90°, respectively, and continuous RGB coloring is used for intermediate angles. (ii) FCC-structured atoms and (iii) defect atoms are shown in gray and black color, respectively. In Fig. 4, we find four typical deformation modes; i.e., (a) dislocation-based deformation in FCC structures (indicated as “(a) Dislocation” in the figure), (b) twinning deformation mainly observed in HCP structures (indicated as“(b) Twin” or“(bA) Twin”), (c) deformation mainly caused by non-basal dislocations in LPSO structures under pure compression (¡=0) (indicated as “(c) Non-basal”), and (d) kinking deformation observed in LPSO structures under compression plus shear deformation (¡=4) (indicated as“(d) Kink”). The deformation behavior of FCC structures has been sufficiently studied in the past. Here we will focus on (b) twinning deformation, (c) deformation by non-basal dislocations, and (d) kinking deformation. In the following sections, we discuss the deformation processes and relationships with the stressstrain curve.
3.2 Twinning deformation
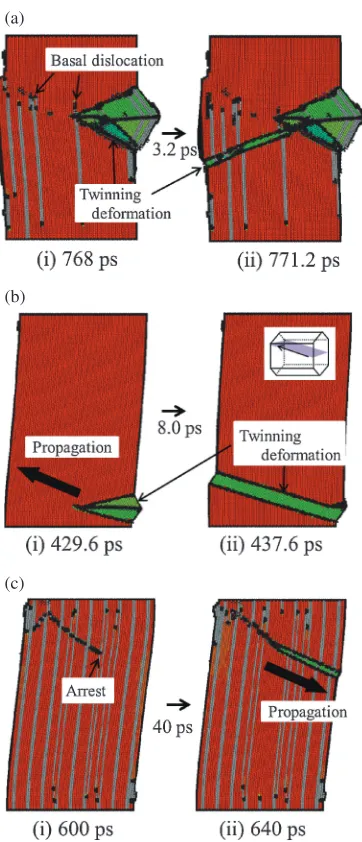
Figure 5 shows the typical twinning deformation process. For HCP structures, twinning deformation was observed for
all deformation conditions including the boundary condition where the resolved shear stress in the basal-slip direction became large (¡=4), and the propagation was catastroph-ically fast. It takes only a few picoseconds to cross the simulation model (Figs. 5(a) and 5(b)), and the correspond-ing stress drop is observed in the stressstrain curves (³0.77 ns in Fig. 3(a) and ³0.43 ns in Figs. 3(b) and 3(c)). Because the twin boundaries migrate easily, the stressstrain curves oscillate around a small magnitude of stress when the twinning band completely crosses the model as shown in Fig. 5(b)(ii). Twinning deformation was also observed in the deformed LPSO structures under some deformation conditions. The initiation condition of twinning deformation in LPSO structures is not clear from the present simulations. However, it is confirmed that twinning deformation tends to be inhibited in an LPSO structures with a higher density of FCC-structured layers (e.g., no case for 10H stacking and two cases for 24R stacking as shown in Fig. 4). Figure 5(c) shows the twinning deformation that occurred in the LPSO structure with 24R stacking under ¡=4 and
_
¾eq=108s¹1. The leading edge of the twinning deformation
was frequently arrested at FCC-structured layers, and the propagation was much slower than that in the HCP structure. Furthermore, after the twinning region crossed the whole model, the migration of twin boundaries in the LPSO structures was also slower than that in the HCP structure. These results indicate that FCC-structured layers impede twinning deformations (both propagation and migration of twin boundary). The twinning system was detected except for the LPSO structure with 24R stacking that was deformed under ¡=0 and ¾_eq=108 (indicated as “(bA) Twin” in
[image:4.595.84.512.67.338.2]Fig. 4). The twinning boundary was{1121}and the twinning direction was (1/3) h1126i. This twinning boundary and direction agrees with the recent report by Inuiet al.26)
3.3 Deformation by non-basal dislocations
Deformation by non-basal dislocations was observed in LPSO structures deformed under pure compression (¡=0) except when they deformed by twinning (i.e., 10H, 14H and 24R stacking deformed under _¾eq=109, and 10H, 18R and
14H stacking deformed under ¾_eq=108). The compressive
stress in these cases is higher than that in the HCP structure that underwent twinning deformation (Fig. 3(a)). Figure 6 shows the typical deformation process by non-basal dis-locations observed in LPSO structures with 10H stacking deformed under ¡=0 and ¾_eq=108s¹1. The
deforma-tion was mainly caused by prismatic-hai dislocations (f1010gh1210i) (see Fig. 6(i)). Although the resolved shear
stress along the basal-slip direction is ideally zero, some basal dislocations ((0001) h1120i), which are decomposed into
partial dislocations, appeared (Figs. 6(ii), 6(iii) and 6(iv)). These basal dislocations were mainly generated through the cross slip of the screw component of the prismatic-hai dislocation as shown in Fig. 6(ii), and thus those perfect dislocations includes screw component. The migration of screw component of the prismatic-hai dislocation was frequently arrested when they cross FCC-structured layers. This trapping of dislocation migration at FCC-structured layers probably enhances the cross slip of prismatic-hai dislocation to the basal plane.
3.4 Kinking deformation
Kinking deformation, in which many basal dislocations nucleate and those dislocations originate the compressive deformation by generating a misorientation angle by arranging in a line, was observed in LPSO structures deformed under ¡=4 except when they deformed by twinning deformation (i.e., 10H, 18R and 24R stacking deformed under¾_eq=109, and 10H, 18R and 14H stacking
deformed under ¾_eq=108). For these cases, as shown in
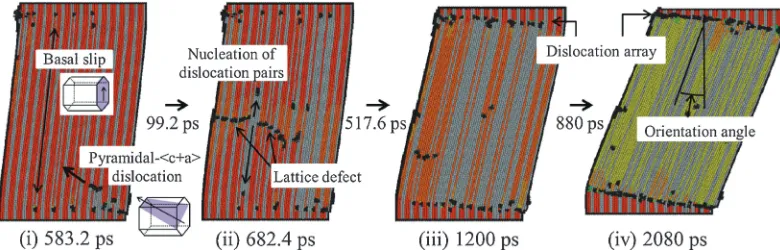
Fig. 3(c), the compressive stress after yielding is at a much higher level compared with the cases of structures deformed by other deformation modes (LPSO structures with 24R stacking, HCP structures, and FCC structures). Figure 7 shows the typical kinking-deformation process observed in LPSO structures with 10H stacking deformed under ¡=4 and ¾_eq=108s¹1. At the initial stage of the deformation,
nucleations of some partial dislocations on basal plane are observed (Fig. 7(i)). We confirmed that these dislocations were generated from free surfaces normal to the z-axis by forming arc-like loops. It is thought that these basal slips at the beginning of deformation were simply activated by the high resolved shear stress because the shear stress becomes very high under ¡=4. After the compressive stress sufficiently increased, the non-basal slip caused by fi rst-order pyramidal-hcþai dislocations (f1011gh1123i) was observed (Figs. 7(i) and 7(ii)). Since the pyramidal disloca-tion migrates across FCC- and HCP-structured layers, it shows stop-and-go motion and the migration velocity is slow. Interestingly, the pyramidal dislocation disarranges the stacking of LPSO structures and leaves behind many lattice defects in a line (Figs. 7(i) and 7(ii)). Furthermore, those lattice defects migrate on the basal plane and split into two partial dislocations moving in opposite directions (Figs. 7(ii) and 7(iii)). Hence, although FCC-structured layers inhibit non-basal slips, once the pyramidal-hcþai dislocation moves, it activates numerous basal slips. Then, many basal dislocations are aligned along the upper and lower bounda-ries, and they generated a misorientation angle as if the edge dislocations formed tilted grain boundaries. Finally, the misorientation angle originates the compressive deformation. We also observed some prismatic-haidislocations, and cross slip to the basal plane, similar to the compressive deformation shown in the previous section. It has been reported that dislocations associated with a kink boundary in Ti3SiC2
deformed at room temperature also have both edge and screw components.27)
As shown in Fig. 3(b), the shear stress is very small except at the beginning of the deformation. This result indicates that basal dislocations nucleate easily from lattice defects (a)
(b)
(c)
Fig. 5 Structure change during twinning deformation: (a) hcp structure deformed under ¡=0 and ¾_eq=108s¹1, (b) hcp structure deformed
under ¡=4 and _¾eq=108s¹1, (c) LPSO structure with 24R stacking
[image:5.595.79.260.67.488.2]generated by the non-basal dislocations. Furthermore, the serration in the compressive stressstrain curves (Fig. 3(c)) generally corresponds to the intermittent migration of the pyramidal dislocation and nucleation of basal dislocations, and the gradual decrease of compressive stress corresponds to the increase in the misorientation angle at kink boundaries.
We also performed deformation analyses for quasi three-dimensional models as a preliminary study; the models have a plate shape with a small thickness (µ1.7 nm), and a periodic boundary condition is applied along the z-axis. Out-of-plane deformation cannot operate under this boundary condition, and we only observed twinning deformation in both HCP and LPSO structures. This result indicates the importance of non-basal slips for the kinking deformation of LPSO structures.
4. Conclusion
We analyzed the deformation behavior of the LPSO phases with different stacking sequences (10H, 18R, 14H and 24R) using MD simulations. We modeled LPSO structures by single element composition in which atoms interact via the SLJ potential. To highlight the specific deformation behavior of the LPSO phases, we also performed deformation analyses of HCP and FCC structures.
(1) An LPSO phase with a shorter stacking sequence tends to exhibit a higher compressive maximum stress, because FCC-structured layers inhibit twinning defor-mations and non-basal slips.
(2) The HCP structure deforms by the catastrophic propagation of twinning deformation, and the stress sharply decreases to small magnitude under all
deformation conditions analyzed herein. Twinning deformation is also observed in deformed LPSO structures under some deformation conditions. The leading edge of twinning deformation is frequently arrested at FCC-structured layers, and the propagation in LPSO structures become much slower than that in the HCP structure.
(3) LPSO structures are mainly deformed by prismatic-hai dislocations under the pure compression. The prismatic-haidislocations are frequently arrested when they cross FCC-structured layers, and a lot of cross slips of the screw component of the prismatic-hai dislocations to the basal plane occur.
(4) Kinking deformation is observed for LPSO structures when both compression and shear deformation are loaded. It is shown that first-order pyramidal-hcþai dislocations disarrange the stacking of LPSO structures and leave behind numerous lattice defects arranged in a line. Those lattice defects activate many basal slips. Finally, basal dislocations align and generate a misorientation angle, and this angle starts the compres-sive deformation. Some prismatic-hai dislocations and cross slip to the basal plane are also observed. These results suggest the importance of non-basal slips for the kinking deformation of LPSO structures.
Acknowledgments
This work was supported by a Grant-in-Aid for Scientific Research on Innovative Areas “Synchronized Long-Period Stacking Ordered Structure’’from the Ministry of Education, Culture, Sports, Science and Technology (MEXT) of Japan. Fig. 6 Deformation process by non-basal dislocations (LPSO structure with 10H stacking deformed under¡=0 and¾_eq=108s¹1).
[image:6.595.101.496.70.201.2] [image:6.595.102.492.242.367.2]REFERENCES
1) Y. Kawamura, K. Hayashi, A. Inoue and T. Masumoto:Mater. Trans.
42(2001) 11721176.
2) E. Abe, Y. Kawamura, K. Hayashi and A. Inoue:Acta Mater.50(2002) 38453857.
3) M. Yamasaki, M. Sasaki, M. Nishijima, K. Hiraga and Y. Kawamura:
Acta Mater.55(2007) 67986805.
4) Y. Kawamura and M. Yamasaki:Mater. Trans.48(2007) 29862992.
5) M. Yamasaki, K. Hashimoto, K. Hagihara and Y. Kawamura: Acta Mater.59(2011) 36463658.
6) T. Itoi, K. Takahashi, H. Moriyama and M. Hirohashi:Scr. Mater.59
(2008) 11551158.
7) K. Hagihara, N. Yokotani and Y. Umakoshi:Intermetallics18(2010) 267276.
8) X. H. Shao, Z. Q. Yang and X. L. Ma:Acta Mater.58(2010) 4760 4771.
9) J. B. Hess and C. S. Barrett: Trans. Am. Inst. Min. Metall. Eng.185 (1949) 599606.
10) M. Matsuda, S. Ii, Y. Kawamura, Y. Ikuhara and M. Nishida:Mater. Sci. Eng. A393(2005) 269274.
11) E. Abe, A. Ono, T. Itoi, M. Yamasaki and Y. Kawamura:Philos. Mag. Lett.91(2011) 690696.
12) H. Yokobayashi, K. Kishida, H. Inui, M. Yamasaki and Y. Kawamura:
Acta Mater.59(2011) 72877299.
13) D. Egusa and E. Abe:Acta Mater.60(2012) 166178.
14) K. Kishida, H. Yokobayashi, H. Inui, M. Yamasaki and Y. Kawamura:
Intermetallics31(2012) 5564.
15) D. Y. Sun, M. I. Mendelev, C. A. Becker, K. Kubin, T. Haxhimali, M. Asta, J. J. Hoyt, A. Karma and D. J. Srolovitz:Phys. Rev. B73(2006) 024116.
16) R. Pasianot and E. J. Savino:Phys. Rev. B45(1992) 1270412710.
17) X. Y. Liu, J. B. Adams, F. Ercolessi and J. A. Moriarty:Model. Simul. Mater. Sci. Eng.4(1996) 293303.
18) M. I. Baskes and R. A. Johnson: Model. Simul. Mater. Sci. Eng.2
(1994) 147163.
19) X. W. Zhou, R. A. Johnson and H. N. G. Wadley:Phys. Rev. B69
(2004) 144113.
20) J. A. Yasi, T. Nogaret, D. R. Trinkle, Y. Qi, L. G. Hector, Jr. and W. A. Curtin:Model. Simul. Mater. Sci. Eng.17(2009) 055012.
21) R. Matsumoto and N. Miyazaki:Scr. Mater.59(2008) 107110.
22) R. Matsumoto and M. Nakagaki:Model. Simul. Mater. Sci. Eng.14
(2006) S47S54.
23) Y. Minonishi, S. Ishioka, M. Koiwa, S. Morozumi and M. Yamaguchi:
Philos. Mag. A43(1981) 10171026.
24) S. Ando, T. Gotoh and H. Tonda: Metall. Mater. Trans. A33(2005) 823829.
25) J. D. Honeycutt and H. C. Andersen:J. Phys. Chem.91(1987) 4950 4963.
26) Private communication with H. Inui.