Microstructural Evolution and Mechanical Response of the Surface
of 18CrNiMo7-6 Steel after Multistep Shot Peening during Annealing
Peng Fu
1,2, Chuanhai Jiang
1,+and Vincent Ji
31School of Materials Science and Engineering, Shanghai Jiao Tong University, Shanghai 200240, P. R. China 2School of Materials Science and Engineering, Liaocheng University, Liaocheng 252059, P. R. China 3LEMHE/ICMMO, UMR 8182, Université Paris-Sud 11, 91405 Orsay, France
The variations of micro-structure, residual stress and micro-hardness for 18CrNiMo7-6 steel after triple shot peening (SP) against annealing temperature were studied. X-ray diffraction line profile analysis (XRDLPA) was used to identify the change of micro-structure and residual stress relaxation behaviors of the top surface for 18CrNiMo7-6 steel after SP. The results show that the micro-strain, dislocation density, stored energy, compressive residual stress (CRS) and micro-hardness of the top surface of 18CrNiMo7-6 steel after SP decrease with the increase of annealing temperature while the domain size increases with increasing annealing temperature. Meanwhile, the change rates of micro-structure the residual stress and micro-hardness are bigger at higher annealing temperatures. [doi:10.2320/matertrans.M2013287]
(Received July 29, 2013; Accepted September 3, 2013; Published November 9, 2013)
Keywords: shot peening, line profile analysis, residual stress relaxation, micro-structure, micro-hardness
1. Introduction
18CrNiMo7-6 is a Chrome-Nickel-Moly carburising steel; it is widely used in many industrial components such as heavy-duty arbors, bushings, bearings, gears, shafts, sprockets, wear pins etc.1,2) This kind of material requires
the hard surface layer, so mechanical surface treatment is often used to improve the surface quality and shot peening
(SP) is one of the most commonly used methods.3,4) In the
process of SP, the impact indentations of the shot induce local plastic deformation at the surface, which can create
the beneficial compressive residual stress (CRS), increase
the dislocation population and induce both the micro-structure change and work hardening near the surface
layer.57) The CRS, microstructure refinement and work
hardening produced in the peened layer can improve the fatigue life of the material.811) In our previous work,12) the authors have reported that triple SP with the intensity
of 0.50+0.30+0.15 mmA can more efficiently refine
the micro-structure, improve the CRS, micro-strain and micro-hardness of 18CrNiMo7-6 steel. In this work, the
18CrNiMo7-6 steel after triple SP with intensity of 0.50+
0.30+0.15 mmA is used as the research object.
Now, the researches about 18CrNiMo7-6 steel have almost focused on the mechanical property and micro-structure characterization at ambient temperature.3,4,12,13) But little
investigation was made on the characterization about the recovery, recrystallization behavior and thermostability of 18CrNiMo7-6 steel after SP at increased temperatures.
Meanwhile, X-ray diffraction line profile analysis (XRDLPA)
is a well-known reliable and non-destructive technique. It is widely used to characterize the residual stress, crystallite size, micro-strain, dislocation density, stored energy, etc.1420) Therefore, in this study XRDLPA was used to identify the change of micro-structure and relaxation behavior of residual stress on the top surface of 18CrNiMo7-6 steel after triple SP during the isothermal annealing.
2. Experimental
2.1 Materials
The studied samples are manufactured from case-hardened steel 18CrNiMo7-6 (EN 10084). The chemical composition of 18CrNiMo7-6 steel is: 0.170 C, 0.190 Si, 0.560 Mn, 1.520 Ni, 1.650 Cr, 0.320 Mo, 0.006 P, 0.003 S,
0.028 Al, 0.020 Cu, 0.002 Sn and the balance Fe (mass%).
All specimens (15©15©7 mm) were austenitized at 950°C
for 50 h, subsequently heated at 860°C for 2 h and quenched in oil, followed by tempering at 180°C for 3 h and cooling in air.
2.2 SP and isothermal annealing treatment
In this study, SP treatments with the intensity of
0.50+0.30+0.15 mmA were performed on an air blast
machine (Carthing Machinery Company, Shanghai). The intensities of SP were measured by the arc height of Almen specimen (A type). The diameter of peening nozzle was 15 mm and the distance between the nozzle and the sample was 100 mm. Triple SP is to go through SP treatment one by one for three times on the same surface of a sample with different SP intensities and shots. First, the sample were SP treated with the intensity of 0.50 mmA and cast steel balls, then treated again under the intensity of 0.30 mmA and cast steel balls, at last, the same surface were treated under the intensity of 0.15 mmA and ceramic shots. The triple SP treatments can not only strengthen the sample surface but also make the surface smoother after dual SP, so lower SP intensities or smaller shots were select to carry out on the second and third SP treatments. Cast steel balls with a
diameter of 0.6 mm and a hardness of 610 HV and Al2O3
ceramic balls with a diameter of 0.3 mm and a hardness of 700 HV were selected as shot media in SP technologies. The
coverage of SP was 100%.
After SP treatment, isothermal annealing treatments were
carried out by annealing flat specimens with temperatures
between 200 and 650°C for annealing times of 5 min, respectively. During annealing, the samples were buried in
+Corresponding author, E-mail: chjiang_sjtu@126.com
the alumina powders for uniform thermal environment. After cooling in air, the mechanical properties and micro-structures of all specimens were measured and analyzed by various measurements.
2.3 Measurements and calculations
X-ray diffraction (XRD) patterns were measured by the
Rigaku Ultima IV diffractometer (CuK¡ radiation) with a
D/tex1D high-speed detector. The voltage, current, scanning
velocity and step were 40 kV, 30 mA, 2°/min and 0.02°,
respectively. The K¡2 components of the Cu radiation
were eliminated and the backgrounds were corrected when analyzing.
The residual stresses of the samples were measured by
X-ray stress analyzer (LXRD, Proto, Canada) with Cr K¡
radiation (Nifilter). The residual stress tests were conducted
according to ASTM standard E915-10.21) The voltage and
current were 30 kV and 25 mA, respectively. The shifts of
BCC {211}¡ peaks were detected in the measurements and
then the residual stress was determined using the sin2¼
method.22,23) The peaks of {211}¡ lattice plane were
measured at a high 2ª value of 156.4°, and the elastic
constant of (1/2)s2=5.81©10¹6MPa¹1 was selected for
stress determination.
Moreover, the micro-hardness was measured by a Digital Micro-hardness Tester (DHV-1000, Beijing) with experimen-tal force of 1.96 N and loading time of 15 s, andfive times of each point were carried out and then the average values were selected for description. The micro-hardness tests were
executed according to ASTM standard E384-05a.24)
The observed distribution of X-ray intensity across a line is related to the distribution owing to instrumental broadening and that owing to small particle size etc., after stokes
deconvolution, the observed XRD profile hðxÞ can be
expressed by the formula (1):25)
hðxÞ ¼
Zþ1
1
gðyÞfðxyÞdy ð1Þ
wheregandfdenote instrumental and structural line profile, respectively. According to Voigt method, the relationship of integral breadth can be shown as formula (2):14,15)
¢h
C¼¢fCþ¢gC;¢h 2 G ¼¢f
2 G þ¢g
2
G ð2Þ
where subscript C and G denote the Cauchy and Gaussian components, and superscriptsh,f,gdenote the measured line profile, the structural broadened profile and the instrumental
profile, respectively. It is assumed that the Cauchy
compo-nent of thef profile is solely owing to crystallite size while the Gaussian component arises from micro-strain. In Voigt method, according to integral breaths of diffraction peaks, the domain sizes (D) and micro-strain (¾) can be calculated by formula (3):
D¼ ¢f
Ccosª
;¾¼ ¢
f G
4 tanª ð3Þ
where , ¢, ª represent the wavelength of CuK¡, integral breath and Braggangle, respectively.
According to the domain sizes and micro-strain obtained above, the dislocation densities of the surface deformation layer can be estimated by formula (4):26)
μ¼2
ffiffiffi 3
p
b h¾2i1
2
D ð4Þ
whereμrepresents the dislocation density, andbdenotes the magnitude of Burgers vector. In this study,bis the length of a unit dislocation along the{110}direction for BCC crystal so thatb ¼pffiffiffi2a; in this equations, ais the lattice parameter.
A measure of the stored energy of a deformed metal can also be found from analysis of X-ray line broadening. The stored energy owing to the stored dislocations is given as formula (5):20)
ED¼cμGb2 ð5Þ
where c is a constant of the order of 0.5, G is the shear
modulus andbis Burgers vector of a dislocation.
3. Results and Discussions
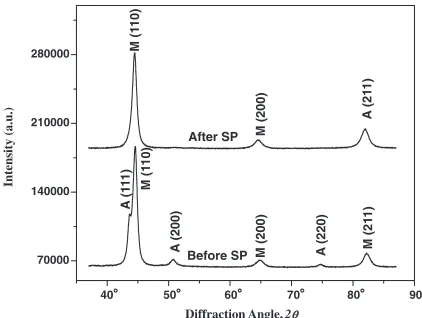
XRD patterns of the top surface of 18CrNiMo7-6 steel before and after triple SP treatments are shown in Fig. 1. It can be found that both austenite and martensite phases are found at the top surface of 18CrNiMo7-6 steel before SP treatment, and only martensite state is detected after SP, implying that the retained austenite has transformed to martensite after SP. Previous studies27,28)have demonstrated that SP treatments can not only introduce a large CRS on the surface of the SP treated sample, but also change the microstructure near the surface region. This phenomenon is accord with those previous researches.
XRD patterns of the shot peened surface of 18CrNiMo7-6 steel during annealing at different temperatures have been shown in Fig. 2. It can be found that only martensite states can be seen at different annealing temperatures. Moreover, the peak breadths decrease with the increase of annealing temperatures, which reflects the change of the microstructure on the surface of specimens at different annealing temper-ature. In order to further study the effect of annealing on the microstructure of the surface for 18CrNiMo7-6 steel after SP, the (110) peak diffraction profiles of the SP treated samples have been analyzed via XRDLPA. Figure 3 shows the normalized K¡1diffraction profiles of (110) peak of the top surface of SP treated samples after annealing at different
70000 140000 210000 280000
90° 80° 70° 60° 50°
A
(21
1)
M (200)
M (1
10)
M (21
1)
M (200)
M (1
10)
A
(220)
A
(200)
A
(1
1
1
)
Before SP
Intensity (a.u.)
Diffraction Angle, 2θ After SP
40°
[image:2.595.320.531.600.759.2]temperatures. It can be seen that the K¡1 diffraction lines become narrow obviously with increasing temperatures,
meaning that the domain size increases and/or the
micro-strain decreases with increasing annealing temperature. Moreover, it can be seen that the XRD peak positions of SP treated 18CrNiMo7-6 steel at different annealing temper-atures shift with small amplitude. These shifts can be attributed to the different residual stress existing in different annealing temperatures.29)
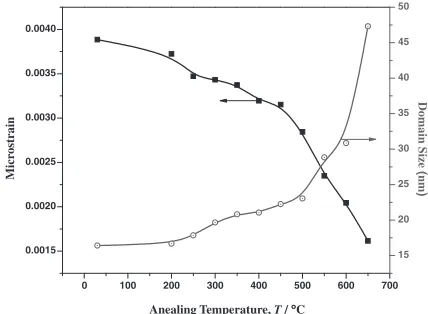
In order to quantify the breath of K¡1diffraction profiles of specimens, Voigt method was used to calculate the integral breathes of the top surface of SP treated samples during annealing at different temperatures, and the results were shown in Fig. 4. Then, domain size and micro-strain of the top surface of SP treated samples at different annealing temperature can be calculated according to the formulas (2) and (3), and the results were shown in Fig. 5. It can be observed from Fig. 4 that both Cauchy and Gaussian breadth decrease with increase of annealing temperatures which indicate that the domain sizes increase and micro-strains decrease with increase of annealing temperatures, as illustrated in Fig. 5. With the increase of annealing
temper-ature from 30 to 500°C, the domain growth rate and micro-strain reduction rate are slower than that at above 500°C. The higher temperature, the more serious of thermal recovery and dynamic recrystallization are. After SP, the elastic-plastic deformation is introduced in the surface layer of samples. During isothermal annealing, the micro-strain relaxation occurs and domain size increases in the process of recovery and recrystallization, which both are driven by the stored energy of deformed state20)(caused by SP in this paper).
The distributions of dislocation density and stored energy of the top surface for shot peened specimens with annealing temperatures are shown in Fig. 6. With the increase of annealing temperature, the dislocation density of the sample after SP decreases gradually owing to the recovery and recrystallization. Moreover, with the increase of the anneal-ing temperature from 30 to 400°C, dislocation density has a slighter decrease, however, dislocation density has signifi -cantly decreased when the temperature higher than 400°C; this result indicates that more complete recovery occurs at higher annealing temperatures.
In the common case of deformation at ambient temper-atures almost all of the stored energy is derived from the
accumulation of dislocations.20) The stored energy of SP
treated sample can be calculated according to eq. (5), and the variation tendency of stored energy with annealing
0 100000 200000 300000 400000
Diffraction Angle, 2θ
(21
1)
(200)
(1
10)
650°C
600°C
550°C
500°C
450°C
400°C
350°C
300°C
250°C
200°C
Intensity (a.u.)
30°C
90° 80° 70° 60° 50° 40°
Fig. 2 XRD patterns of the top surface of SP treated 18CrNiMo7-6 steels during isothermal annealing under different temperatures from 30 to 650°C.
0.4 0.6 0.8 1.0 1.2
46.0° 45.5° 45.0° 44.5° 44.0° 43.5° 43.0°
30°C
200°C
250°C
300°C
350°C
400°C
450°C
500°C
550°C
600°C
650°C
I/I
max
Diffraction Angle, 2θ
42.5°
Fig. 3 Normalized X-ray diffraction patterns of (110) crystalline plane for the top surface of peened 18CrNiMo7-6 steel during isothermal annealing under different temperatures from 30 to 650°C.
0.3 0.4 0.5 0.6 0.7 0.8
Anealing Temperature, T / °C
Gaussian Br
eath
(
deg
)
0.3 0.4 0.5 0.6 0.7 0.8
Cauch
y Br
eath
(
deg
)
0 100 200 300 400 500 600 700
Fig. 4 The variations of Gaussian and Cauchy breadth of (110) crystalline plane at the top surface of peened 18CrNiMo7-6 steels with annealing temperatures.
0.0015 0.0020 0.0025 0.0030 0.0035 0.0040
Anealing Temperature, T / °C
Micr
ostrain
15 20 25 30 35 40 45 50
Domain Size
(
nm
)
0 100 200 300 400 500 600 700
[image:3.595.62.276.68.237.2] [image:3.595.320.534.68.218.2] [image:3.595.319.533.281.438.2] [image:3.595.55.285.297.469.2]temperature is shown in Fig. 6. It can be seen that the stored energy decreases with the increase of annealing temperature, indicating that the stored energy releases when the dislocations generated during SP recover. The release of stored energy provides the driving force for recovery and recrystallization.
Figure 7 shows the variations of residual stress on the top surface of 18CrNiMo7-6 steel before and after SP with annealing temperatures. For case hardened 18CrNiMo7-6 steel before SP, the stress decreases slightly with increasing annealing temperature and almost constant CRS of
approx-imately ¹100 MPa are present until the annealing
temper-ature increases to 650°C. The residual stresses of 18CrNi-Mo7-6 steel are generated during the martensitic hardening by dislocations which are produced during the diffusionless transformation and by solute carbon atoms which remained in their octahedral sites without diffusion.30)The stored energy is very much smaller than the energy changes associated with phase transformations and diffusions, so the residual stresses of 18CrNiMo7-6 steel before SP change slightly with increasing annealing temperature. It can be also seen from Fig. 7 that the surface of 18CrNiMo7-6 steel after triple SP
have an obvious CRS, which is beneficial to the improvement
of mechanical properties. With increasing annealing temper-ature, the CRS decreases gradually owing to the recovery and dynamic recrystallization of deformation surface. And the CRS has been closed to the value of the matrix without
[image:4.595.63.278.70.220.2]SP treatment when annealing temperature increase to 650°C. Meanwhile, the change rate of CRS in the higher temperature range is greater than that in the lower temperature range.
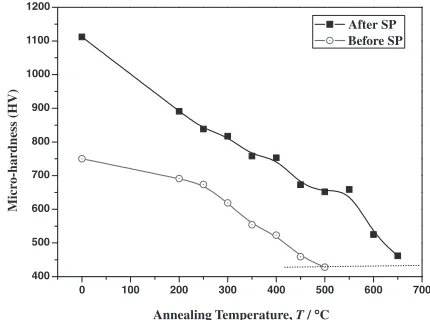
Figure 8 shows the variations of micro-hardness on the top surface of samples before and after SP with annealing temperatures. It can be observed that the micro-hardness decreases gradually with increasing annealing temperature. And the micro-hardness has been closed to the value of the matrix without SP treatment when annealing temperature increase to 650°C. The micro-hardness is related not only to the nature of material but also to the residual stress and microstructure. In the micro-hardness test, the pressure around the impression produced by indenter is from both
surface deformation and initial compressive stress.31) SP
produces the CRS and creates plastic deformation in the near surface region, which lead to the increment of micro-hardness in this region. Another reason for increment of hardness in deformed layer is owing to the grain size refining and micro-strain as well as dislocation density increasing after SP treatment.32,33)From the above analysis we can see that with increasing annealing temperature, the CRS and dislocation density decrease and domain size increases, so the corre-sponding micro-hardness drops. Meanwhile, with increasing annealing temperature, the reduction rate of micro-hardness was accelerated; this is in agreement with the above analysis results.
4. Conclusions
The residual stress relaxation behaviors and the variations of micro-structure in the shot peened layer of 18CrNiMo7-6
steel during isothermal annealing were investigated.
XRDLPA was used to identify the change of micro-structure and residual stress relaxation behaviors of the top surface for 18CrNiMo7-6 steel after SP. The results show that the residual stress, micro-hardness, micro-strain, dislocation density and stored energy of the top surface of 18CrNiMo7-6 steel decrease with the increase of annealing temperature while the domain sizes increase with increasing annealing temperature. Meanwhile, more complete recovery occurs and change rates of each parameter are bigger at higher annealing temperatures.
-1200 -1000 -800 -600 -400 -200 0
Residual Str
ess (MP
a
)
Anealing Temperature, T / °C
After SP Before SP
0 100 200 300 400 500 600 700
Fig. 7 The variations of residual stress at the top surface of 18CrNiMo7-6 steel before and after SP with annealing temperatures.
0 100 200 300 400 500 600 700 400
500 600 700 800 900 1000 1100 1200
Micr
o-hardness (HV)
Annealing Temperature, T / °C After SP Before SP
Fig. 8 The variations of micro-hardness at the top surface of 18CrNiMo7-6 steel before and after SP with annealing temperatures.
0 100 200 300 400 500 600 700 0
5 10 15 20 25 30
Anealing Temperature, T / °C
Dislocation Density
(
×
10
14 m -2)
0 10 20 30 40 50 60 70 80 90 100
Stor
ed Ener
gy (J / mol)
[image:4.595.318.533.71.231.2] [image:4.595.60.278.266.421.2]Acknowledgement
The authors are grateful to Shanghai Carthing Machinery Co. Ltd. for supporting this work.
REFERENCES
1) J. X. Liu, Z. J. He, L. H. Wang, G. P. Feng, Z. J. Zhang and L. P. Qiu: Adv. Mater. Res.194196(2011) 228231.
2) J. Krawczyk, B. Pawlowwski and P. Bala: Metall. Foundry Eng.35 (2009) 4553.
3) P. Maršálek and V. Moravec: Meccanica03(2011) 1822.
4) S. Santa-aho, M. Vippola, A. Sorsa, M. Lindgren, J. Latokartano, K. Leiviskä and T. Lepistö:J. Mater. Process. Tech. 212(2012) 2282 2293.
5) M. Kobayashi, T. Matsui and Y. Murakami:Int. J. Fatigue20(1998) 351357.
6) J. Lindemann, C. Buque and F. Appel:Acta Mater.54(2006) 1155 1164.
7) D. J. Child, G. D. West and R. C. Thomson:Acta Mater.59(2011) 48254834.
8) N. Iwata, Y. Tomota, K. Katahira and H. Suzuki:Mater. Sci. Tech. Lond.18(2002) 629632.
9) W. Luan, C. H. Jiang, V. Ji, Y. H. Chen and H. Wang:Mater. Sci. Eng. A497(2008) 374377.
10) S. Bagherifard, R. Ghelichi and M. Guagliano:Surf. Coat. Technol.
204(2010) 40814090.
11) M. A. S. Torres and H. J. C. Voorwald:Int. J. Fatigue24(2002) 877 886.
12) P. Fu, K. Zhan and C. H. Jiang:Mater. Des.51(2013) 309314.
13) A. Sorsa, K. Leiviskä, S. Santa-aho and T. Lepistö:NDT&E Int.46
(2012) 100106.
14) J. I. Langford:J. Appl. Cryst.11(1978) 1014.
15) Th. H. de Keijser, J. I. Langford, E. J. Mittemeijer and A. B. P. Vogels:
J. Appl. Cryst.15(1982) 308314.
16) K. Zhan, C. H. Jiang, X. Y. Wu and V. Ji: Mater. Trans.53(2012) 10021006.
17) T. Ungár and A. Borbély:Appl. Phys. Lett.69(1996) 3173.
18) T. Ungár, J. Gubicza, G. Ribárik and A. Borbély:J. Appl. Cryst.34
(2001) 298310.
19) T. Shintani and Y. Murata:Acta Mater.59(2011) 43144322.
20) F. J. Humphreys and M. Hatherly: Recrystallization and Related
Annealing Phenomena, 2nd ed., (Elsevier Ltd., Oxford, 2004).
21) Standard Test Method for Verifying the Alignment of X-ray Diffraction Instrumentation for Residual Stress Measurement, ASTM E915-10 2010, West Conshohocken, PA, USA.
22) E. Macherauch:Exp. Mech.6(1966) 140153.
23) P. J. Withers and H. K. D. H. Bhadeshia:Mater. Sci. Technol. Lond.17
(2001) 355365.
24) Standard Test Method for Knoop and Vickers Hardness of Materials, ASTM E384-11e1 2011, West Conshohocken, PA, USA.
25) A. R. Stokes:Proc. Phys. Soc.61(1948) 382391.
26) G. K. Williamson and R. E. Smallman:Philos. Mag.1(1956) 3446.
27) H. B. Xiao, Q. Chen and E. Shao:Wear151(1991) 7786.
28) M. Benedetti, V. Fontanari, B. R. Höhn, P. Oster and T. Tobie:Int. J. Fatigue24(2002) 11271136.
29) Z. Wang, W. Z. Luan, J. J. Huang and C. H. Jiang:Mater. Sci. Eng. A
528(2011) 64176425.
30) B. Hoffmann and E. M. Vijhringer:Mater. Sci. Eng. A234236(1997) 707710.
31) Z. Wang, C. H. Jiang, X. Y. Gan and Y. H. Chen:Appl. Surf. Sci.257
(2010) 11541160.
32) W. Z. Luan, C. H. Jiang, V. Ji and H. W. Wang:J. Mater. Sci.44(2009) 24542458.