Abstract— An operon is a fundamental unit of transcription which is used to understand gene regulations and functions in entire genomes. Detecting operons experimentally is difficult and time-consuming, and many bioinformatics algorithms have been proposed to predict operons. In this paper, an improved genetic algorithm (IGA) is used for operon prediction in bacterial genomes. IGA uses a local search strategy to maintain the diversity in a population. It is more powerful than genetic algorithms, since it avoids local optima while searching for a better solution. We utilized the intergenic distance of adjacent genes, participation in the same metabolic pathway and cluster of orthologous groups (COG) gene functions to design the fitness function. The method was successfully tested for a set of experimentally-defined operons in the E. coli, B. subtilis and P. aeruginosa PA01 genomes, with accuracies of 0.881, 0.907 and 0.941, respectively, indicating that the method can obtain highly accurate operon predictions.
Index Terms—operon prediction, IGA, intergenic distance, metabolic pathway, cluster of orthologous groups.
I. INTRODUCTION
or prokaryotic organisms, operons can be defined as a single gene or multiple consecutive genes on the same transcriptional strand of a genome sequence, where the genes are co-transcribed in the same transcription unit, and where the co-transcribed genes have the same biological function and directly affect each other. Operon prediction can be used to infer the function of putative proteins if the functions of other genes in the same operon are known. In prokaryotes, the genome is composed of thousands of genes, and operons of bacterial genomes contain information useful for drug design and determining protein functions [1], etc. Hence accurate operon prediction will facilitate drug target identification and the development of antibiotic drugs. However, operons are poorly understood and experimental methods to predict operons are very difficult to implement [2]. Thus, developing bioinformatics techniques to effectively predict operons has become a very important issue.
In recent years, researchers have proposed the use of biological properties to accurately predict operons, based on
L. Y. Chuang is with the Chemical Engineering Department, I-Shou University, 84001, Kaohsiung, Taiwan. (e-mail: [email protected]).
Y. C. Chiang is with the Department of Electronic Engineering, National Kaohsiung University of Applied Sciences, 80778, Kaohsiung, Taiwan. (e-mail: [email protected]).
C. H. Yang is with the Network Systems Department, Toko University, 61363, Chiayi, Taiwan.
C. H. Yang is also with the Electronic Engineering Department, National Kaohsiung University of Applied Sciences, 80778, Kaohsiung, Taiwan. (corresponding author to provide phone: 886-7-3814526#5639; e-mail: [email protected]).
features which can be divided into the following five categories [3]: intergenic distance, conserved gene clusters, functional relations, genome sequences, and experimental evidence. In each of these categories, detecting the promoter and terminator at the operon boundaries is critical to identifying the most biologically representative properties [2], The simplest prediction feature is whether the distance between gene pairs within an operon (WO pairs) is shorter than the distance between gene pairs at the borders of the transcription units (TUB pairs) [4]. This simple feature obtains good results for operon prediction [3].
Many operon prediction methods have been proposed, including Genetic Algorithm (GA) [1], Fuzzy Guided Genetic Algorithm (FGA) [2], Support Vector Machine (SVM) [5], Hidden Markov Model (HMM) [6], and the Bayesian Network approach [7]. GA uses four biological properties to assess putative operons: the intergenic distance, metabolic pathway, cluster of orthologous groups gene function (COG) and microarray expression data. FGA uses the intergenic distance, metabolic pathway, conservation across multiple genomes and the similarity of protein functions to design a fitness function assessment method. SVM uses the above four biological properties as its input vectors and divides gene pairs into operon pairs (OP) and non-operon pairs (NOP). These methods all fail to consider the importance of gene direction in predicting operons, and thus these algorithms are unable to determine better parent chromosomes at initialization, thus limiting the quality of the solution.
We present a simple and highly accurate computational method for operon prediction called the improved genetic algorithm (IGA). The algorithm uses the direction of adjacent genes to encode chromosomes during the initialization. The evaluation fitness function is based on the intergenic distance, metabolic pathway and cluster of orthologous groups (COG) gene function. We tested our method on the E. coli (NC_000913), B. subtilis (NC_000964) and P. aeruginosa PA01 (NC_002516) genomes. Experimental results on three test data sets indicate that the proposed method obtained a higher accuracy, sensitivity, and specificity compared to other methods taken from the literature.
II. BACKGROUND
A. Data set preparation
In this study, we used three test data sets comprised of 4430, 4106 and 5566 genes, respectively, from the E. coli, B. subtilis and P. aeruginosa PA01 genomes. All experimental data and annotated genes can be downloaded from the
An Improved Genetic Algorithm
for Operon Prediction
Li-Yeh Chuang, Yi-Cheng Chiang, and Cheng-Hong Yang, Member, IAENG
GenBank database (http://www.ncbi.nlm.nih.gov/). The data contains the name, ID, start position, end position, direction and product names of each gene. The E. coli and B. subtilis genomes were respectively obtained from RegulonDB (http://regulondb.ccg.unam.mx/) [8] and DBTBS (http://dbtbs.hgc.jp/) [9], while the operon databases of the P. aeruginosa PA01 genome can be obtained from ODB (http://odb.kuicr.kyoto-u.ac.jp/) [10]. The genomes’ metabolic pathways and COG were respectively obtained from KEGG (http://www.genome.ad.jp/kegg/pathway.html) and NCBI (http: //www.ncbi. nlm.nih.gov/COG/).
B. Biological properties
This study included the following three features: 1) Intergenic distance
This feature can be predicted with the complete genome sequencing of the operon, thus protecting the mRNA in the degradation process. Therefore genes in the same operon are characterized by short distances. However, adjacent genes may sometimes overlap, and shorter intergenic distances are more likely to be located within an operon [1]. The maximum frequency of the WO pair distance is -4 [11]. However, the distance distribution frequency of TUB pairs increases with distance, and gradually comes to exceed the frequency of the WO pairs. Thus, this property can be used to identify operons in the bacterial genomes.
2) Cluster of orthologous groups gene function
The COGs are clusters of orthologous groups, and consist of three main levels. The first level can be divided into information storage and processing, cellular processing and signaling, metabolism and different COG categories. Each first level class includes many sub-classes. If adjacent genes belong to the same category, they may be in the same operon. 3) Metabolic pathway
Gene ontology contains three levels of biological functions, one of which is a biological process [12]. However, genes within an operon often participate in the same biological process [5]. Therefore, if adjacent genes have the same metabolic pathway, we assume that the gene pair is located in the same operon.
C. Definition of a potential operon pair
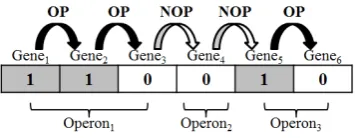
[image:2.595.322.529.60.115.2]For operon prediction, we first defined the WO pair and TUB pair to compute the prediction accuracy. Adjacent genes in the same operon are called WO pairs. If the operon contains a single gene, and the downstream gene is of unknown status, the gene pair is called a TUB pair. However, if the upstream gene is the last gene of an operon, and the status of the downstream gene is uncertain, the gene pair cannot be called a TUB pair [13]. In Fig. 1 the white arrows represent unknown genes, the gray arrow represents an operon containing only a single gene, and the black arrows represent operons composed of more than two genes.
Fig 1. WO and TUB pairs
III. METHODOLOGY
A. Genetic Algorithm
In 1975, Holland first proposed genetic algorithm [14], based on Darwinian natural selection. Genetic algorithm includes three main steps: selection, crossover and mutation. In this study, we use a roulette wheel selection method to choose two chromosomes from the population as parents, while crossover and mutation respectively use two-point crossover and single-point random mutation. The main purpose of crossover is to continue to propagate the advantages of the parental generation to produce fitter offspring, and the mutations increase chromosomal diversity to avoid local optima solutions.
1) Chromosome
A binary encoding method was used to build the chromosomes. A gene is encoded as "1" to indicate that the gene and downstream gene are in the same operon (WO). If the gene and the downstream gene are in different operons or in the opposite direction (TUB) then the gene is encoded as "0". In Fig. 2, if the chromosome is encoded as 110010, Gene1, Gene2 and Gene3 belong to a single operon, while
Gene4 belongs to a second operon, and Gene5 and Gene6
belong to a third operon.
Fig 2. Diagram of building chromosomes 2) Initialization
We use the direction and distance of the adjacent gene to encode the chromosome, generating for each chromosome a random number from 0 to 600 as a threshold, if distance of the upstream and downstream genes is greater than the threshold value, the upstream gene will be encoded as 1, and otherwise it will be encoded as 0. Figure 3 illustrates the chromosome building process. Distance is calculated as follows [15]:
(
Gene_finish 1)
_start Gene
distance= 2 − 1 + (1)
where Gene1_finish is the base end position of the upstream
gene, and Gene2_start is the base start position of the
[image:2.595.338.516.477.546.2]Fig 3. Chromosome building 3) Fitness evaluation
Intergenic distance, metabolic pathway and COG gene functions are used to calculate the fitness value.
a) Intergenic distance: The intergenic distance between genes is very useful for operon prediction [12] and is used here as the basis for fitness evaluation. Table 1 shows the fitness function of the distance based on the local-entropy-minimization method [1], with assessment scores for each distance interval. If the intergenic distance of a gene pair is located within a certain interval, then the pair-score is equal to the score of this interval.
b) Metabolic pathway: If adjacent genes have the same metabolic pathway the gene pair has a high probability of sharing an operon. In this paper, the pair-score of a gene pair is 1 if the adjacent genes are located in the same pathway, but is 0 otherwise.
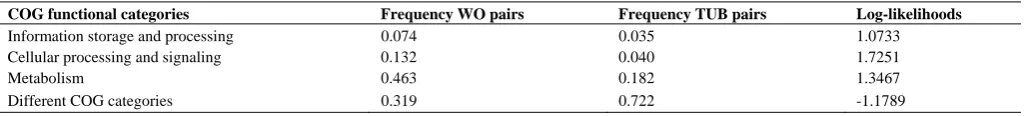
c) COG functions: Taken from the [1], this function uses the log-likelihood method to calculate scores. Table 2 shows the log-likelihoods of information storage and processing, cellular processing and signaling, metabolism and different COG categories are 1.0733, 1.7251, 1.3467 and -1.1789, respectively.
d) Chromosome fitness: In calculating the fitness value of chromosomes, when the operon contains only one gene the pair-score of metabolic pathway and COG of gene are multiplied by 0 and -1, respectively. The pair-score of adjacent genes and the fitness value of the cth putative operon are thus calculated as follows:
) , ( ) , ( ) ,
( 1 1
j i COG i i path i i i gene gene S gene gene S d gene gene score + + = + + (2) n gene gene S gene gene d fitness j i COG j i m i m i j path m i i c )) , ( ) , ( (S ) ( 1 1 1 1 -1 + ∑ ∑ + ∑ = − = =+ = (3)
where m and n are respectively the total number of genes and gene pairs in the cth operon. Finally, the fitness value of a particle is calculated as the sum of the fitness values from all putative operons in the particle as follows:
∑
= = c i i fitness fitness 1 (4)where c is the number of operons in the particle. 4) Selection
Our selection process uses the roulette selection method, and the probability of selection is based on the fitness of each chromosome. High fitness value chromosomes have a high probability of selection. The probability of selection of each chromosome was normalized between 0 and 1 by (5) and (6) below. In the selection process, we generate a random value between 0 and 1; if the value is in the range of probability of a given chromosome, then the chromosome is selected as a parental chromosome. mm P i j p P i j
i = ∑ =
=1 -~ 1 ), ( (5) sum fit i fit j
P( )= () (6)
where P-num is the number of chromosomes in the population, fit(i) is the value of the fitness function of the chromosomes, and fitsum represents the sum of all chromosome fitness values.
TABLEI
INTERVALS OF INTERGENIC DISTANCE USING LOCAL-ENTROPY-MINIMIZATION METHOD FOR E. COLI GENOME
[image:3.595.42.555.549.681.2] [image:3.595.43.556.708.766.2]Interval Score Interval Score Interval Score
[561, 40611] -1 [380,560] -0.3902 [290,379] -0.4007
[235,289] -0.2879 [211,234] -0.1502 [186,210] -0.0617
[167,185] -0.0148 [140,166] -0.1074 [128,139] -0.0817
[114,127] -0.0148 [98,113] -0.0192 [91,97] 0.1233
[82,90] 0.2081 [77,81] 0.0089 [69,76] 0.0573 [65,68] 0.0226 [54,64] 0.2317 [49,53] 0.029 [47,48] 0.188722 [38,46] 0.408327 [32,37] 0.374738 [30,31] 0.408327 [28,29] 0.456436 [21,27] 0.531 [10,20] 0.7355 [5,9] 0.5862 [2,4] 0.6549
[-6,1] 0.791443 [-15,-7] 0.66271 [-18,-16] 0.188722
[-24,-19] 0.278072 [-70,-25] 0.733235 [-149,-71] -1
TABLEII
FREQUENCIES OF ADJACENT PAIRS FOR DIFFERENT COG FUNCTIONAL CATEGORIES AND THEIR SCORES IN E. COLI GENOME
COG functional categories Frequency WO pairs Frequency TUB pairs Log-likelihoods
Information storage and processing 0.074 0.035 1.0733
Cellular processing and signaling 0.132 0.040 1.7251
Metabolism 0.463 0.182 1.3467
5) Crossover
[image:4.595.51.293.203.292.2]We use the two-point crossover, randomly generating two points as the basis of the crossover, enabling the parent chromosomes to be divided into three sections. Changes in the middle-encoding of two chromosomes produce two new offspring chromosomes. Fig. 4 shows that, following the division of the parental chromosomes, the middle-coding of parental1 is 101, and that of parental2 is 011. The middle-encoding of two parental chromosomes is changed, and produces the two offspring chromosomes, encoded as 101101 and 110100.
Fig 4. Two-point crossover 6) Mutation
The mutation process determines the TUB bit of the two offspring chromosomes; if the random value of the bit is smaller than the mutation rate, then the mutation proceeds by one of the following methods:
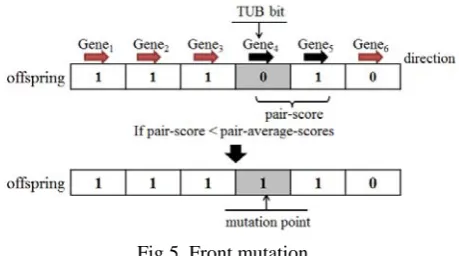
a) Front mutation: As seen in Fig. 5, if the TUB bit is selected for Gene4, but Gene4 lies in a different direction
from Gene5, then the pair-scores are assessed by Gene3 and
Gene4. If the pair-score is less than pair-average-score, then
[image:4.595.57.287.460.588.2]the coding of Gene3 is changed to 0.
Fig 5. Front mutation
b) Backend mutation: As seen in Fig. 6, if Gene4 and
Gene5 lie in the same direction and the pair-score is greater
than pair-average-score, then the coding of Gene4 is changed
to 1.
Fig 6. Backend mutation diagram B. Improved genetic algorithm
An improved genetic algorithm is added to the local search. In this study, the local search is fine-tuned for the new generation of chromosomes. To avoid excessive similarity between the chromosomes, fitness enhancement is discontinued. Local search is applied to the initialization, crossover and mutation processes, mainly to improve the fitness values of the chromosomes and to avoid multiple iterations so that the lack of population diversity won’t impede the search for a better solution. This method is similar to that used in the mutation process: first pick a gene from the gene sequence and force an encoding change in the selected gene; then assess the fitness value of the chromosomes after the change. As the gene sequence contains thousands of genes, we only execute a D/10 times (D = the number of genes in the chromosome) local search for each chromosome to determine which genes are able to improve their fitness value, and then replace the original chromosome if the fitness is improved. Thus, we can use less iteration to obtain the chromosome’s high fitness value.
C. Parameter settings
In this study, the population number P is 20, the iteration number G is 100, the crossover rate (X-rate) is 1.0, the mutation rate (M-rate) is 0.05, and the thresholds of initialization are between 0 and 600 bps.
IV. EXPERIMENTAL RESULTS AND DISCUSSIONS
A. Performance measurement
Tables 3 and 4 show the most commonly used assessment methods for medical diagnostics. TP and FP represents true and false positive, while TN and FN represent true and false negative. These are used to calculate the positive prediction rate (PPR), negative prediction rate (NPR), sensitivity (SN), specificity (SP) and accuracy (ACC) [16].
TABLEIII
POSITIVE AND NEGATIVE EVALUATION True
Prediction Positive Negative
Positive TP FP
Negative FN TN
TABLEVI
EVALUATION METHOD FOR OPERON PREDICTION Value to be estimated Equation for estimation
Positive prediction rate TP/(TP+FP)
Negative prediction rate TN/(FN+TN)
Sensitivity TP/(TP+FN)
Specificity TN/(FP+TN)
Accuracy (TP+TN)/(TP+FP+TN+FN)
[image:4.595.296.555.553.766.2]111010, and the predicted operon encoding is 110110. The third and fourth genes are FN and FP, respectively. The first, second and fifth genes are TP, and the sixth gene is TN. The accuracy obtained by the proposed method was compared to other methods, and showed a good balance between sensitivity and specificity.
B. Comparison to other methods
We used IGA to search for the best chromosome, and compared the search results with experimentally-verified operons to calculate TP, FN, TN and FP to evaluate accuracy, sensitivity and specificity. This provided a basis for comparison with other methods from the literature, with results shown in Table 5. The proposed method obtained prediction accuracy values of 0.881, 0.907 and 0.941, respectively, for the E. coli, B. subtilis and P. aeruginosa PA01 genome data sets. Although this study uses only three features for prediction, which is less than other operon prediction methods, the proposed method achieves a better balance between sensitivity and specificity than does ODB. For B. subtilis and P. aeruginosa PA01, our method obtained higher accuracy and specificity than ODB and other methods from the literature. GA uses the same three features used in the proposed method, along with microarray expression data. However, the proposed method still outperformed GA, indicating that these three features can effectively improve GA performance through improved predictive accuracy and local search.
C. Discussion
The IGA used local search to change the relation of the near genes, thereby increasing the probability of finding an optimal solution. Since the initialization step for operon prediction is very important, to raise the IGA prediction performance we first conducted a local search for the initial population, thus increasing the likelihood of producing high quality offspring chromosomes. Given a better population of chromosomes in the initialization step, updating the population will effectively improve operon prediction accuracy through multiple iterations. The direction of the adjacent gene is important for operon prediction because genes in the same operon will share a direction, while adjacent genes in different directions must belong to different operons. Therefore, this study used two biological characteristics as the initial basis: threshold of intergenic distance (adjusting the initial threshold to 600 bps raises the sensitivity and specificity of the gap, and improves prediction accuracy) and the direction of the adjacent gene (which effectively predicts TUB to enhance prediction accuracy and specificity). Using these biological properties as the basis for initialization, followed by local search, raises the fitness of each chromosome. However, the genetic algorithms evolve slowly with low mutation rates, causing results to often fall into local optima solutions. Thus we follow mating and mutation with local search, and use an increased mating and mutation rate to increase chromosome diversity, thus increase the chances of finding the best chromosome.
Experimental data on the E. coli genome can be
downloaded from the RegulonDB database, but extensive experimental data are not readily available for other genomes. To apply the proposed method to other genomes with fewer attributes, only five common properties for operon prediction were used. In theory, using more features in prediction will increase the resulting prediction accuracy, but some features require a considerable time investment without providing commensurate improvement. ODB used four properties for operon prediction, but the method suffers from low prediction sensitivity [10]. In addition, the WO pair and TUB pair performance of DVDA was <0.5 in the gene pair analyses performed, and the operon prediction performance based on the literature [3] was <0.2 based on the complete operons of E. coli and B. subtilis. However, when adjacent genes share a common pathway, the probability of a gene pair being a WO pair is very high [2]. The probability of gene pairs with the same first-level of COG function categories is 83.5% [17]. Since intergenic distance is the most commonly used feature, we used these three features as the basis for fitness evaluation. The results reveal that the pathway and COG properties are more suitable for identifying WO and TUB pairs. Our IGA method only uses three such properties but still achieves better results. The simplicity of our method can thus be considered a significant advantage for operon prediction.
Generally, the use of more functions increases prediction accuracy and increases computation time. However, not all features are applicable to all genomes, and they must be chosen carefully. We use the same calculations for fitness values used in [1], the local entropy-minimization-based method to evaluate the intergenic distance and log-likelihood to statistically evaluate the COG function score. The pathway used is also identical to that in [1]. Using only three properties, our method obtained the highest accuracy for operon prediction on two bacterial genomes. These results suggest that IGA can effectively enhance prediction accuracy.
V. CONCLUSIONS
An effective operon prediction method with an improved genetic algorithm is proposed, using local search to enhance the chances for getting better chromosome, so that before the iterative process to obtain more excellent chromosomes. We improved prediction accuracy through a fitness function based on intergenic distance, metabolic pathway and COG gene functions. Results show the proposed method can effectively predict the correct rate, sensitivity and specificity of operons.
REFERENCES
[1] S. Wang, Y. Wang, W. Du, F. Sun, X. Wang, C. Zhou, and Y. Liang, "A multi-approaches-guided genetic algorithm with application to operon prediction," Artificial intelligence in medicine, vol. 41, pp. 151-159, 2007.
[2] E. Jacob, R. Sasikumar, and K. N. R. Nair, "A fuzzy guided genetic algorithm for operon prediction," Bioinformatics, vol. 21, p. 1403-1407, 2005.
[4] L. Wang, J. D. Trawick, R. Yamamoto, and C. Zamudio, "Genome-wide operon prediction in Staphylococcus aureus," Nucleic acids research, vol. 32, p. 3689, 2004.
[5] G. Zhang, Z. Cao, Q. Luo, Y. Cai, and Y. Li, "Operon prediction based on SVM," Computational Biology and Chemistry, vol. 30, pp. 233-240, 2006.
[6] T. Yada, M. Nakao, Y. Totoki, and K. Nakai, "Modeling and predicting transcriptional units of Escherichia coligenes using hidden Markov models," Bioinformatics, vol. 15, p. 987, 1999.
[7] J. Bockhorst, M. Craven, D. Page, J. Shavlik, and J. Glasner, "A Bayesian network approach to operon prediction," Bioinformatics, vol. 19, p. 1227, 2003.
[8] M. Pertea, K. Ayanbule, M. Smedinghoff, and S. L. Salzberg, "OperonDB: a comprehensive database of predicted operons in microbial genomes," Nucleic acids research, vol. 37, p. D479, 2009. [9] N. Sierro, Y. Makita, M. De Hoon, and K. Nakai, "DBTBS: a database
of transcriptional regulation in Bacillus subtilis containing upstream intergenic conservation information," Nucleic acids research, vol. 36, p. D93, 2008.
[10] S. Okuda, T. Katayama, S. Kawashima, S. Goto, and M. Kanehisa, "ODB: a database of operons accumulating known operons across multiple genomes," Nucleic acids research, vol. 34, p. D358, 2006. [11] Y. Yan, and J. Moult, "Detection of operons," Proteins, vol. 64, pp.
615-28, Aug 15 2006.
[12] T. T. Tran, P. Dam, Z. Su, F. L. Poole, 2nd, M. W. Adams, G. T. Zhou, and Y. Xu, "Operon prediction in Pyrococcus furious," Nucleic Acids Res., vol. 35, pp. 11-20, 2007.
[13] C. Sabatti, L. Rohlin, M. K. Oh, and J. C. Liao, "Co-expression pattern from DNA microarray experiments as a tool for operon prediction," Nucleic acids research, vol. 30, p. 2886, 2002.
[14] J. H. Holland, Adaptation in natural and artificial systems: An introductory analysis with applications to biology, control, and artificial intelligence: U Michigan Press, 1975.
[15] H. Salgado, G. Moreno-Hagelsieb, T. F. Smith, and J. Collado-Vides, "Operons in Escherichia coli: genomic analyses and predictions," Proceedings of the National Academy of Sciences, vol. 97, p. 6652, 2000.
[16] P. Dam, V. Olman, K. Harris, Z. Su, and Y. Xu, "Operon prediction using both genome-specific and general genomic information," Nucleic acids research, vol. 35, p. 288, 2006.
[17] X. Chen, Z. Su, P. Dam, B. Palenik, Y. Xu, and T. Jiang, "Operon prediction by comparative genomics: an application to the Synechococcus sp. WH8102 genome," Nucleic Acids Res., vol. 32, pp. 2147-2157, 2004.
[18] B.P. Westover, J.D. Buhler, J.L. Sonnenburg, and J. I. Gordon, "Operon prediction without a training set," Bioinformatics, vol. 21, no. 7, pp.880-888, 2004.
[19] M.D. Ermolaeva, O. White, and S.L. Salzberg, "Prediction of operons in microbial genomes," Nucleic Acids Research, Vol. 29, no. 5, pp.1216-1221, 2001.
[20] M.N. Price, K.H. Huang, E.J. Alm, and A.P. Arkin, "A novel method for accurate operon predictions in all sequenced prokaryotes," Nucleic Acids Research, Vol. 33, no. 3, pp.880-892, 2005.
[21] G. Li, D. Che, and Y. Xu, "A universal operon prediction for prokaryotic genomes," Journal of Bioinformatics and Computational Biology, Vol. 7, no. 1, pp.19-38, 2009.
[22] Edwards,M.T., Rison,S.C., Stoker,N.G. and Wernisch,L. (2005) A universally applicable method of operon map prediction on minimally annotated genomes using conserved genomic context. Nucleic Acids Res., 33, 3253–3262.
TABLEV
ACCURACY,SENSITIVITY,SPECIFICITY OF THREE GENOMES
Genomes Methodologies Accuracy Sensitivity Specificity
E. coli
IGA 0.881 0.863 0.892
GA [1] 0.860 0.894 0.813
FGA [2] 0.900 N/A N/A
SVM [5] 0.856 0.888 0.802
B. subtilis
IGA 0.907 0.868 0.939
GA[1] 0.883 0.873 0.897
FGA[2] 0.882 N/A N/A
SVM [5] 0.889 0.900 0.860
ODB[10] 0.632 0.499 0.992
OFS [18] 0.683 0.765 0.439
OPERON [19] 0.629 0.531 0.892
JPOP [17] 0.746 0.720 0.900
VIMSS [20] 0.780 0.764 0.871
UNIPOP [21] 0.792 0.782 0.821
DADV[22] 0.485 0.319 0.932
P. aeruginosa PA01 IGA 0.941 0.937 0.946
GA [1] 0.813 0.870 0.763