University of Warwick institutional repository: http://go.warwick.ac.uk/wrap
This paper is made available online in accordance with
publisher policies. Please scroll down to view the document
itself. Please refer to the repository record for this item and our
policy information available from the repository home page for
further information.
To see the final version of this paper please visit the publisher’s website.
Access to the published version may require a subscription.
Author(s): Nigel Stallard, Charlotte Price, Stuart Creton, Ian Indans,
Robert Guest, David Griffiths and Philippa Edwards
Article Title: A new sighting study for the fixed concentration
procedure to allow for gender differences
Year of publication: 2010
Link to published article: http://dx.doi.org/10.1177/096032711037098
http://het.sagepub.com/
http://het.sagepub.com/content/30/3/239 The online version of this article can be found at:
DOI: 10.1177/0960327110370983
2011 30: 239 originally published online 20 May 2010
Hum Exp Toxicol
Nigel Stallard, Charlotte Price, Stuart Creton, Ian Indans, Robert Guest, David Griffiths and Philippa Edwards
A new sighting study for the fixed concentration procedure to allow for gender differences
Published by:
http://www.sagepublications.com
can be found at:
Human & Experimental Toxicology
Additional services and information for
Access
Open
http://het.sagepub.com/cgi/alerts
Email Alerts:
http://het.sagepub.com/subscriptions
Subscriptions:
http://www.sagepub.com/journalsReprints.nav
Reprints:
http://www.sagepub.com/journalsPermissions.nav
Permissions:
http://het.sagepub.com/content/30/3/239.refs.html
A new sighting study for the fixed
concentration procedure to allow
for gender differences
Nigel Stallard
1, Charlotte Price
1, Stuart Creton
2,
Ian Indans
3, Robert Guest
4, David Griffiths
4and
Philippa Edwards
5Abstract
The fixed concentration procedure (FCP) has been proposed as an alternative to the median lethal
concentration (LC50) test (organisation for economic co-operation and development (OECD) test guideline
[TG] 403) for the assessment of acute inhalation toxicity. The FCP tests animals of a single gender (usually females) at a number of fixed concentration levels in a sequential fashion. It begins with a sighting study that pre-cedes the main FCP study and is used to determine the main study starting concentration. In this paper, we pro-pose a modification to the sighting study and suggest that it should be conducted using both male and female animals, rather than just animals of a single gender. Statistical analysis demonstrates that, when females are more sensitive, the new procedure is likely to give the same classification as the original FCP, whereas, if males are more sensitive, the new procedure is much less likely to lead to incorrect classification into a less toxic category. If
there is no difference in the LC50for females and males, the new procedure is slightly more likely to classify into
a more stringent class than the original FCP. Overall, these results show that the revised sighting study ensures gender differences in sensitivity do not significantly impact on the performance of the FCP, supporting its use as an alternative test method for assessing acute inhalation toxicity.
Keywords
acute inhalation toxicity, OECD Test Guidelines, fixed concentration procedure, gender differences
Introduction
The current internationally accepted methods for assessing the acute inhalation toxicity of chemicals
are the LC50 method (described in organisation for
economic co-operation and development (OECD)
TG 4031) and the acute toxic class method (ATC;
described in OECD TG 4362), both of which require
lethality as the endpoint. The fixed concentration
pro-cedure (FCP)3,4 has been proposed as an alternative
method and uses signs of ‘evident toxicity’ as the end-point. The FCP aims to determine a concentration level that will lead to evident toxicity, where this means clear signs of toxicity indicating that exposure to the next highest concentration would cause severe toxicity requiring euthanasia or death in most animals within 14 days. The FCP provides a refinement in
ani-mal welfare terms over the LC50and the ATC
meth-ods as it does not require death or severe toxicity as an
endpoint. In addition, it uses fewer animals,
particu-larly in comparison with the LC50test.1
Since acute toxicity tests are used to assess the potential hazards and risks to human health, the infor-mation obtained from the FCP regarding non-lethal signs of toxicity provides additional value. However,
1
Warwick Medical School, University of Warwick, Coventry, UK
2National Centre for the Replacement, Refinement and
Reduction of Animals in Research (NC3Rs), London, UK
3
Health Directorate, Health and Safety Executive, Bootle, Merseyside, UK
4
Harlan Laboratories Ltd, Shardlow, UK
5
Health Protection Agency, Didcot, UK
Corresponding author:
Nigel Stallard, Warwick Medical School, University of Warwick, Coventry, CV4 7AL, UK
Email: [email protected]
Human and Experimental Toxicology 30(3) 239–249
a major use of the output of acute toxicity studies is for the purpose of classification and labelling of che-micals, based on their potential hazard. It is therefore important to establish that the proposed FCP protocol is satisfactory for this purpose.
A recent statistical evaluation of the performances
of the FCP, the LC50 method and ATC method
showed that all three methods perform well in the
absence of gender differences.5 However,
perfor-mance is affected in all cases when unanticipated gen-der differences are present. While the effect is
relatively minor for the ATC and LC50 methods,
which test both males and females, the performance of the FCP is substantially worsened. In particular, the
statistical evaluation of the FCP when the LC50 for
males is one-tenth of that for females showed that misclassification into a less toxic category can occur
with high probability; in some cases, nearly 100%
of the time.
The FCP tests animals of a single gender at one or more of four fixed concentration levels in a stepwise manner, and unless it is believed that males are likely to be more sensitive, females are used for testing. The
fixed concentrations correspond to the LC50values on
the boundaries between the Globally Harmonised
Scheme (GHS) acute toxicity classes.6For example,
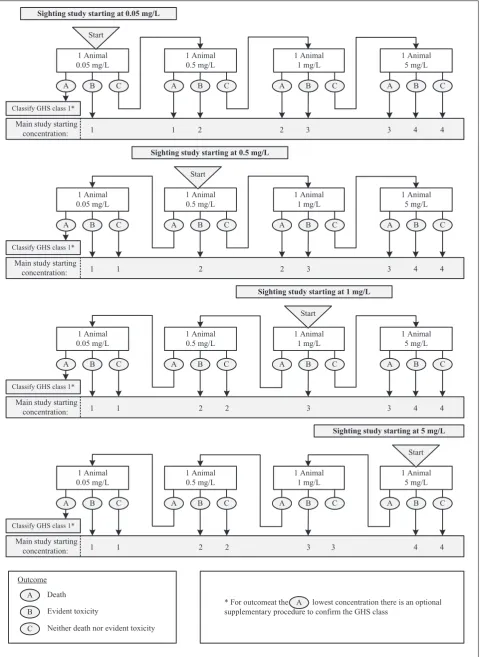
for dusts and mists, testing is conducted at concentra-tions of 0.05, 0.5, 1 or 5 mg/L. Unless there is reliable prior knowledge about the toxicity of the test sub-stance, for example if a limit test is to be conducted, the study will generally be preceded by a sighting study that is used to determine an appropriate starting concentration for the main study. The sighting study and main study are shown in Figures 1 and 2, respectively.
If testing in the main study starts at the highest con-centration level, such as 5 mg/L for dusts and mists, and no evident toxicity is observed, the substance is regarded as unclassified. In this case, the FCP is effec-tively a limit test. For substances that do evoke toxicity and thus require full testing, the use of a sighting study to rapidly determine an appropriate starting concentra-tion for the main study, and the use of non-fatal evident toxicity as an endpoint, means that the FCP typically uses considerably fewer animals and leads to fewer deaths than alternative acute inhalation toxicity testing
procedures such as those described by TG 4031and TG
436,2as indicated by Price et al.5
The use of a single gender in the FCP means that if there are unanticipated gender differences in the sen-sitivity of the animals to a test substance, and the least
sensitive gender is used erroneously, the procedure may lead to an incorrect classification. In a previous analysis of data from the assessment of acute
inhala-tion toxicity for 56 substances using LC50testing,
sta-tistically significant gender differences were found in
16 substances (29%).5 In the majority of substances
where a gender difference was indicated, females were
more sensitive, with LC50 values for males up to 19
times that for females. However, in some cases, males
were more sensitive, with the LC50value for females
up to 12 times that for males. These findings demon-strate that the potential for gender differences in sensi-tivity following inhalation exposure needs to be taken into account in assessing the performance of acute inhalation toxicity test methods.
To address the impaired performance of the FCP when male animals are more sensitive than females, we propose a modification to the sighting study that is used to determine the starting concentration of the main study. It is suggested that the sighting study should be conducted using both male and female ani-mals, as described in detail in the next section. A sta-tistical evaluation of the performance of the revised protocol is presented in the presence and absence of gender differences.
Methods
Modification of the FCP to include both genders in
the sighting study
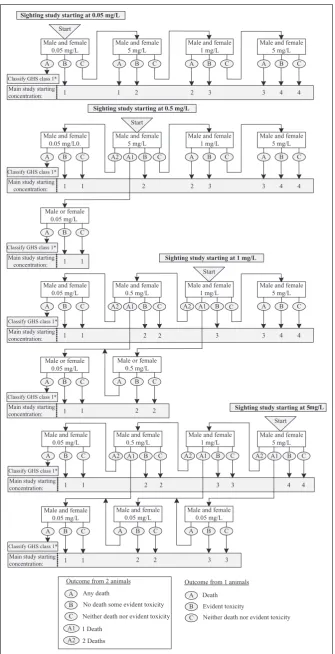
In order to detect any substantial gender differences in sensitivity to acute inhalation toxicity, as well as selecting an appropriate main study starting concentra-tion, a new sighting study for the FCP is proposed in which both males and females are tested. The new pro-posed sighting study is shown in Figure 3. Initially, two animals, one male and one female, are simultaneously exposed at a chosen starting concentration. If both ani-mals demonstrate the same response of death, non-fatal evident toxicity or no effects, the sighting study either stops and leads to a main study conducted in females or continues to test two animals (one male and one female) at the next concentration, exactly as in the original proposed FCP sighting study.
A B C Start
A B C
A B C
A B C
1 Animal 0.05 mg/L
1 Animal 0.5 mg/L
1 Animal 1 mg/L
1 Animal 5 mg/L
Main study starting concentration:
Classify GHS class 1*
1 1 2 2 3 3 4 4
Sighting study starting at 0.05 mg/L
A B C
Start
A B C
A B C
A B C
1 Animal 0.05 mg/L
1 Animal 0.5 mg/L
1 Animal 1 mg/L
1 Animal 5 mg/L
Main study starting concentration:
Classify GHS class 1*
4 4 3 3
2 2
1
Sighting study starting at 0.5 mg/L
1
A B C
Start
A B C
A B C
A B C
1 Animal 0.05 mg/L
1 Animal 0.5 mg/L
1 Animal 1 mg/L
1 Animal 5 mg/L
Main study starting concentration:
Classify GHS class 1*
4 4 3 3
2 1
Sighting study starting at 1 mg/L
1
A B C
Start
A B C
A B C
A B C
1 Animal 0.05 mg/L
1 Animal 0.5 mg/L
1 Animal 1 mg/L
1 Animal 5 mg/L
Main study starting concentration:
Classify GHS class 1*
4 4 3
2 1
Sighting study starting at 5 mg/L
1
2
3 2
A
* For outcomeat the lowest concentration there is an optional supplementary procedure to confirm the GHS class
A
B
C Outcome
Death
Evident toxicity
[image:5.595.64.545.70.728.2]Neither death nor evident toxicity
Figure 1.The fixed concentration procedure sighting study for classification of dusts and mists according to the Globally Harmonised Scheme (GHS) classification system.
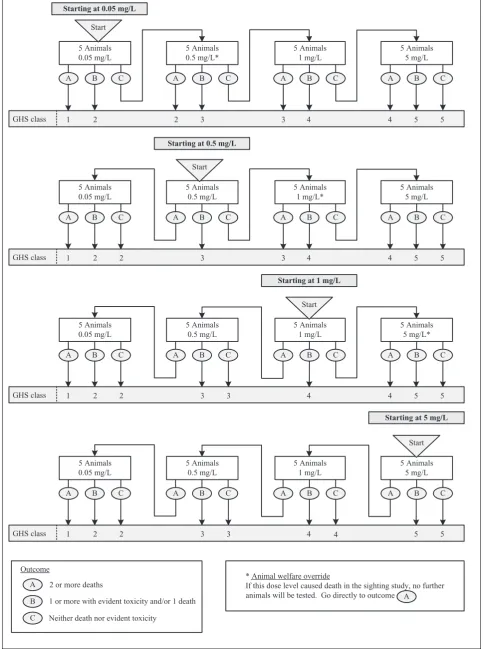
A B C Start
A B C
A B C
A B C
5 Animals 0.05 mg/L
5 Animals 0.5 mg/L*
5 Animals 1 mg/L
5 Animals 5 mg/L
GHS class 1 2 3 4
A B C
Start
A B C
A B C
A B C
5 Animals 0.05 mg/L
5 Animals 0.5 mg/L
5 Animals 1 mg/L*
5 Animals 5 mg/L
A B C
Start
A B C
A B C
A B C
5 Animals 0.05 mg/L
5 Animals 0.5 mg/L
5 Animals 1 mg/L
5 Animals 5 mg/L*
A B C
Start
A B C
A B C
A B C
5 Animals 0.05 mg/L
5 Animals 0.5 mg/L
5 Animals 1 mg/L
5 Animals 5 mg/L
A
B
C Outcome
2 or more deaths
1 or more with evident toxicity and/or 1 death
Neither death nor evident toxicity
5 5 4
3 2
GHS class 1 2 3 3 4 4 5 5
Starting at 0.05 mg/L
Starting at 0.5 mg/L
2
GHS class 1 2 2 3 3 4 4 5 5
Starting at 1 mg/L
Starting at 5 mg/L
GHS class 1 2 2 3 3 4 4 5 5
* Animal welfare override
[image:6.595.50.534.78.728.2]If this dose level caused death in the sighting study, no further animals will be tested. Go directly to outcome A
A B C Start
A B C
A B C
A B C
Male and female 0.05 mg/L
Male and female 5 mg/L
Main study starting concentration:
Classify GHS class 1*
1 1 2 2 3 3 4 4
Sighting study starting at 0.05 mg/L
A B C
Start
A B C
A B C
Main study starting concentration:
Classify GHS class 1*
1 2 2 3 3 4 4
Sighting study starting at 0.5 mg/L
1
A2 A1 B C
A B C
Main study starting concentration:
Classify GHS class 1*
1 1
A B C
Start
A
Male and female 0.05 mg/L
B C
Male and female 0.5 mg/L
Male and female 5 mg/L
Main study starting concentration:
Classify GHS class 1*
1 2 3 3 4 4
Sighting study starting at 1 mg/L
1
A2 A1 B C
A B C
Main study starting concentration:
Classify GHS class 1*
1 1
2
Male and female 1 mg/L
C B A1 A2
A B C
Male or female 0.5 mg/L
2 2
Start
A B C
Male and female 0.5 mg/L
Main study starting concentration:
Classify GHS class 1*
1 2 3 4 4
Sighting study starting at 5 mg/L
1
A2 A1 B C
A B C
Male and female 0.05 mg/L
Main study starting concentration:
Classify GHS class 1*
1 1
2
Male and female 1 mg/L
C B A1 A2
A B C
2 2
3
Male and female 5 mg/L
C B A1 A2
A B C
Male and female 0.05 mg/L 3 3 A B C Any death
No death some evident toxicity
Neither death nor evident toxicity
A1 1 Death
A2 2 Deaths Outcome from 2 animals
Death
Evident toxicity
Neither death nor evident toxicity Outcome from 1 animals
A
B
C Male and female
5 mg/L
Male and female 1 mg/L
Male and female 0.05 mg/L0.
Male and female 5 mg/L
Male and female 1 mg/L
Male and female 5 mg/L
Male and female 0.05 mg/L
Male and female 0.05 mg/L Male or female
0.05 mg/L Male or female
[image:7.595.137.473.66.721.2]0.05 mg/L
Figure 3.Revised fixed concentration procedure sighting study (dusts and mists).
exposing another animal of the more sensitive gender at the next lower concentration, unless testing at that concentration has already been conducted, in which case the main study starts in the more sensitive gender at the next lower concentration to that at which death occurred. If instead one animal demonstrates evident toxicity and the other shows no toxic effects, the main study starts at that concentration using the gender of the animal in which the evident toxicity was observed. The main study is conducted using five animals per concentration of the gender indicated by the new sighting study as described above but is otherwise
identical to that proposed previously.3,4
Statistical evaluation of the FCP with modified
sighting study
Stallard et al.4 described a method for the statistical
evaluation of the FCP. The method is based on the assumption that both the probability of death and the probability of either death or non-fatal evident toxicity are given by probit concentration-response curves with the same slope. Based on these concentration-response curves, calculations can be performed to obtain the probability of each possible outcome at each of the fixed testing concentrations. This enables the probabil-ities of classification into each of the toxic classes, together with the average number of animals required and deaths resulting from the testing of hypothetical substances, to be calculated. A gender difference in sensitivity to acute inhalation toxicity may be assumed by including concentration-response curves for males
and females with the same slope but different LC50
val-ues. Further details are given by Price et al.5
Assuming a range of sighting study starting concen-trations, the statistical evaluation was conducted for
hypothetical dusts and mists with LC50values ranging
from 0.01 to 50 mg/L. The ratio of the LC50 to the
TC50, denoted byR, was taken to be 5, where the TC50
is the concentration expected to cause death or evident
toxicity in 50%of the animals. Concentration-response
curve slope values of 10 and 4 were investigated. A value of 10 was the median concentration-response curve
slope reported by Greiner,7while 4 was the first
percen-tile value, indicating that 1%of substances might have
concentration-response curves shallower than this. As the performance of all test methods worsens with shallower concentration-response curves, it is of partic-ular interest to consider this low value. Results were obtained assuming no gender difference or a 10-fold
dif-ference in LC50values for males and females.
Results
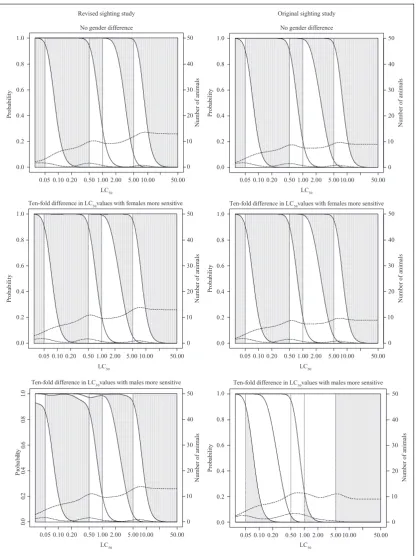
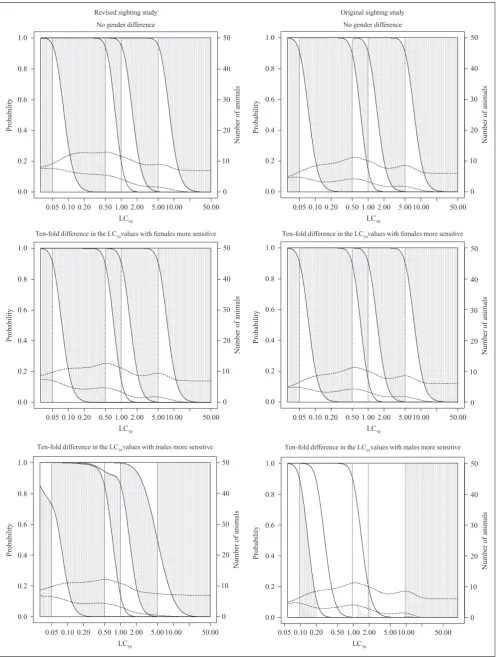
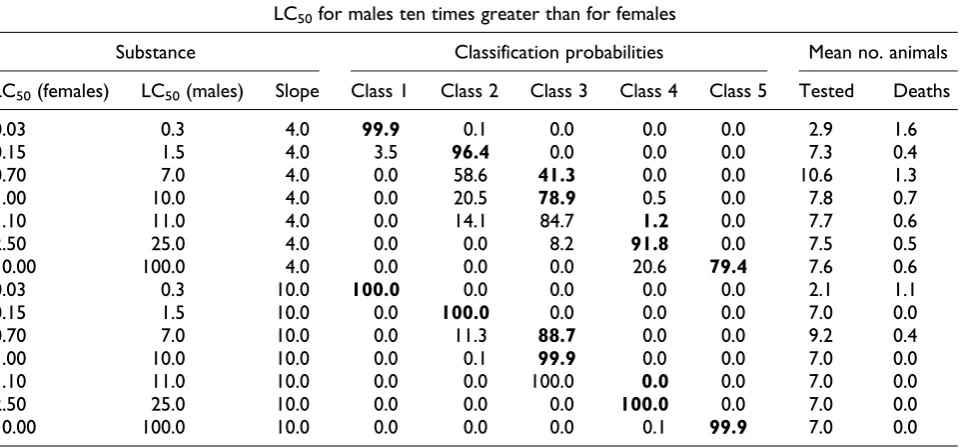
The results of the statistical evaluations for the three test procedures are summarized in Figures 4 and 5 and Tables 1–3. Figures 4 and 5 show some of the proper-ties of the procedure for hypothetical dusts and mists
with LC50 values ranging from 0.01 to 50 mg/L, R
equal to 5 and concentration-response curve slope values of 4. To assess the effect of the sighting study
starting concentration, the sighting study was
assumed to start at either 0.05 mg/L or 5 mg/L, i.e. at the highest or lowest test concentration. In each case, results were obtained assuming no gender
differ-ence or a 10-fold differdiffer-ence in LC50values for males
and females. For comparison purposes, the right-hand columns of Figures 4 and 5 include plots that show the properties of the FCP with the original single gender sighting study.
For each LC50value (plotted across the bottom of
the graph), the first vertically sloping line shows the probability (according to the scale on the left-hand axis) of classification into class 1, the second into class 1 or 2 (so that the difference this and the one below is the probability of classification into class 2), the third into class 1, 2 or 3 (so that the difference between this and the one below is the probability of classification into class 3) and so on. The vertical dotted lines give the correct classes based on the true
LC50 value and the dashed lines horizontally across
the plot show the expected number of animals and deaths (using the scale on the right-hand axis, with the higher line representing the number of animals). For
each LC50value, the height of the shaded areas gives
the probability of correct classification, the height of the area below the shaded area is the probability of classification into too toxic a class (impossible for true class 1) and the height of the area above the shaded area is the probability of classification into a class that is not toxic enough (impossible for true class 5). It should be noted in the interpretation of the
figures that true LC50 values are not evenly spread
across the range illustrated. In particular, substances
with higher LC50values are much more common than
those with the lower values. Properties of the proce-dures for the majority substances are thus given by the curves towards the right-hand side of the plots, although classification of more toxic substances remains important.
Tables 1 to 3 give the properties of the procedure
for hypothetical dusts and mists with LC50 values
0.05 0.10 0.20 0.50 1.00 2.00 5.00 10.00 50.00 0.05 0.10 0.20 0.50 1.00 2.00 5.00 10.00 50.00 0.0
0.2 0.4 0.6 0.8 1.0
0.0 0.2 0.4 0.6 0.8 1.0
Probability Probability
Probability
0 10 20 30 40 50
0 10 20 30 40 50
LC50
0.05 0.10 0.20 0.50 1.00 2.00 5.00 10.00 50.00 LC50
0.05 0.10 0.20 0.50 1.00 2.00 5.00 10.00 50.00
LC50
0 10 20 30 40 50
0 10 20 30 40 50
0.
0
0.
2
0.
4
0.
6
0.
8
1.
0
Pr
o
b
ab
ili
ty
No gender difference
Ten-fold difference in LC50values with females more sensitive
Ten-fold difference in LC50values with males more sensitive
Number of animals
Number of animals
Probability
Number of animals
Probability
Number of animals
0 10 20 30 40 50
Number of animals
0 10 20 30 40 50
Number of animals
Ten-fold difference in LC50values with males more sensitive
0.0 0.2 0.4 0.6 0.8 1.0
0.0 0.2 0.4 0.6 0.8 1.0
0.0 0.2 0.4 0.6 0.8 1.0
LC50
0.05 0.10 0.20 0.50 1.00 2.00 5.00 10.00 50.00 LC50
0.05 0.10 0.20 0.50 1.00 2.00 5.00 10.00 50.00 LC50
No gender difference
Ten-fold difference in LC50values with females more sensitive
[image:9.595.101.518.67.624.2]Revised sighting study Original sighting study
Figure 4.Classification probabilities and expected numbers of animals and deaths for the fixed concentration procedure (FCP) with the new sighting study for dusts and mists with concentration-response curve slope of 4 andR(LC50/TC50) of
5 assuming sighting study starting at 0.05 mg/L. Cumulative probabilities of classification (on left-hand axis scale) into each toxic class for LC50values are shown. The height of the shaded areas gives the probability of correct classification, the
height of the area below the shaded area is the probability of classification into too toxic a class and the height of the area above the shaded area is the probability of classification into a class that is not toxic enough. The dashed lines give expected number of animals and deaths (using the scale on the right-hand axis), with the top line indicating the number of animals used (see Results section for additional details).
5 and concentration-response curve slope values of 4 and 10. The sighting study starting concentration
was assumed to depend on the true LC50to reflect the
situation in which prior knowledge of the test sub-stance is used to choose the initial concentration. As such, for the hypothetical substances listed above, starting concentrations of 0.05, 0.05, 0.05, 0.5, 0.5, 1 and 5 mg/L were used, respectively. In practice, if prior knowledge was available to determine the sight-ing study startsight-ing concentration, a sightsight-ing study may not be needed and the procedure could commence with the main study. However, this would depend on the reliability of the prior information. As in the figures, results in the tables are presented assuming
no gender difference or a 10-fold difference in LC50
values for males and females. The probabilities of classification into the correct GHS class based on the
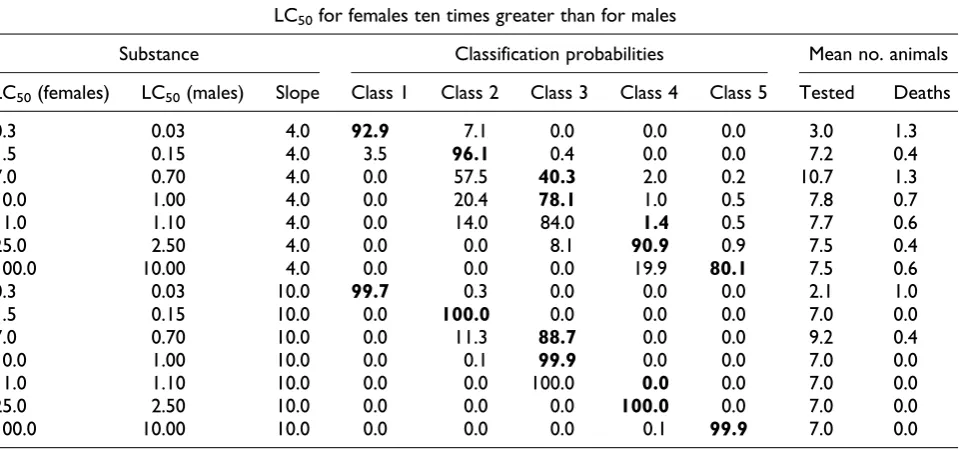
true LC50value are shown in bold.
In the absence of a gender difference, the new procedure is slightly more stringent than the FCP
using the original single-gender sighting study.5
For small gender differences, the performance of the procedure will be similar to that when there is no gender difference. However, as the difference between the genders increases, an observation of death or non-fatal toxicity in one of the genders drives the choice of starting concentration, and it is easier to identify the more sensitive gender for subsequent use in the main study. As such, in the presence of larger gender differences, the revised sighting study substantially improves the perfor-mance of the FCP.
The default for the FCP main study, which remains unchanged, is to use females. This means that the FCP with the revised sighting study is most like the FCP with the original single-gender sighting study when females are the more sensitive gender. In fact, a comparison of the probabilities in Table 2 (females more sensitive)
with those generated by Price et al.5for the case of no
gender difference using the original sighting study
shows nearly identical probabilities of correct
classification.
If males are more sensitive than females and the concentration-response curve is shallow, in this case a slope of 4, there is a small chance that evident toxicity or death will occur at the same concentration in both males and females. In this case, the main study would use females despite them being the less sensitive gen-der. The result of this is that the procedure is a little less stringent when males are more sensitive than females, with a slightly higher chance of misclassification into a
less toxic class. As shown in Table 3, this is particularly
true for substances with a true LC50 of 0.03 mg/L
belonging to the most toxic class 1. In this case, there
is a 7%chance of misclassification into the less toxic
class 2 when males are more sensitive than females
compared to a 0.1% chance when females are more
sensitive than males (Table 2). It should be stressed, however, that the chance of under-classification is small and certainly no larger than for other test proce-dures. The substantial under-classification observed
for the original female-only FCP5 when females are
less sensitive than males is avoided.
The number of animals required in the FCP with revised sighting study is, not surprisingly, slightly higher than for the FCP using the original sighting study, since the revised sighting study requires exposure of both males and females. When the sighting study starts
at a concentration above the LC50, the number of deaths
is also increased slightly. Despite this, the number of animals exposed and the number of deaths remain con-siderably lower than for other test procedures.
Discussion
In this paper, we have proposed a new sighting study for the FCP. In the original sighting study, a single female animal is tested at each concentration in order to determine an appropriate starting concentration for the main study. The main study is then conducted using females. In the revised sighting study, two ani-mals, one male and one female, are tested at each con-centration. If a gender difference is apparent, the main study is conducted in the more sensitive gender, oth-erwise females are used.
This modification is proposed in light of our previ-ous analyses that demonstrated the potential for gen-der differences in sensitivity to acute inhalation toxicity, with males or females being the more sensi-tive gender, and the impaired performance of the FCP
when males are more sensitive.5 In the absence of a
gender difference, the classification performance of the FCP is good and is broadly comparable to both the
LC50method (OECD TG 4031) and the ATC method
(OECD TG 4362), which are currently used for the
assessment of acute inhalation toxicity.
No gender difference
Ten-fold difference in the LC50values with females more sensitive
Ten-fold difference in the LC50values with males more sensitive
No gender difference
Ten-fold difference in the LC50values with females more sensitive
Ten-fold difference in the LC50values with males more sensitive Revised sighting study Original sighting study
0.0 0.2 0.4 0.6 0.8 1.0
Probability
0.0 0.2 0.4 0.6 0.8 1.0
Probability
0.0 0.2 0.4 0.6 0.8 1.0
Probability
0.0 0.2 0.4 0.6 0.8 1.0
Probability
0.0 0.2 0.4 0.6 0.8 1.0
Probability
0.0 0.2 0.4 0.6 0.8 1.0
Probability
0 10 20 30 40 50
Number of animals
0 10 20 30 40 50
Number of animals
0 10
20 30 40 50
Number of animals
0 10 20 30 40 50
Number of animals
0 10 20 30 40 50
Number of animals
0 10 20 30 40 50
Number of animals
0.05 0.10 0.20 0.50 1.00 2.00 5.00 10.00 50.00 LC50
0.05 0.10 0.20 0.50 1.00 2.00 5.00 10.00 50.00 LC50
0.05 0.10 0.20 0.50 1.00 2.00 5.00 10.00 50.00 LC50
0.05 0.10 0.20 0.50 1.00 2.00 5.00 10.00 50.00 LC50
0.05 0.10 0.20 0.50 1.00 2.00 5.00 10.00 50.00 LC50
[image:11.595.52.553.65.723.2]0.05 0.10 0.20 0.50 1.00 2.00 5.00 10.00 50.00 LC50
Figure 5.Classification probabilities and expected numbers of animals and deaths for the fixed concentration procedure (FCP) with the new sighting study for dusts and mists with concentration-response curve slope of 4 andR(LC50/TC50) of 5
assuming sighting study starting at 5 mg/L (see legend to Figure 4 and Results section text for additional details).
concentration. To illustrate this, suppose that evident toxicity is possible at 1 mg/L but very unlikely at any lower concentration. According to the original sight-ing study, if toxicity is observed for the ssight-ingle animal tested at 1 mg/L, the main study will start at 1 mg/L. If toxicity is not observed, the main study will start at 5 mg/L. With the modified sighting study, the main study will start at 1 mg/L if either of the two animals tested at 1 mg/L demonstrate toxicity, and at 5 mg/L otherwise. The probability of observing signs of toxi-city in at least one animal is obviously higher when
two animals are observed than when one is observed, so that the lower starting concentration is more likely for the revised sighting study than for the original. This in turn leads to an increased chance of observing evident toxicity or death at the lower concentration, and hence to a more stringent classification.
[image:12.595.50.537.95.302.2]If females are more sensitive than males, the classi-fication properties of the new procedure are nearly identical to those of the original FCP, which uses females by default. Moreover, the larger the gender difference, the more similar the procedures become
Table 2.Classification probabilities and expected numbers of animals and deaths for the fixed concentration procedure (FCP) with the new sighting study for dusts and mists assuming females are more sensitive (see text for more details)
LC50for males ten times greater than for females
Substance Classification probabilities Mean no. animals
LC50(females) LC50(males) Slope Class 1 Class 2 Class 3 Class 4 Class 5 Tested Deaths
0.03 0.3 4.0 99.9 0.1 0.0 0.0 0.0 2.9 1.6
0.15 1.5 4.0 3.5 96.4 0.0 0.0 0.0 7.3 0.4
0.70 7.0 4.0 0.0 58.6 41.3 0.0 0.0 10.6 1.3
1.00 10.0 4.0 0.0 20.5 78.9 0.5 0.0 7.8 0.7
1.10 11.0 4.0 0.0 14.1 84.7 1.2 0.0 7.7 0.6
2.50 25.0 4.0 0.0 0.0 8.2 91.8 0.0 7.5 0.5
10.00 100.0 4.0 0.0 0.0 0.0 20.6 79.4 7.6 0.6
0.03 0.3 10.0 100.0 0.0 0.0 0.0 0.0 2.1 1.1
0.15 1.5 10.0 0.0 100.0 0.0 0.0 0.0 7.0 0.0
0.70 7.0 10.0 0.0 11.3 88.7 0.0 0.0 9.2 0.4
1.00 10.0 10.0 0.0 0.1 99.9 0.0 0.0 7.0 0.0
1.10 11.0 10.0 0.0 0.0 100.0 0.0 0.0 7.0 0.0
2.50 25.0 10.0 0.0 0.0 0.0 100.0 0.0 7.0 0.0
[image:12.595.53.535.351.575.2]10.00 100.0 10.0 0.0 0.0 0.0 0.1 99.9 7.0 0.0
Table 1.Classification probabilities and expected numbers of animals and deaths for the fixed concentration procedure (FCP) with the new sighting study for dusts and mists assuming no gender difference (see text for more details)
Substance Classification probabilities Mean no. animals
LC50 Slope Class 1 Class 2 Class 3 Class 4 Class 5 Tested Deaths
0.03 4.0 100.0 0.0 0.0 0.0 0.0 2.2 1.8
0.15 4.0 6.3 93.7 0.0 0.0 0.0 6.8 0.3
0.70 4.0 0.0 69.1 30.9 0.0 0.0 10.2 1.3
1.00 4.0 0.0 29.6 70.3 0.0 0.0 7.6 0.7
1.10 4.0 0.0 21.5 78.5 0.1 0.0 7.4 0.5
2.50 4.0 0.0 0.0 13.3 86.7 0.0 7.3 0.4
10.00 4.0 0.0 0.0 0.0 29.6 70.4 7.6 0.7
0.03 10.0 100.0 0.0 0.0 0.0 0.0 2.0 2.0
0.15 10.0 0.0 100.0 0.0 0.0 0.0 7.0 0.0
0.70 10.0 0.0 17.7 82.3 0.0 0.0 9.2 0.5
1.00 10.0 0.0 0.3 99.7 0.0 0.0 7.0 0.0
1.10 10.0 0.0 0.1 99.9 0.0 0.0 7.0 0.0
2.50 10.0 0.0 0.0 0.0 100.0 0.0 7.0 0.0
due to the increased likelihood of selecting females for the main study.
If males are more sensitive than females, the original procedure, which does not generally test males, carries a high risk of under-classifying substances. This was a cause for concern given that males have been shown to be more sensitive than females to some substances, and that this might not be anticipated prior to testing. While the new procedure, which includes males in the sighting study, does not completely eradicate under-classification, it corrects the tendency of the original FCP to substantially under-classify substances when males are more sensitive than females.
As in previous similar statistical evaluations, the results are based on the assumption that concentration-response curves are of the probit form. An additional assumption is that these curves have equal slopes for males and for females and for lethality and toxicity. Whilst further evaluations could be conducted based on different statistical modelling assumptions, the qualita-tive comparison of the procedures is unlikely to be changed.
In all cases, the new procedure uses a slightly larger number of animals than the original FCP, since pairs of animals rather than single females are now required in the sighting study. However, animal numbers remain considerably lower than for other test methods, and the test continues to provide a refinement. We therefore consider that this additional cost is worthwhile in light of the improved characteristics of the new procedure.
Funding
The National Centre for the Replacement, Refinement and Reduction of Animals in Research (NC3Rs) provided financial support for this work.
References
1. OECD.Guidelines for the testing of chemical substances. No. 403. Acute inhalation toxicity. Paris, 1981.
2. OECD. Guidelines for the testing of chemical sub-stances. No. 436. Acute inhalation toxicity – acute toxic class method. Paris, 2009.
3. OECD.Guidelines for testing of chemical substances. Draft No. 433. Acute inhalation toxicity – fixed con-centration procedure. Paris, 2004.
4. Stallard N, Whitehead A, Indans I. Statistical evaluation of the fixed concentration procedure for acute inhala-tion toxicity assessment. Hum Exp Toxicol2003; 22: 575–585.
5. Price C, Stallard N, Creton S, et al. A statistical evalua-tion of the effects of gender differences in assessment of acute inhalation toxicity.Hum Exp Toxicol2010. DOI 10.1177/0960327110370982.
6. OECD. Harmonized integrated hazard classification system for human health and environmental effects of chemical substances. Paris, 1998.
[image:13.595.67.547.99.324.2]7. Greiner M. ‘Report on biostatistical performance assessment of draft TG 436 acute toxic class method for acute inhalation toxicity,’ 2008, http://www. oecd.org/ LongAbstract/0,3425,en_33873108_33844437_41762050_ 1_1_1_1,00.html (2008). Accessed 23 April 2010.
Table 3.Classification probabilities and expected numbers of animals and deaths for the fixed concentration procedure (FCP) with the new sighting study for dusts and mists assuming males are more sensitive (see text for more details)
LC50for females ten times greater than for males
Substance Classification probabilities Mean no. animals
LC50(females) LC50(males) Slope Class 1 Class 2 Class 3 Class 4 Class 5 Tested Deaths
0.3 0.03 4.0 92.9 7.1 0.0 0.0 0.0 3.0 1.3
1.5 0.15 4.0 3.5 96.1 0.4 0.0 0.0 7.2 0.4
7.0 0.70 4.0 0.0 57.5 40.3 2.0 0.2 10.7 1.3
10.0 1.00 4.0 0.0 20.4 78.1 1.0 0.5 7.8 0.7
11.0 1.10 4.0 0.0 14.0 84.0 1.4 0.5 7.7 0.6
25.0 2.50 4.0 0.0 0.0 8.1 90.9 0.9 7.5 0.4
100.0 10.00 4.0 0.0 0.0 0.0 19.9 80.1 7.5 0.6
0.3 0.03 10.0 99.7 0.3 0.0 0.0 0.0 2.1 1.0
1.5 0.15 10.0 0.0 100.0 0.0 0.0 0.0 7.0 0.0
7.0 0.70 10.0 0.0 11.3 88.7 0.0 0.0 9.2 0.4
10.0 1.00 10.0 0.0 0.1 99.9 0.0 0.0 7.0 0.0
11.0 1.10 10.0 0.0 0.0 100.0 0.0 0.0 7.0 0.0
25.0 2.50 10.0 0.0 0.0 0.0 100.0 0.0 7.0 0.0
100.0 10.00 10.0 0.0 0.0 0.0 0.1 99.9 7.0 0.0