Faculty of Electrical Engineering,
Mathematics & Computer Science
BLE Localization
Using Switched-beam
Angle Of Arrival
For Pallet Localization In WarehousesThijs de Haan
M.Sc. Thesis
October 17, 2018
Supervisors:
BLE Localization
Using Switched-beam Angle Of Arrival
For Pallet Localization In Warehouses
Thijs de Haan
M.Sc. Thesis – October 17, 2018
Abstract—In the supply chain logistics, a lot of errors can occur that can be overcome by implementing a wireless sensor network (WSN) in the RTI’s. This can add a new layer of monitoring to the process. The localization of nodes covers an important part of that. This paper supplies a survey on the architecture, topology and methodology for localizing mobile nodes, specialized on the logistic field. Furthermore, a new circuit board with switched-beam Bluetooth transceivers in eight different directions is evaluated. It can apply the Angle Of Arrival technique to perform localization by comparing a measurement with multiple models. It can reach an accuracy of around 2◦ in an anechoic chamber, but different altitudes and polarizations from the target severely influence the outcome.
Keywords: Wireless Sensor Networks, Supply Chain, Logis-tics, Localization, Bluetooth Low Energy, Angle Of Arrival, Switched-beam, Directional Antenna.
CONTENTS
I Introduction 1
II Logistic Process 2
II-A Assets . . . 3
II-A1 Facilities . . . 3
II-A2 Transporting Network . . . . 3
II-A3 Transport Means . . . 3
II-A4 RTIs . . . 3
II-B Events . . . 3
II-B1 Sorting . . . 3
II-B2 Stocking . . . 3
II-B3 Check-up . . . 3
II-C Business rules . . . 3
III Positioning in logistics 4 III-A Main focus: tracking and monitoring RTIs 4 III-B Properties of localization . . . 4
III-C Metrics of localization . . . 5
III-D Types of waves and their properties . . 5
III-E Localization techniques: triangulation . 6 III-F Other localization techniques . . . 7
IV Localization composition 8 IV-A Localization architecture . . . 8
IV-B Localization topology . . . 8
IV-C Localization methodology . . . 9
V Integration 10 V-A Localization protocols . . . 10
V-B Localization methods . . . 12
V-C Localization techniques . . . 12
VI Research scope 13 VI-A AOA: added value . . . 13
VI-B Current Angle Of Arrival Systems . . . 13
VII Research: switched-beam system test 14 VII-A Test 1: PCB / Dongle measurements . . 15
VII-B Test 2: elaborate 360◦rotation measure-ments . . . 15
VII-C Test 3: evaluation of theta . . . 16
VII-D Converting measurements to angles . . 16
VII-E Proximity based on RSS . . . 18
VII-F Calibrating signal power . . . 19
VII-G Determining the accuracy of the system 19 VII-H Inaccuracies uncovered . . . 20
VII-I Number of antennas . . . 22
VII-J Indoor experiment . . . 22
VII-K Conclusions . . . 23
VIII Future study 23 VIII-A Improvements . . . 23
VIII-B Architecture . . . 24
VIII-C Accurate positioning . . . 24
I. INTRODUCTION
Supply chain logistics involve a huge array of products and services, companies, people, trucks, containers, pallets, ware-houses, distribution centres and more. A typical distribution centre or trucking company serves many different customers. Different companies have different procedures, systems and software. Mapping all of that is a challenge in itself – never mind harmonizing it into one, perfectly streamlined process.
Within the field of Wireless Sensor Networks (WSNs), a lot of research has been done concerning mobile nodes, communication and localization. Adding the WSN technology to the logistics will create a new layer of tracking, handling and monitoring the goods which could potentially improve the logistic chain significantly.
process. The main focus is the part of implementing a posi-tioning strategy for the aforementioned purpose. This implies an overview of the architecture, topology and methodology of localization techniques for multiple mobile nodes within a static, arranged environment.
This overview then comes to the proposal of a research within the subject. After the analysis of different techniques and systems, a strategy is chosen and research questions have been formed to find out how the system can best be integrated to use in practice.
The paper concludes with the report of a research of a possible device that could be used for angulation to localize Bluetooth nodes within a warehouse. This device was tested in an anechoic chamber, from where models were created on how signals from different angles are being received and how accurate this angle can be derived.
Similar studies
There is a lot of research performed on WSNs and localiza-tion. This type of scenario which is very dynamic, uses a lot of nodes on batteries and many gateways, is specified more particular as Dynamic Wireless Sensor Networks (DWSN).
The specific case for localization within logistics was intro-duced by Patwari et al. in 2005 [1]. It mentions J. Kumagai and S. Cherry who described what probably is the first large scale application of RFID technology within logistics. Readers at the warehouse loading docks of a port scan each pallet and case of goods automatically, reducing labor costs, theft, and errors [2].
The case is further elaborated on by Evers et al. in 2005 [3]. In 2007, Evers et al. presented Sensorscheme: a platform for realizing a specific scenario within the same topic [4]. The paper focusses on the proceedings of an individual node and involved business rules, not so much on the localization part. Fogel et al. elaborated on the localization of pallets in ware-houses using the combination of radio waves and ultrasound chirping [5]. They did a research with the assumption of Line of Sight (LOS), which is not very realistic: the lack of LOS is almost inevitable and will have a big impact on the accuracy of the positioning. Spieker and R¨ohrig analyse the applications of a special sensor network (nanoLOC System) for operations within the warehouse management [6], 2008. They achieved less than half a meter accuracy on an approximately 9x3 meter rack using four beacons and measuring the Received Signal Strength with LOS. Measurements without LOS lead to an error of more than a meter.
Bijwaard et al. went to the case of cold chain logistics and presented a WSN with SmartPoints: nodes that collect data, connect to an ambient network and via internet to a BackOffice application [7]. This case is particularly interesting because of its focus on the communication issues that occur.
[image:4.612.324.552.53.240.2]The main topic where this paper distinguishes itself from earlier researches about the same topic, is the focus on finding a localization strategy that is applicable in warehouses of various dimensions that is robust to no LOS.
Figure 2.1: Logistic chain from factory to end consumer
II. LOGISTICPROCESS
The logistic process is all about transporting goods from a source to a destination. Goods are wrapped up and often merged together in packages, transported among maybe thou-sand other packages at the time. Using multiple transportation vehicles, they are brought to several places where they have to be sorted again to be transported to the next place before they reach their destination. To give an indication, a regular product follows the stages as displayed in figure 2.1. Based on the destination, a transport plan is constructed. The first stage is a shipment over a long distance. Goods are transported towards the harbour, sorted, loaded onto the ship, unloaded at the next harbour, sorted again and transported to the distribution centre. Once at the distribution centre, it needs to be sorted again and perhaps the quality needs to be checked. The instructions for each package or load is shared in advance via internet and paperwork. Tens or hundreds of employees form a part of the system that performs the sorting and checking. Packages furthermore have to be stocked among hundreds or thousands of other goods inside a warehouse, for a definite or indefinite amount of time before they get processed again for departure. After one or maybe more distribution centres and several cases of sorting, stocking and check-ups, the next step of the product is to get sent to a consumer via a courier company or via a local shop like a retailer. The sorting centre or retailer has its own warehouse where the sorting, stocking and quality check are performed again.
disturbances might not even be able to be traced. If anything in the chain goes wrong, all the later stages of the chain are affected by it. If a part of a load is missing on a truck, the truck will not be fully packed and another truck will have to collect the missing packages afterwards, severely decreasing the efficiency. Solving this complex issue would save a lot of time, money and waste.
A. Assets
For the transportation, holding, protection and securing of the product, several assets are used. The following need to be distinguished.
1) Facilities: static environments in which the sorting or stocking takes place. In most cases this is a building, but it can be a parking lot as well. A warehouse, the typical place where the localization becomes most relevant, is an environment that brings several challenges. The buildings can be very large, so it might require a lot of gateways and beacons to cover the whole area and these must cooperate with each other in one system. The roof can be very high, which will become a challenge for localization when the beacons are so high from the ground. The nodes that have to be positioned inside can become large in numbers, condensed and stocked on top of each other.
2) Transporting Network: the physical network that pro-vides the connection between facilities, like for example roads, rails, waterways, the airspace, pipelines or even wires. It also includes internal transportation provision within a facility – the so called intralogistics – where the conveyor-belt is a typical addition to the mentioned examples.
The modalityis a term to define the mode of transport: the use of a transporting network including possibly a transport mean. If multiple modalities are used to transport a product, we speak about multimodality or intermodality.
3) Transport Means: the vehicles that are used for trans-porting the goods among different distribution centres or facil-ities. These include trucks, tractors, ships, trains and airplanes. It also includes materials handling: the management of transporting goods within a facility. This includes forklifts, warehouse trucks (like narrow-aisle trucks, order picking trucks, stackers or pallet transfer trucks), Automated Guided Vehicles (AGV’s) and a crane [8].
Finally, non-vehicle or manual movement (transportation by hand or using a manual pallet truck) is also considered a transport mean.
4) RTIs: a Returnable Transport Item is used to store goods and being able to transport, and be returned and reused an indefinite amount of times. There are roughly three types of RTIs to be distinguished: transport equipment, load carriers and secondary packaging.
“Transport Equipment is defined as a piece of high-value equipment used to hold, protect or secure cargo for trans-portation purposes.” [9] One can think of trailers, wagons or intermodal containers. Load carriers are smaller and cheaper like pallets, roll containers, dolly’s, garment racks et cetera. Secondary packaging like totes, buckets and plastic crates are smaller and suitable to carry by hand.
B. Events
As mentioned before, the goods might be sorted, stocked or checked for their conditions at a facility like the distribution centre.
1) Sorting: identification and transportation to a desti-nation within the warehouse. For decades, Optical Barcode Systems (OBS) are used to identify packages. The barcode needs to be scanned by an employee which monitors and tracks the package. This is time-consuming, error-prone and only allows discrete-time tracking [3]. Furthermore, RFID-tags are sometimes used instead of the barcode. This has some advantages but the essence, identification, is the same. It is possible that barcodes or RFID-tags get damaged or mistaken when an expired one is still present at the RTI.
Information about the RTI is gathered in the database of the Central System (CS). Via internet, this information is retrieved from a back-end server. The RTI specific instructions are translated by the CS into order associations which are synchronized with the RTI its node and transmitted to the employee.
Once an RTI is identified and the destination is known, it is transported to for example a sorting spot: a square drawn on the ground. There might not always be space enough in the sorting spot and this process is vulnerable to human errors. From a sorting spot, RTIs can be loaded onto a truck. Another destination can be the local stock.
2) Stocking: keeping the package for a short or longer period in the storage of a warehouse.In big warehouses they use dozens or hundreds of tall racks for this, which creates a organizational challenge. A computer is often used to take care of this: it assigns a spot and registers the RTI so it cannot get lost or be forgotten. A narrow-aisle truck is used to guide the RTI to the right spot. In some warehouses, this transportation is partially or fully automated in order to prevent any mistakes.
3) Check-up: quality of the load and satisfaction of the stocking conditions.Most packages do not have more require-ments than to be kept dry and at usual temperatures. Other supplies might be more demanding. For example the temper-ature in cold chain logistics must be treated very delicate. Other packages contain very fragile goods so heavy bumps are prohibited. Another possible constraint is gasses in the air: some goods like bananas must not be stored close to goods that contain coffee beans that emit ethylene gas, influencing the bananas ripening process. Some gallons of liquid corrosive (acid) material cannot be stored within 6 meter from a base and a flammable material cannot be stored within 6 meter from an oxidizer. All these constraints that are bound to an individual RTI need to be met, which is a major challenge. Violation of these stocking conditions and damaging of the load needs to be traced, corrected, logged and passed on to the back-end server.
C. Business rules
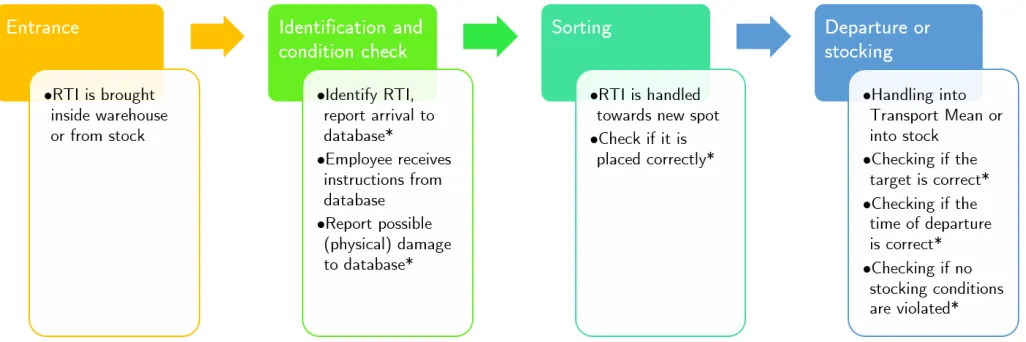
Figure 2.2 shows a simplified diagram of the process for any RTI that is being transferred. There is a distinguish between four stages and each stage contains its own business rules
Figure 2.2: Transportation process and business rules within a warehouse
partially or fully covered by a system with wireless connected nodes integrated in the RTIs.
In case of damaged goods, an employee is still required to perform a check. However, an integrated temperature sensor and accelerometer in the RTI can recover more information about possible damages than is visible at first glance, and it can keep log of relevant events. These logs are shared with the Central System (CS) and passed on to the back-end server. Also the moments of arrival and departure are relevant for the CS to derive and passed on to the back-end server.
Considering all the check-ups, they are at risk to be omitted by the employee. An autonomous node that is integrated in the concerning RTI and is able to localize itself and interact with a CS, can easily cover this part of the BRs and thus give useful support. The next chapter elaborates on how this system might look like.
III. POSITIONING IN LOGISTICS
The rest of this paper will focus on positioning within the logistics only. The distribution of data and the data logging are omitted. The stocking conditions check however, will be discussed regularly because it is closely related to the property of positioning.
A. Main focus: tracking and monitoring RTIs
For a better control on the logistic process, it is inter-esting to follow the path of a product more accurate than is accomplished nowadays. One can for example trace the transporting equipment that transports an intermodal container, trace the container that contains pallets, trace the pallet that carries boxes, trace the box that carries goods and trace the goods themselves. Ideally, all the goods can be traced. In practice, this is a bit redundant: multiple goods with the same destination are often bundled within an RTI for their whole journey. Workers at a distribution centre think in terms of those RTIs, not what they contain. It is more likely that an RTI gets lost in the process than that a product separates from an RTI, and it is more lucrative to solve the loss of an RTI than possible lost products. It makes therefore most sense to focus on the RTI in the form of load carriers like a pallet
or roll container. Furthermore, it would be fruitful to monitor behaviour and circumstances of each RTI: measure clashes and temperature changes, log it and send out a warning if necessary. Nowadays RTIs are tagged with a barcode or RFID-chip, which requires a user to scan and verify its location. Enabling the RTI to be localized from distance or localize itself using radio communication, creates the opportunity for real-time tracking and to add a new layer of monitoring the RTIs.
B. Properties of localization
Concerning positioning, there are several properties to take into account. For different positioning applications, the prop-erties basically tell what the method is capable of – regardless of how good it performs in it.
Within a warehouse, acoverageof all three dimensions are relevant: RTIs can be stored high up in a rack [10]. Within a truck, it might be useful to know which RTIs are in the back or near the entrance.
Thephysicallocation of a mobile target is expressed in the form of coordinates, like from GPS. The absolute location is the three dimensional position of the node within a shared reference grid for all located targets [11, 12].
The reception of a signal gives information of theproximity
between two devices, like that a node is located near beacons or among other nodes. This is actually a positioning technique (mentioned in section III-F). By estimating this distance, the
relativeposition can be derived between the nodes or beacons. Related to this is symboliclocalization: a target is located in a room, on a sorting spot, on a rack or near the entrance of a building. A node can derive that it is on the right sorting spot if it knows that its surrounding nodes have the same destination, or derive that it is at the wrong place if its destination differs from that of surrounding nodes. Furthermore it might be able to approximate its position based on the number of hopsto a gateway or node of interest.
moving direction. For a pallet, it would be useful to retrieve the view direction if the antenna is located at the side of the pallet: that would determine on which side of where the device is positioned, the corresponding load is located. This does not account for a pallet with the antenna in the center.
It is useful for an RTI to be able to detectmovement. When static, both the Central System (CS) and the RTI know its position. When the RTI detects movement, it knows that it is being handled and that its position will be changed. This information is also relevant to the central computer so this can be communicated. While being transported, it is optional to track the movement.
C. Metrics of localization
Different techniques have their up and downsides. The performance of positioning systems are expressed in terms of metrics. The choice of a technique that is suitable for a certain application is made by making a trade-off between performance metrics described in this section.
The responsiveness means how often a nodes position is updated per amount of time [10]. It makes sense that if a node stays unmoved within a static environment, it is sufficient to determine its absolute position only once. However when it is moved, the position becomes uncertain and the positioning frequency should go up in order to keep track of its position. Considering its relative position, it is often based on dynamic surroundings like other nodes: they can change over time. When a node needs to keep track of these changes – for example when goods of other RTIs can cause harm to the goods in its own RTI – it should regularly re-determine its relative position. There can also be a scenario where the composition of RTIs does not change, like when they are being shipped in a container. For a node that takes note of this, it is sufficient to determine its relative position and surroundings only in the early stages when it is loaded.
Some positioning methods are more accuratethan others. Usually, the accuracy is expressed as the average Euclidean distance between real and estimated location [10, 11]. Preci-sion can be defined as “the success probability of a position estimation with respect to the predefined accuracy” [13–15]. It makes sense that the error should be less than 80 centimeter for the case of ordinary 0.8 by 1.2 meter pallets that need to be positioned at racks with 1.5 meter high floors. Of course the required accuracy can vary. One could afford a bigger error when a target is traced during transportation. The exact position is obviously changing and it is now relevant to know what its direction is. To find that out, the position should now be calculated more regularly - say once every four seconds. With an accuracy of less than five meters, it is still possible to derive the movement of the pallet over the big and long trajectories within a warehouse.
[image:7.612.312.564.54.222.2]The complexity of the localization algorithm should be feasible: the computing power and battery supply of a node might be limited [10, 11]. The Central System (CS) should be capable to handle more complexity. Hardware, software, and deployment can form an issue [15].
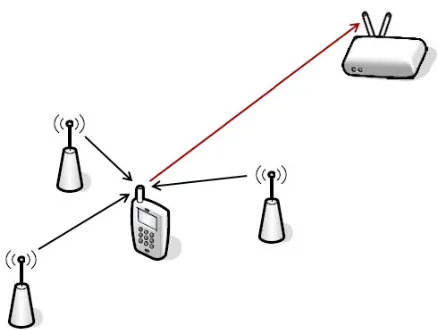
Figure 3.3: Four measuring methods for triangulation, obtained from [16]
The performance might be influenced by changing environ-ments: the localization of an RTI in an empty warehouse will be far more accurate than when it is surrounded by goods. The system must be able to handle these disturbances, what is calledrobustnessor adaptiveness[10, 11, 15].
The system must also be scalable [10, 11, 15]. It might be affordable to place less beacons in a warehouse and cover a bigger area per beacon, but the accuracy will then decrease and the system will be less capable of handling a large amount of nodes.
The system must be affordable. Thecostof the installation, maintenance and power consumption of the nodes, beacons and CS can become an issue [10–12, 15]. At least, the cost must not exceed the benefits.
An elaborate overview of the up and downsides of different positioning methods in terms of metrics is given in [15].
D. Types of waves and their properties
Waves occur in a lot of forms and circumstances, with various properties. Often used in WSNs are acoustic, radio and optic waves.
All three of those types have the ability to provide commu-nication and localization, but there are some up and downsides. Acoustic waves use a relatively low frequencies. The audible frequencies and low ultrasound frequencies are often used because they propagate best in air. Higher ultrasound frequen-cies are often used underwater. Generally, higher frequenfrequen-cies have bigger attenuation. A low frequency implies a smaller bandwidth and, according to the Nyquist formula, it can carry less information. In addition, acoustic waves are way slower so they bring are even more challenges like a higher chance of collisions between messages.
signal is lost. To use optical communication, Line of Sight (LoS) or at least high-quality reflections are required.
The frequencies of radio waves are precisely in between these spectra. Depending on the frequency, the properties of diffraction and penetration of objects can be achieved and a high data rate can be facilitated. Especially the UHF band, the spectrum between 300 MHz and 3 GHz, is widely used for any communication network.
Propagation and fading
One important property of a wave for localization is the propagation. If a wave propagates isotropic, the power of the signal decreases exponentially with the distance. However, most antennas are not perfectly isotropic and signals might be absorbed by obstacles, resulting in large scale fading. Fur-thermore, the signal will be diffracted, reflected and scattered, leading to multipaths and self-interference [17]. All these effects of small scale fading will influence the strength of a signal at a certain point where it might be received. Small scale fading depends on the frequency: it is possible that some specific channels are in a frequency dip. A simple but widely used solution is to use more frequencies, called spread spectrum. This will give a better accuracy in localization.
E. Localization techniques: triangulation
There are three important properties of waves that are used to derive the location of the source: its direction, the attenuation and the duration of its propagation. Respectively, the Angle of Arrival (AOA), theReceived Signal Strength
(RSS) and the Time of Flight (TOF) can be measured. The process to determine the location from these properties is called triangulation. It consists of two methods: angulation
where the AOA is used to determine an angle and lateration
where RSS or TOF are used to determine a distance from source to measurement spot [10, 11, 15]. If lateration is used, the method should be called trilateration instead of triangulation. This term is however not very familiar.
The angulation method (sometimes called DOA from Di-rection Of Arrival) requires a measurement point that has directional antennas or an array of antennas [11, 15]. Based on the strength of reception on different pre-defined angles, the position of the source of a signal can be derived relative to the measurement spot. The distance is unknown, so at least two measurements are required to approximate the exact position. This method is often used for 2-D positioning, because two measuring devices only derive the angle in two dimensions. It is possible to use a third device that oriented differently, in order to obtain the angle in the third dimension .
Note that the reliability of this method might be influenced by small scale fading and the accuracy degrades as the target is further away from the measuring unit [11, 15]
The lateration method is used to calculate the distance from source to measurement spot. It can be RSS-based(or Signal Attenuation-Based) orTOF-based.
The RSS-based method implies deriving the distance be-tween the mobile target and the measurement unit using the signal’s attenuation. The RSS-value is compared with a the-oretical model in order to determine the corresponding range [11, 15, 18]. The attenuation is very vulnerable to large-scale fading and is also non-linear. Furthermore, measured RSS-values are influenced by multipath fading [17]. For example, a dipole antenna does not emit the same strength to every direction and waves can be reflected or absorbed by the environment. Besides a theoretical model, empirical models can be used based on first collect features (fingerprints) of a scene. This is known as the Fingerprinting based or Scene Analysismethod [11, 15].
The TOF-based method implies deriving the distance by multiplying the TOF with the radio signal velocity. TOF can be used for trilateration or multilateration: the use of three or more reference points. With only one beacon that derives its distance to a target, only a circle (or sphere in 3-D) on which the target might be is known. In order to approximate the exact location, at least three distances must be used for reference [11]. It is also possible to achieve this with a combination of angulation and lateration: for example when one measuring unit derives both the direction of the signal and the distance to the source. However, given the possible indoor lack of Line of Sight and multipath propagation, it is advisable to gain multiple references and use a weighted least-squares algorithm in order to obtain a better accuracy.
The TOF can be derived from theTime of Arrival (TOA) when the time of emission is known. The only way to achieve this is to synchronize the clocks between the node and beacon very precisely: every ns error creates 30 cm positioning error. There are also methods that do not require clock synchroniza-tion with the target.
Because sound is so much slower, its TOF is easy to compute when it is combined with radio communication. An application is can be found at the Cricket localization-support system that makes use of ultrasound transmitters [12, 19]. The sound wave is only used for distance estimation, not for data transmission.
One way to measure distance with radio without clock synchronization, is by measuringRound-trip Time of Flight
(RTOF). The technique is also called Two Way Ranging (TWR). This means that measuring unit sends a signal to the target, waits for response and measures the time in between or the Round Trip Time (RTT). Subtracting the processing time at the other device results in twice the TOF. This technique requires an extra transmission per measuring device. Another difficulty is the error caused by clock crystal drift between the nodes. A more advanced version of this is Symmetric Double Sided Two-Way Ranging (SDS-TWR). This method uses three messages to estimate the distance and reduce the error from the clock drift [20]. Usually, these three messages form one computation and from multiple computations, an average is taken. For 3-D positioning this needs to be performed with at least three reference points.
Another way to determine the TOF without synchronizing the clock between transmitter and receiver is by measuring the
Figure 3.4: TDOA-FC: TDOA without time synchronization
three pairs of reference points with a known location where the TOA is measured. From the differences, the relative position of the mobile target with respect to the reference points is calculated [10, 11, 15]. Note that the TDOA techniques does not require time synchronization with the mobile target, but it does for among the receivers. This is a bit complex, especially when performed over a huge area containing tens or hundreds of receivers.
Because both RTOA and TDOA suffer from inaccuracies caused by the clock drift, usually multiple measurements are performed to take an average. A better accuracy therefore requires more time, energy and use of the ether from the components.
There is also another possibility for TDOA to position a target, using the RTOA principle to bypass the requirement of time synchronization. Imagine beacons, placed like a hexago-nal grid, with a gateway in the middle of each hexagon. Two neighbouring beacons form a triangle with a gateway nearby. This setup is illustrated in figure 3.4. Just like with RTOA, the beacons retransmit a message, only this time it is forwarded to the gateway. Because the distance to the beacons is known, the TDOA can be derived for all three of the receivers and the distance to the mobile node can be calculated. The technique will for now be called Time Difference of Arrival using Forwarded Components (TDOA-FC). The gateway should be able to maintain a connection with six beacons (better called forwarders) and mobile nodes at once. The grid does not necessarily have to be hexagonal: with a square grid, the gateway only needs to connect with four forwarders. Each forwarder should have its own channel and should not forward messages from other forwarders, leading to endless repetition. A simple solution for this is when they identify themselves in every packet they (re)transmit.
[image:9.612.353.526.67.216.2]The big problem with this new introduced technique is that it is more difficult than to apply time synchronization and use TDOA. The forwarder will again have the problem of clock drift. The way to overcome this would be to design a protocol where the forwarders and the gateway synchronize with each other at every measurement. The advantage is that this method might exempt the mobile node from some transmissions, but
Figure 3.5: TDOA-MC: TDOA and AOA with one reflection
it needs to be developed yet.
The authors of [21] found a way to measure the distance to a target with only one antenna and no need for time synchronization, measuring the multipath components. This is called Time Difference of Arrival between Multipath Components(TDOA-MC). This can be translated into figure 3.5. If the (perfectly flat) ceiling would provide a good reflection, both the distance and angle can be measured based on only one signal. Of course the reflection will interfere with the original signal, leading to a probably even bigger challenge.
Another option is the use of array antennas. If two antennas are very close to each other (less than half the wavelength), they experience a tiny delay if the signal arrives with an angle. From this delay, the AOA can be derived. If three of these antennas are placed in a triangle, a measuring device is created that can derive a 3-D angle. Elaborate systems even use a big grid containing small antennas, so the AOA is measured on a whole surface. All these measurements can be combined to perform triangulation and trace the source its position with only one device. This is for example used in modern radar equipment.
F. Other localization techniques
Besides triangulation, there are some other techniques worth mentioning. One is already mentioned briefly in section III-B:
can be estimated based on the last known direction and speed. This method is called Dead Reckoning (DR) and the accuracy can be improved within the node itself, using sensed data of movement [10, 15, 22–24]. The accuracy of this method decreases with time because new positions are estimated entirely based on earlier ones.
A more advanced version that combines DR with other data is Map Matching(MM). This method is about using sensed data of movement (like performed in [24]) and collecting fingerprints as mentioned in section III-E (Scene Analysis, SA), or more explicitly: detecting beacons like a gateway or tag. The authors of [17] for example used ZigBee nodes as beacons. Using the theory of pattern recognition [25], all this data is evaluated using a pre-composed map in order to find a spot that matches the data as accurate as possible. Another example: the sensing of a bump can be accurately matched to a doorstep on the map. “MM techniques include topological analyses, pattern recognition, or advanced techniques such as hierarchical fuzzy inference algorithms.” [10] The method can be very complex.
Each technique has its advantages and disadvantages. To use the benefit of multiple techniques, combinations or hybrid techniques have much potential. An overview of all the techniques and possible hybrids is given in [15].
IV. LOCALIZATION COMPOSITION
As mentioned in section III, localization can be achieved using the direction (angle), signal strength or time of flight of a signal. This chapter looks into the subject of localization from the perspective of architecture, topology and methodology.
A. Localization architecture
Looking at the architecture, we distinguish between dy-namic and static assets. The facilities and transporting network are typically static, while RTI’s and transport means are typically dynamic. Nodes can be fixed, like beacons that are constructed at fixed locations in a warehouse. If nodes are mobile but their location is known, they function as anchor: other nodes can determine their position based on the anchor nodes [10, 15, 26].
It is also possible that the transport mean, for example a truck, is equipped with a node that has GPS information. In this case the node functions also as an anchor node. Of course, the accuracy of GPS is limited so using the truck its node for reference is a totally different approach than the indoor beacon localization. However, the infrastructure is basically the same.
B. Localization topology
[image:10.612.314.562.54.158.2]This section looks at different setups where different ways of localization can be realised. Every method requires a node to interact with its surroundings in order to gather information about its position. Though radio techniques are of most interest, some other communication techniques are mentioned briefly to create a bigger overview. Also, estimated power consumption for the node in each type of architecture and some conclusions are mentioned briefly.
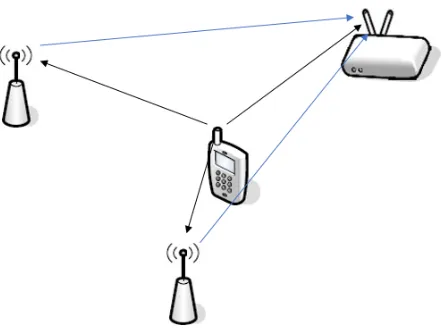
Figure 4.6: Remote positioning (a) and self-positioning (b)
Transfer a signal
The infrastructure from figure 4.6a demands the node to transmit a signal, but it can be very short. The beacons collect this signal and the Central System (CS) contains the Positioning Engine, where the position is calculated. This topology is calledremote positioning[11].
This technique can be applied in reversed direction as shown in figure 4.6b: when several antennas (e.g. beacons) send a signal towards the node that needs to be traced, it can calculate its position with respect to the sources. This topology is called
self-positioning: the node functions as its own Positioning Engine. This method demands the node to be receiving radio waves, which consumes less power than transmitting but might require the node to be actively receiving a longer amount of time. If the beacons send an advertisement every second, the node expects that it will have to be receiving half a second before it catches it. Of course, if it knows the pattern of which beacons are transmitting, it can anticipate on when to start receiving. To synchronize the time would create the opportunity to make this method more efficient, but is also another challenge in itself.
With self-positioning, the node can share its position with the CS. This topology is calledindirect remote positioning. If the position is sent from a remote positioning side to a mobile unit, this case is calledindirect self-positioning.
Since the CS in most cases knows how to interpret the mea-surement results better than the node, indirect self-positioning makes more sense. The CS can translate the results for example in symbolic locations like whether the RTI is at a sorting spot or stock.
Note that the RTOF technique for localization is a remote positioning method that requires the node to both receive and transmit.
Collecting reflections
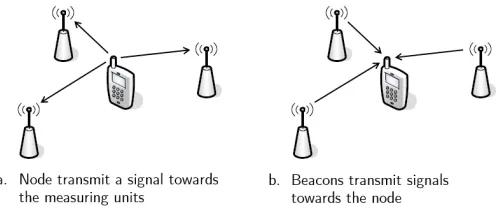
Figure 4.7: Two ways to collect reflections for positioning
Figure 4.8: Share relative positions through collaboration
radio signals providing both identification and localization. It is also impractical for indoor localization because all the reflections cannot be distinguished.
The same technique as just mentioned can also be accom-plished in the reversed direction, like when the node measures the distance to the walls using radiometric, optic or acoustic pulses. This is for example used in robot vacuum cleaners. Information can be gathered about how close the node is to a wall or an object, but not which wall or object (identification).
Collaboration
The above mentioned methods all are beacon based: collect-ing the location of a node with respect to (static) beacons or anchors with known locations. The computation are carried out in acentralizedmanner: by the CS. In the absence of a CS, nodes can compute their spacing and gain information about their neighbours. The result is a collaborative, decentralized
method to find relevant information like whether RTIs are positioned among RTIs with the same destination and no stocking conditions are violated. This method is displayed by nodes C, D and E from figure 4.8.
Collaborative positioning requires to be regularly updated and is likely to consume more power. In order to save power, the computations can be distributed to minimize communi-cation. This requires the nodes to have some more elaborate intelligence, which is more complex and expensive than indi-vidual nodes in a centralized system [15]. An application is also shown in figure 4.8: node A knows its absolute position using the beacons and functions as an anchor node for its neighbours, whether they are within reach of the same beacons or not. The advantage is that only one node needs to be traced (node A) in order to derive the proximity of all its neighbours (node B).
So far, all methods require a form of interaction between the node and surrounding beacons. There is however another asset
that can take over some tasks: equipment like the materials handling. One can think of a forklift or a barcode scanner that performs the positioning (with for example including a view direction and the height that it placed the pallet based on its lifting height) and shares this information with the node and CS. This will minimize the power consumption of the node. This technique will be referred to as theoutsourcing technique
because the node outsources its interaction and computations to the materials handling.
The outsourcing technique can be used additional, substi-tutional or partially substisubsti-tutional to the regular technique. A good example is when the CS performs 2-D positioning using the AOA technique. If the forklift is traced and its view direction is known and it shares the height on which it places an RTI, the third dimension is added to the system. It is in this case possible that the forklift maintains the connection with the node so it becomes the gateway of the CS.
C. Localization methodology
We have looked into the architecture, how the components can interact and which component can act as Positioning Engine. Section III-D introduced the properties of waves that enable localization, and has shown the advantages of using radio waves. This section looks at the possibilities to apply localization, identification and communication from the perspective of the transportation process and Business Rules (BRs) within a warehouse (see chapter II). In other words: which methods have most potential for being applied to perform positioning RTIs in a warehouse?
Some first conclusions are drawn before the next chapter elaborates more on the demands and limitations of the pre-ferred positioning techniques.
Each type of infrastructure has up- and downsides. Of course combinations of different methods are also possible, for example applying the collaboration technique when no bea-cons are nearby. Because the technique of collecting reflections has big limitations, that type of infrastructure is neglected.
One must also take into account that multiple nodes can conflict. With the remote positioning method, a protocol is needed to avoid collisions. If hundreds or thousands of nodes happen to advertise at more or less the same time, their mes-sages will collide and information will be corrupted. However, when the nodes are receiving instead of transmitting, one setup of beacons can serve basically an unlimited amount of nodes at once. As mentioned before, this might have a bigger impact on the power consumption on the nodes or request accurate time synchronization
[image:11.612.81.259.190.278.2]message can contain information about neighbours or beacons and their relative distance to the node.
The outsourcing technique seems to cope with many diffi-culties, especially given that it has practically unlimited battery supply. It leads to new questions like how extensive this system should become and whether it is possible to apply it only in the forklift or also in other materials handling or manual scanners. Should it attribute to the positioning system or completely take over several tasks?
A safe conclusion will be that every feasible method re-quires the RTI to be embedded with a system that can function independently. The addition of beacons and a CS and perhaps “smart forklifts” can attribute to this; the next chapter goes into more detail.
V. INTEGRATION
Now the localization methods have been introduced, it is time to discuss which method is most suitable for the integration with smart pallets.
First thing to notice is that the circumstances in which these pallets end up, are changing all the time. They find themselves in a container, at harbours, in big warehouses with lots of other pallets and possibly smart forklifts, warehouses without any integrated positioning system or they can find themselves returned empty to their supplier. The localization method and the operation mode of the embedded node depends on these circumstances.
To distinguish between circumstances, four scenarios are introduced. For each scenario, the pallet should act on a different mode and the positioning method will differ. Though these scenario’s might not be comprehensive, they cover a lot of realistic situations.
A. Localization protocols
This section introduces the scenarios and presents a concept localization protocol for the concerning scenario, for which the properties and metrics might change.
For the communicative hardware, it is assumed that each RTI has a Bluetooth transceiver. It is also assumed that it has a Near Field Communication (NFC) chip. This is not a hard requirement, but it creates several possibilities that might become useful. Furthermore, it is assumed that both the Central System (CS) and the node have knowledge about stocking conditions and the destination of the load.
Scenario 1: smart pallets and CS
Let us first consider a warehouse with CS and a protocol that enables bidirectional communication between node and CS. The CS can communicate with the employee so a connection between the node and employee is unnecessary.
The node is able to detect movement and recognise transla-tions between standing still and being transported. Both events are of interest for the CS so the node will send out a warning signal when it detects movement.
While the RTI is on the move, the CS must be able to trace its path. At suspicious behaviour, the CS can brief the em-ployee. The node does not know which path it should take and which direction it is heading, nor can it communicate with the employee. Therefore, the node is just sending advertisements every four seconds from which the CS computes its absolute position. As mentioned in section III-C, a lower accuracy (say <5 meter) will suffice.
When the node detects that it is put down, it will perform one accurate absolute positioning action. It will transmit a signal to the gateways so that the CS can determine its position with high accuracy (<0.8 meter). It is possible that this signal contains a message with data like the local temperature or how bumpy the RTI was transported. It is unnecessary for the node to know its absolute position, but the CS can transmit valuable information like if it is placed correctly or an error occurred.
In this scenario, the employee identifies the RTI using an optical barcode or NFC. As an addition, it should be possible for the employee to connect to the node and exchange data directly via Bluetooth, instead of via the CS. This is important for the robustness of the system, for example in case the CS is overloaded or out of reach.
Scenario 2: smart pallets without CS
This protocol when there is no CS available will be totally different. There is no case of absolute positioning so the node will only be able to perform relative positioning. Every time the node senses that it is put down somewhere, it should scan for its neighbours. If it has found one or more, they can estimate the distance based on the Received Signal Strength Indicator (RSSI) and share this information so they create a mesh network.
The nodes now form a network and are able to inform each other about relevant changes, in particular when one node appears to have a different destination from those nearby. It is even possible that the meshes form a big network of all the nodes in the warehouse, so features like flooding an important message become possible. If RTIs are placed on wrong spots, near RTIs that might be harmful or if the temperature shifts outside the safe region, the nodes will share this information over the whole network.
Scenario 3: smart forklifts
This scenario is the same as scenario 1, but with the addition of smart forklifts. The integration of an embedded system in the materials handling like a forklift, creates new opportunities for the localization protocol. The impact depends on the complexity of the system. Three options are treated, ordered in complexity from low to high. The first two are denoted as option 1a and 1b, because the localization methodology are the same as will be explained later on.
Option 1a: the forklift merely sampling heights. This sce-nario is a warehouse with a CS and a forklift which contains a Bluetooth node. This node has only one task: measuring the altitude of the fork and transmitting it to the CS.
The position of the forklift is traced based on its trans-missions, and combined with its identity. The altitude of the forklift its load is corresponded with the RTI that it carries, based on their position. The altitude at the moment when it is dropped, is added as the third dimension for the RTI. This is all performed by the CS.
If any error occurs like when the RTI is brought to the wrong place, it is immediately reported to the employee. There could be a small delay because the exact position of an RTI still needs to be determined after the employee put it down.
Option 1b: the forklift with integrated system. In the pre-cious example, there is still an employee needed with a device that can scan the RTI and retrieve instructions from the CS. In this example, the device is integrated with the forklift (or Automated Guided Vehicle, AGV).
When an RTI is loaded upon the forklift, its NFC chip is scanned to identify the RTI. The forklift retrieves information about the destination of the RTI from the CS. Instructions appear to the driver or get processed by the AGV. The position of the RTI is traced using the fast, 2-D positioning from scenario 1. The altitude of the RTI at the moment when it is dropped, is gained from the forklift before it is added as the third dimension.
If any error occurs like when the RTI is brought to the wrong place, it is immediately reported to the employee.
Option 2: forklift as a gateway and taking over the local-ization. The next scenario is a warehouse with and a forklift (or AGV) which contains equipment to perform localization and acts as the gateway with the RTIs. There are no other gateways mounted on the ceiling or elsewhere. The forklift is now considered the CS, keeping a connection with the local database via WiFi.
When an RTI is loaded upon the forklift, its NFC chip is scanned to identify the RTI. A short connection using NFC is performed to establish a Bluetooth connection between the RTI and the forklift. The employee or AGV immediately retrieves instructions about the pallet. Continuous-time, accurate 2-D tracking of the forklift is performed and the altitude on which the RTI is placed on a rack, is included as the third dimension. Note that it might be useful to derive the view direction of the forklift to transpose its position into that of the RTI. It is possible to equip the forklift with a directional antenna to detect beacons and their position compared to the forklift.
The feature of having a mobile gateway like this creates a mobile reference point for the positioning of the pallets. The
localization error of the relative position of the RTI compared to the forklift will be small, but the error of the absolute position of the forklift will be determinative.
Because the forklift or AGV takes care of al the positioning, the RTI’s node is appointed not to. After the forklift has dropped the RTI at the right spot, the RTI is informed about its symbolic position and its new schedule and the connection is aborted.
One can imagine that this procedure is also applicable with passive RTIs using optical barcodes. A warehouse that integrated this system can use both types of RTIs together and reach the same efficiency as the system with smart pallets.
Scenario 4: in stock or shipment without CS
Consider scenario 2 again. When there is no CS available and RTIs are placed in stock, their composition will probably not change often. The nodes can derive this by logging the changes and perhaps even by deriving that they are placed vertically from each other (they shared RSSI information of their peers). In this case, the nodes save power by maintaining their mesh network connection using a smaller duty cycle (less signals per hour).
The same happens when RTIs are placed in a container for long distance transportation, disconnected from any CS. The ship, truck or train can be localized using GPS, but there is no use of tracking or communicating with the individual RTI. Similar as in the stock, the nodes will automatically generate a mesh network with their neighbours and save their energy by decreasing the duty cycle.
In contrast to when it is in stock, the node senses transporta-tion using its accelerometer when it is being shipped. Based on the characteristics of displacement, the mesh network between nodes and maybe even the reflections of the environment (a metal intermodal container functions as a cage of Faraday), the node distinguishes between stock and shipment. The node acts different in both occasions. In the case of a stock, there is no use of scanning for the availability of a CS. When the node knows it has been shipped, this is different. When the node senses that it is being unloaded from a truck or ship, it will start scanning and advertising and further follow the procedure of scenario 2 or 1.
Based on the schedule of the RTI, there is also the possi-bility for the node to go completely off-line. This is the case when an RTI is in stock or in shipment and it has no tasks like sensing or logging. Especially when the RTI is returned to the originating facility, empty and without schedule, the node can go into sleep until further notice.
B. Localization methods
Considering the protocols from section V-A, there are differ-ent localization methods and techniques of interest. Scenario 2 and 4 only have the collaboration method at their disposal. The methods to use for scenario 1 and 3 are more complicated. They are divided as followed:
Fast positioning: tracing a pallet fast, reducing accuracy and power consumption of the node. 2-D positioning is sufficient.
Accurate positioning: accurately derive the position of a target, consuming more time and power from the node. 3-D positioning is required.
Smart forklift integration: the forklift or AGV is responsible for determining the altitude of the RTI (option 1 and 2) and possibly the whole positioning procedure (option 2). In the case of option 1: fast positioning is still required undiminished, accurate positioning is still required for 2-D. In the case of option 2: fast positioning has become redundant, accurate positioning is performed by the forklift instead of the RTI. Considering communication: with option 2, the gateways on the static environment have become unnecessary.
C. Localization techniques
Since the fast positioning and accurate positioning methods have to be developed for the system to function, an applicable technique has to be selected. The collaboration method is disregarded for now. The system must be functioning without the smart forklifts so the elaboration on that addition can be postponed. This section gives an overview of usable techniques and concludes with a suggested technique for both methods. It reflects on the techniques as introduced in section III-E and III-F.
The Bluetooth connectivity protocol is suggested to use for the application. Bluetooth 4.0 LE (Low Energy) and later versions are optimized for the purpose of transferring data and creating a point-to-point, mesh or star network. The range is up to 100 meter, which is suitable for indoor, and devices can be localized with an accuracy of up to 0.4 meter [27] using RSS.
It might be considerable to use TDOF or AOA localization techniques, or a hybrid system of those, in order to gain a higher reliability. Those techniques have other up- and downsides. The following overview is explained in more detail in [15].
RSS localization is a cheap and easy technique to apply. It is however not the most accurate and easily affected by obstacles and multipath components. The authors of [28] performed indoor BLE RSSI positioning in four stages. The stages include modelling RSSI values, decreasing the sampling errors by smoothing the received RSSI, positioning using a cooperative localization method and finally, adjusting the model based on results. These adjustments are very important in a warehouse where the circumstances change by the minute. Scene Analysis (SA) can partially solve the inaccuracies: the node’s RSS values of its neighbours can be shared to obtain a fingerprint of the node its surroundings. It is possible
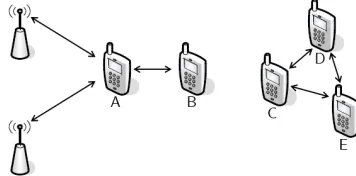
that these are indeed its neighbouring nodes, like the mesh network as elaborated in scenario 2 which requires a lot more power consumption, but they can also be beacons. If large amounts of those are installed close to the ground, emitting an advertisement every second with the same power, the node can collect those with their RSS value and create a fingerprint. An illustration of this method is given in figure 5.9. The advertisements can also contain information like its symbolic location.
TDOA does not require time synchronization between trans-mitters and receivers, but only between the receivers. This requires expensive equipment, especially for large deployment. It is however robust against multipath and NLOS (No Line of Sight) and provides centimeter level accuracy.
AOA can achieve similar accuracy and is also robust against multipath. It is however infected by NLOS conditions and requires special equipment.
The authors of [29] introduce a hybrid of TOA and AOA, which is robust against NLOS and multipath. It is however way more complex than TDOA only and not suitable for our case.
Another possibility is to use acoustic waves. The TOF can very easily be measured compared to a radio wave, so the distance can be derived. Some downsides are: it requires new equipment, it is slower so the chance on collisions increases and there is no optimal frequency. Low frequencies are audible and might disturb people. They also need bigger sound boxes and more power. High frequencies or ultrasound waves do not diffract very well and get absorbed easily when they penetrate objects. LOS is required or only reflections are caught by the measurement device, giving a false indication of the distance.
As for the forklift integration, the technique will differ as follows. In case of option 1, the localization technique will be exactly the same. The sampling of the height that is performed by the forklift, will be added to the system. It can be used complementary to the 3-D positioning technique, or added as the third dimension to the 2-D positioning technique. In case of option 2, the forklift becomes the mobile target that has to position itself. As mentioned in section IV-C, it leads to several new opportunities, applications and questions on how to implement it. It would be too extensive to treat that subject full-fledged in this paper. In short, the fast positioning technique is cancelled because the static gateways are left out. The forklift has enough battery capacity to perform Scene Analysis and perhaps new techniques like Dead Reckoning constantly. It can position an RTI based on its own position and view direction and the height on which it places the RTI.
Figure 5.9: Accurate positioning using Scene Analysis
Conclusion
The TDOA might perform best for the implementation of accurate positioning because it is the most accurate technique and robust against NLOS and multipath propagation. It how-ever requires very special equipment and very precise time synchronization. The complexity of this system might be a stimulant to implement a more simple and possibly cheaper one. In this case, it is proposed to use two separate techniques for the fast and the accurate positioning methods.
The Scene Analysis method has a lot of potential for
accurate positioning. Beacons can provide high accuracy and gateways can collect fingerprints from the nodes. This technique might be more feasible than TDOA. An illustration of what is meant with the SA method is displayed in figure 5.9: the mobile device measures the RSS of three beacons and transmits the measurement towards the gateway.
For thefast positioningmethod, this technique is not useful: the composition changes while the node is measuring for beacons nearby. Positioning the target with gateways using the RSS might reach sufficient accuracy. It remains unclear how accurate this will become since the ceiling can be very high. The accuracy decreases exponentially with the height of the measurement antennas, and is severely influenced by NLOS. The angulation method could perform better, but at least be easily implemented in addition to the lateration method. If two or more gateways are able to determine the RSS and AOA from a mobile target, the position can possibly be determined with a high accuracy, consuming little time and energy.
If this works as suggested, it is a system that fully complies with scenario 1.
VI. RESEARCH SCOPE
The positioning system as described before, would be a very interesting methodology to implement and perform a research about. It contains the accurate positioning using fingerprints (Scene Analysis), the fast and low-energy positioning using RSS, the addition of AOA information to improve the fast localization and possibly the addition of smart forklifts.
The third subject of this enumeration – the addition of AOA information – especially gained attention. This section explains why and what the scope of this particular research will be.
A. AOA: added value
The use of SA and lateration using the RSS is a widely used technique. The addition of deriving the AOA to improve the localization accuracy is however not very widely known. The information about the AOA is therefore often disregarded, which would be a waste if this information can improve the accuracy significantly and is worth the cost in special equipment and implementation effort.
This specific element is therefore subject in the further research of this paper. Knowing the technologies to derive the AOA, how to use it, how accurate it is and how this accuracy is influenced by the environment forms a piece of the localization technique and methodology that can be applied in the protocols that have been introduced before. It can be used in addition to the lateration technique, implemented in gateways spread over the ceiling, build onto possible smart forklifts or it can be used for numerous other localization purposes.
The rest of this paper restricts to the subject of deriving the AOA, leaving the implementation of it to future study. The research questions will be as follows:
What are possible current known technologies to determine the Angle Of Arrival from a radio signal? Which technique has the most potential to be applied in the positioning of pallets in warehouses? How accurate is this technique in determining the Angle Of Arrival, what are the sources of inaccuracy and how big is their influence?
With “current known technologies”, also the current used hardware is meant: no hardware is designed or altered for this research. The “radio signal” has later in this paper come down to specifically Bluetooth Low Energy (BLE) signalling only, leaving other radio communication means disregarded.
The first two questions are treated in the next subsection and come to a research about the third question in the following section.
B. Current Angle Of Arrival Systems
There are typically two types of equipment to determine the AOA: array antennas and switched-beam antennas [11, 15].
Figure 6.10: PCB and antenna layout
are multiple estimation methods to accomplish this. Some of them are: Estimation of Signal Parameters via Rota-tional Invariance Techniques (ESPRIT) [31], Multiple Signal Classification (MUSIC) [32], Conjugate Augmented MUSIC (CAM) [33] and Time-Reversal MUSIC (TR-MUSIC) [34]. A Multiple Antenna System (MAS) like this is difficult to apply on a large scale network of nodes because there is a substantial hardware requirement of these schemes [35]. It is easier to apply on anchor nodes which than can feed back their measured AOA to the mobile nodes [36]. It is also possible to derive the Angle Of Departure from a MAS anchor node: the authors of [35] introduced a distributed angle estimation using a two-antenna anchor. By emitting two linear chirp waves with slight frequency difference, an interference field is produced. The RSSI of these signals is captured by sensors to estimate the AOD and so derive its relative location.
Switched-beam antenna systems are less complex: they make use of directional antennas and correspond the RSS with a certain direction to determine the AOA. It can for example be a rotating dish antenna that collects samples from all directions. Another directional antenna like a Yagi antenna can be used, and it can be multiple fixed antennas instead of one rotating antenna. The authors of [37] performed this principle with a directional anchor antenna on the ceiling to enable indoor 2D target positioning by sensor nodes. The authors of [38] obtained the AOA by measuring the RSS of a rotating anchor node [39].
[image:16.612.51.301.57.209.2]The switched-beam antenna does not need complex es-timation methods and can be very simple to manufacture. A good example is the one displayed in figure 6.10. Eight Yagi antennas are mounted on fixed positions on this Printed Circuit Board (PCB). They can individually be controlled by a source or, as in this case, have NRF52832 Bluetooth modules mounted to them. These chips can individually be programmed to transmit signals or measure the strength of received Blue-tooth signals of their own direction. This particular model has a lot of potential to perform angulation and can be manufactured for large scale use. It has however not been extensively tested before, so the next chapter will gain new insight on how this device can be used to derive the AOA.
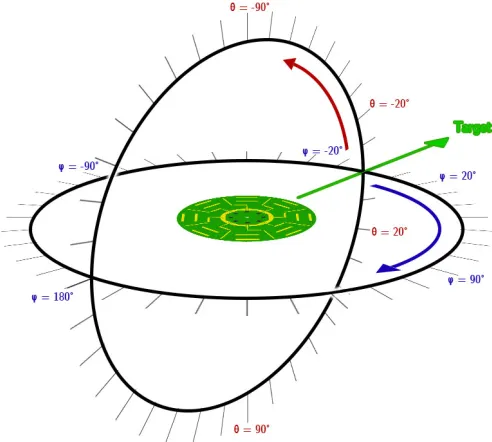
Figure 7.11: Orientation of the PCB compared to the target
VII. RESEARCH:SWITCHED-BEAM SYSTEM TEST
The printed circuit board displayed in figure 6.10 contains eight directional antennas, placed in directions that are 45◦ apart. In this paper it will be referred to asthe PCB(Printed Circuit Board). Depending on the distribution of measured values from these antennas, the PCB can perform angulation to recover the direction of the target to be localized. How to do this, is the main question of this research. The behaviour of the antennas in all directions must be evaluated in order to find sources of inaccuracy and how big their influence is on determining the AOA.
Several test have been performed. A big part of this was inside an anechoic chamber, to find the sources of inaccuracy on the smallest scale without reflections influencing the behaviour. This gave a shape of the transmission of one antenna and three models of how the composition of antennas receives the signal from a target on different altitudes. A converter is build to convert one measurement into an estimated AOA. This system is then evaluated and multiple sources of inaccuracy get uncovered. Finally, the effects of polarization and reflections in a realistic indoor environment are shown to decrease the accuracy of the system so much that the models from the anechoic chamber are inadequate.
Each antenna has its own MAC-address. For convenience they are named “antenna 1” up to “antenna 8”, clockwise, where antenna 1 is the reference point. In other words: antenna 1 is located at0◦, antenna 2 is located at45◦ and so forth, as displayed in figure 6.10.
vertical tilt. Figure 7.11 shows how this is organized.θ= 0◦/ φ= 0◦ means that the PCB faces the target with the primary antenna. The φ-angle and θ-angle represent the rotation of the PCB from this point. If φ increases, the PCB is rotated clockwise. If θ increases, the PCB tilts over so the target is orientated towards the top of the PCB. θ goes from−90◦ to 90◦ (where the target is located perpendicular to the bottom and top of the PCB, respectively), whileφ goes around from
−179◦ to180◦.
Depending on the orientation of the PCB, a different signal strength is expected at each antenna. Based on the distribution of these values, the direction of the target can be determined. Logically, the antenna that is directed most closely to the target is expected to gain the highest Received Signal Strength.
This description gives the impression that the PCB is the measuring device, receiving the signal from the target as a source. In practice, this measurement can be performed in both directions: the PCB can emit the signal and the target can measure the signal strength of these eight transmissions.
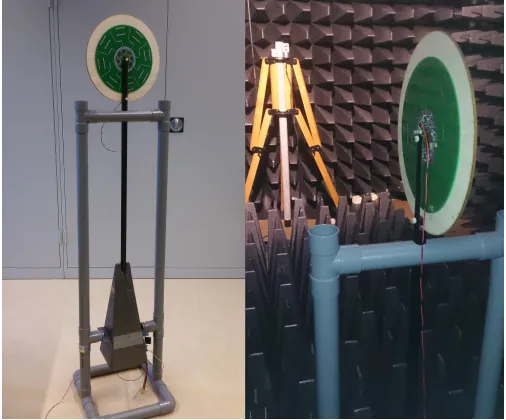
Test setup
The PCB is tested in an anechoic chamber, on a setup as displayed in figure 7.12. The PCB is connected to a PVC rod, together with a compass card that is laser cut from a triplex board. The PCB can be rotated and the compass can be used to determine itsφ-rotation, accurate within less than a degree. The rod is hold at place with PVC tubes, and connected to a stepper motor that can make steps of 1.8◦ (200 steps in a full rotation). This is theθ-rotation.
Notice that the test setup in figure 7.12 is not oriented straight. Turning the picture clockwise a quarter shows how the data should be interpreted: with the right wall being the downside.
The PVC of the stand has a very small influence on the radio propagation, which is neglected for this research. The stepper motor has a bigger influence on the radio propagation, but this is minimized by placing it one meter from the PCB and adding the Styrofoam peak that covers it.
The target is a USB dongle. It is taped to a wooden stand and connected via a cable to a computer outside the room.
All the tests are conducted with a constant distance of 240 cm between the dongle and the center of the PCB.
A. Test 1: PCB / Dongle measurements
[image:17.612.311.564.56.266.2]The first test shows the difference between the measurements performed by the PCB (collecting signals from the dongle) and those performed by the dongle (collecting signals from the PCB). The PCB is placed at φ= 22.5◦, a test is performed to collect around 250 samples, the PCB is rotated 45◦, and the same test is performed until all eight antennas have covered all eight positions (with θ = 0◦). Each antenna now delivered an average and a standard deviation of around 250 RSSIs (Received Signal Strength Indicator). The average of these eight averages is calculated and displayed in figure 7.13. Also the average of standard deviations is displayed in the graph as the error
Figure 7.12: Test setup
bar. Note that these standard deviations are not the same as how far the averages of the eight antennas are actually apart.
From the results can be seen that the results are very similar, but have an offset of approximately 5dB. Because for the calculation of the AOA (Angle of Arrival) only the distribution of the RSS over the eight antennas is relevant, the absolute RSS value and offset of the graph is irrelevant. Both graphs lead to a peak atφ= 0◦.
From now on, for the ease of the conduction of the tests, only the dongle is used to perform measurements.
Furthermore, the graph does not show that the antennas are quite similar aboveφ=−22.5 but differ a lot at φ=−67.5 and φ = 112.5. Figure 7.15 will confirm that the antennas give very different results aroundφ=−90◦. This is likely to be caused by small differences in the hardware.
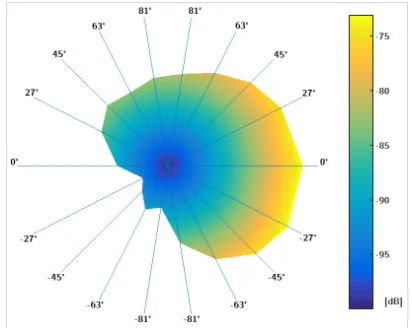
B. Test 2: elaborate 360◦ rotation measurements
The graphs from figure 7.15 show two different perspectives of the PCB.
[image:17.612.314.564.566.714.2]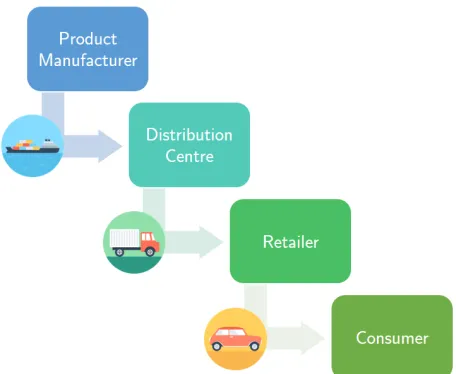
![Figure 3.3: Four measuring methods for triangulation, obtainedfrom [16]](https://thumb-us.123doks.com/thumbv2/123dok_us/9681767.469758/7.612.312.564.54.222/figure-measuring-methods-triangulation-obtainedfrom.webp)