Munich Personal RePEc Archive
Keep Calm and Carry On: Gender
differences in Endurance
Della Giusta, Marina and Clot, Sophie and Di Girolamo,
Amalia
2019
Online at
https://mpra.ub.uni-muenchen.de/91482/
Keep Calm and Carry On: Gender differences in Endurance Sophie Clot* Marina Della Giusta* Amalia Di Girolamo**
7 March 2018
Abstract
We investigate endurance, the capacity to maintain levels of performance through internal rather than external motivation in non-rewarding tasks and over sequences of tasks, though a lab experiment. The significant driver of performance is payment scheme order for women and payment schemes for men. Both women and men respond to social cues, through increased intrinsic motivation (ambition) for women and through extrinsic motivation (competition) for men. We suggest implications for reward schemes in the workplace and for selection into executive positions.
JEL codes: J16, J71, M12, M51
Keywords: gender, intrinsic motivation, endurance, monetary incentives, biased beliefs
*Department of Economics, University of Reading, Whiteknights, Reading RG6 6AH, United Kingdom.
**Department of Economics, University of Birmingham, Edgbaston, Birmingham B15 2TT, United Kingdom.
Acknowledgements: we thank Julie Nelson, participants in seminars at Collegio Carlo
Introduction
In a bid to understand how to achieve equality in the workplace (Bohnet, 2016), a wealth of studies are seeking to ascertain the extent to which observed gaps are a result of a patriarchal division of labour that assigns women to less rewarded tasks and the way in which this combines with gender differences in stated or revealed preferences (which of course are formed within the same system). A large body of experimental and survey literature documents gender differences in preferences for competitiveness, risk, and altruism (Eckel and Grossman, 1998 and 2008; Gneezy et al, 2003; Niederle and Vesterlund, 2007 and 2011; Croson and Gneezy, 2008; Apicella et al., 2015), and has been variously linked to gender gaps in education (Buser et al. 2014; Niederle, 2010), occupational choices (Bertrand et al., 2010; Goldin, 2014; Bandiera et al. 2016), and gender gaps in pay and career (Babcock et al. 2017a and b; Reuben et al. 2015).
links between competitiveness and other behavioural traits, and this is indeed the first objective of our paper.
We contribute to this body of literature by focussing on the ability to maintain performance in non-rewarding tasks, focusing on a characteristic that has not to our knowledge been explicitly incorporated in the experimental literature on gender differences. We call this endurance, or the capacity to maintain levels of performance through internal rather than external motivation, and speculate that this feature is strongly associated with culturally and party self-enforced expectations of female behaviour (Coffman, 2014; Bordalo et al., 2016) The literature on gender norms suggests that women on average are expected to be conscientious and compliant (Carter, 2014; Eswaran, 2014) and the evidence on the distribution of personality traits suggest that on responses to the Big Five Inventory, women report on average higher levels of neuroticism, extraversion, agreeableness, and conscientiousness than men across most nations (Schmit et al., 2008; Costa et al., 2001). Men on average perceive their general intellect as higher and they tend to overestimate it, whilst women on average tend to do the opposite (Karwowski et al., 2013)1. Women also tend to state more than men that social objectives are more important than the goals connected with achievements (Kuhn and Villeval, 2015; Piirto, 1991). All this may fuel stereotyping by principals and by agents themselves (as found in Babcock et al., 2017) and lead to such tasks being disproportionately allocated to women, under the distorted belief that they will be better at them, whether in the workplace or the household, thereby also creating self-fulfilling dynamics of discrimination. The process has been discussed in models of belief formation by Gennaioli and Schleifer (2010) who show that significant biases in beliefs can arise from the use of representativeness heuristics (Kahnemann and Tversky, 1983) which lead to exaggerating small differences in some parts of the distribution of attributes of one group relative to another. In particular, Oxoby (2014) shows how the process of forming beliefs
about one’s own ability incorporating irrelevant information on observable types can bias
downward one’s perception of one’s own ability (or upward if the type-based biases are positive), and lead to inefficient allocations of agents across more and less skilled sectors in the labour market and a growing segregation over time through the feedback to agents from increased type-based biases in their beliefs. A first objective of the paper is to see whether there are indications that significant differences in average endurance may be spontaneously
1 Parents also perceive their sons’ intelligence to be higher than their daughters’, while children perceive the
arising in the context of an experiment simulating a situation in which random sequences of tasks associated with different rewards are presented to agents who have to choose the level of effort to dedicate to the task, given the reward mechanism. Our second objective is to show how the particular order of sequences of both rewarding (competitive and not competitive) and non-rewarding tasks affects endurance, to see whether being assigned to non-rewarding tasks hurts subsequent performance in rewarding ones, and whether there are any differences in average responses by women and men to sequences of tasks, as well as the social effects from performing the task in mixed or single sex environments. The third objective is to discuss the significance of these gender differences for policy on the basis of size effects and not just differences in averages, in order to distinguish between those that can fuel biased beliefs (and inefficient allocations) and those that can guide positive selection. We design an experiment to measure endurance in two ways: through evidence of sustained performance in a repetitive task in the absence of external rewards, and in continued performance across sequences of tasks. We also use information from a post experimental survey to corroborate our results.
2. Experimental procedure
The reward schemes are as follows: a fixed rate of £3, a rate of £0.05 for each ball successfully moved from one container to the other, or a tournament against the other participants in the group in which only the winner is paid a sum of £0.10 for each ball successfully moved. 237 participants took part in our experiment at the University of Birmingham lab in May and June 2016. We also conducted a post experimental survey asking attitudinal questions on political views, altruism, risk, trust and the importance of money (see appendices for instructions and survey), which we use in our discussion of the experimental data.
2. Results
Below we present a comparative analysis of tasks performance across treatments (payment schemes), before studying the differentiated impact of the environment (mixed vs. unmixed groups) and the sequence of the games on performance.
1. Gender difference in performance under different payment schemes.
Figure 1 shows contrasting effects of payment schemes on gender. Consider first the payment
scheme’s impact on women’s performance. Women’s average score decreases by only 0.84 points (-1.8%) in the fixed rate scheme compared to the piece rate scheme. A Mann-Whitney pairwise test indicates that the difference is not significant (p-value2=0.4009), meaning that women, on average, keep on performing even with no financial incentives at stake. Women slightly increase their performance in the tournament scheme by 0.91 points (+1.96%) compared to the piece rate scheme, but again the difference is not significant (p-value=0.4688). Overall, women do not seem to react strongly in terms of effort to the different payment schemes. Oppositely, men’s performance across the three treatments indicates a significant response to the payment schemes, though the size effects are quite small. Men increase their performance by 2 points (+4.05%) in the tournament compared to the piece rate scheme (p-value =0.0822, Cohen’s d3=-0.19). In the fix rate scheme, men
2
We use the two-sided Mann-Whitney U test to compare the performance of women and men across treatments and investigate gender differences within treatments, in all test reported in this paper unless specified otherwise.
decrease their performance by 1.96 points (-3.94%) compared to the piece rate scheme (p-value =0.1384.) and by 3.96 points (-7.7%) compared to the tournament scheme (p-(p-value =0.0023, Cohen’s d =-0.38).
The econometric analysis reported in Table 2 provides more formal support to these results. Table 2 is made of 3 panels. The first panel displays the results of a hierarchical Tobit regression4 in which the dependant variable is individual performance measured through the consecutive scores obtained in the 3 games played in the experiment. The second and third panel displays similar regressions but respectively restricted to the men and women samples. Model 1 shows the contrasting effect of the two distinctive payment schemes on individual
performance. Players’ performance is predicted to increase by 1.310 units under the
tournament scheme treatment compared with the piece rate scheme treatment. This
coefficient is significant at the 0.05 level. Oppositely, players’ performance is predicted to
decrease by 1.350 units (the coefficient is significant at the 0.05 level) under the fix rate scheme treatment. To check for robustness, model 2 includes additional socio-demographics and behavioural variables. Both coefficients remain significant at the 0.05 level in Model 2. Model 3 and 4 proceed to the same hierarchical regression but for the men sample only. Results found in model 1 and 2 are repeated. Also, coefficients are slightly higher. Men’s performance is predicted to increase by 1.995 units under the tournament scheme treatment (significant at the 0.05 level) while their performance is predicted to decrease by 1.945 units (significant at the 0.05 level) under the fix rate scheme treatment. The same regressions run on the women sample only (Model 5 and 6) show no significant impact of payment scheme treatments on their performance. Altogether, the econometric analysis confirms earlier findings, which are summarized in the following result:
RESULT 1. (a) The tournament scheme has a positive impact on men’s performance, but no impact on women’s performance. (b) The fix rate scheme has a negative impact on men’s performance, but no impact on women’s performance. Altogether, this means
that women are on average more likely than men to internalize the effect of their effort.
and across-group overlap. See Nelson (2015) for a full discussion of the methodological issues surrounding the assessment of sample difference in economics and most particularly its impact on the gender literature.
4 We selected a Tobit model, also called ‘censored regression model’, which is particularly appropriate to
Figure 1 : Mean of games’ scores by gender (with 95% confidence intervals for the means)
2. Group composition (Mixed vs. Unmixed) and performance
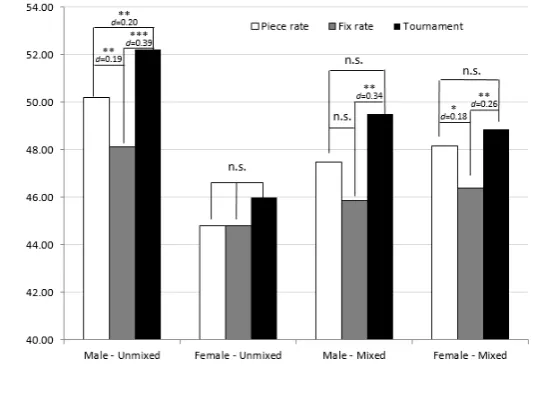
Figure 2 illustrates individual performance across the 3 payment schemes by gender and group composition. The most noticeable outcome emerging from this figure is the cancellation of the gender effect on performance in the mixed environment. Women’s performance is boosted in the mixed treatment, under the three payments schemes. For
instance, in the piece rate scheme, women’s score increases by 3.26 points in the mixed
treatment compared to the unmixed treatment, while score increases by 1.57 points in the fix rate scheme and 2.86 points in the tournament. Figure 3 and Figure 4 present scores’ distribution by gender for the tournament in the single sex and mixed treatments, respectively. To compare the performance of women and men across treatments, we use the two-sided Mann-Whitney U-test, which compares distribution, as further presented in Figure 5. In the mixed treatment, we find no significant gender difference in performance with the fix rate, the piece rate and the tournament schemes, the p-value of the two-sided Mann Whitney U test is 0.744, 0.876 and 0.604 respectively. On the contrary, there is a significant gender difference in performance in the single sex treatments, particularly in the fix rate (p-value=0.001, Cohen’s d=0.48, so a medium size effect) and the tournament (p-value=0.0006,
Cohen’s d=0.58, a medium size effect), and a little smaller in the piece rate (p-value=0.036,
the opposite happens for men. This would translate into different expected utility of effort under the different scenarios. Another important point is that it stands in sharp contrast with existing work. For instance, results from Gneezy et al. (2003) show that men performance increase in mixed environment, while the opposite happens for women. There might be various explanations for such findings. First, the cultural origin of the sample (Israel versus UK) may contribute to explain this different behavioural pattern. A study from Wiseman5 (2008) reports a high proportion of single-sex education in Israel, higher than the international average, while England stands on the international average. A second point to be highlighted is the fact that this levelling feature of the mixed environment observed in our experiment is visible in both non-competitive treatments (namely fix rate and piece rate schemes). In this regard, the contrasting effects of mixed environment on men and women performance may only be partially explained by consequential monetary rewards. Although we can not rule out the impact of mixed environment on extrinsic motivation, this may however suggest the potential influence on intrinsic motivation as well. Those findings deserve further research and discussions remains speculative, but they suggest that the spillovers associated to group composition may go beyond what is usually assumed. Model 1
to 4 provides additional support for those findings. For instance, model 2 shows that Men’s
performance increase by 3.2 units in a single sex environment (significant at the 0.10 level).
[image:9.595.159.428.531.729.2]In parallel, model 2 reports a negative coefficient for women’s performance in single sex environment, although the coefficient is not significant.
Figure 2: Mean of games scores by gender and group composition
RESULT 2. (a) Women perform better in the mixed treatment, but men perform better in the single sex treatment. (b) The contrasting impact of group composition on men and women performance holds in the absence of external incentives.
Figure 3: Score Distribution in the tournament scheme among Mixed versus Unmixed groups (Men sample)
Figure 4 : Score Distribution in the tournament scheme among Mixed versus Unmixed groups (Women sample)
0 2 4 6 8 10
P
e
rc
e
n
t
20 30 40 50 60 70
0 10 80
score
Unmixed Mixed 0
5 10 15
P
e
rc
e
n
t
20 40 60 80
0 10 30 50 70
score
[image:10.595.131.467.503.752.2]Figure 5: Mean of scores by gender and group composition with statistical significance (Mann-Whitney test)
3. The impact of payment scheme order on performance
Interesting findings arise when looking at payment scheme order effect (table 1). To start with, women score better when the game played at the start is not based on performance. Best scores for round 1 are obtained under the fix rate scheme. Their score is 46.93 in the fix rate scheme, compared to 43.48 in the piece rate scheme, though the size effect is quite small (p-value= 0.1269, Cohen’s d=0.30). We observe the opposite for men. More specifically, men start better with the tournament scheme, scoring 53.53, which is significantly higher than with the piece rate (+4.27; p-value=0.0757, Cohen’s d=0.39) and especially the fix rate which also has a large size effect (+8.73, p-value=0.0010, Cohen’s d=0.83). Moreover, this score obtained when tournament is played first outperforms all other
scores across treatments and games’ orders. But at the same time, men fail to keep the
cadence and their performance decrease as the tournament treatment is played second or third. The opposite is observed for women, who increase their performance as they play, both
for the tournament scheme and the piece rate scheme. For instance, women’s performance
Oppositely, men performance in the tournament treatment decrease by 6.16% when the game is plaid third compared to when the game is played at the start of the sequence (p-value=0.0337, Cohen’s d=0.34). Overall, if men significantly outperform women in the tournament scheme when the game is played first and with a strong size effect (53.53 vs. 44.55, p-value=0.0018, Cohen’s d=0.84), the difference vanishes when the same game is played at the end of the sequence with women slightly outperforming men, although the difference is not significant (49.16 vs. 49.43, p-value=0.8655).
Model 1 and 2 highlight a payment scheme order effect, driven by the women sample as shown in model 5 and 6. This suggests the existence of a learning effect shaping women performance. The opposite effect observed for men is however absent from models 1 to 4, where the effect of payments schemes (or the response to incentive) prevails, suggesting that the response to incentive compensates a potential fatigue effect.
RESULT 3. (a) Women’s performances increase over sequences with small size effects
[image:12.595.84.519.529.729.2]b) Oppositely, men’s performances decrease over sequences with strong size effects (c) Overall, the significant driver of performance is payment scheme order for women (who do better if the first game is not based on performance), and payment schemes for men, both with strong size effects.
Table 1 – Game performance and ordering effects (standard errors in parenthesis)
Game order
All Piece rate Fix rate Tournament
Male Female Male Female Male Female Male Femal e
1st 49.01 (1.06) 45.02 (1.01) 49.26 (1.62) 43.48 (1.76) 44.8 (1.76) 46.93 (1.60) 53.53 (1.97) 44.83 (1.84)
2nd 49.52
(1.14) 46.593 (0.97) 47.71 (3.03) 48.97 (1.44) 49.2 (1.59) 44.76 (1.68) 51.11 (1.92) 46.53 (1.71)
3rd 49.71
The Tobit models presented in Table 2 highlight a number of additional results. First, men below 22 (68.47%) tend to perform better than their older counterparts. No such effect is found among women. Second, free riders, or people finding justified to avoid paying fares on public transportation, tend to perform worse than people reporting greater honesty in this context. The effect disappears with the men sample and is significant at the 10% level with the women sample. Women are also significantly more likely to find it justified to avoid paying fares on public transportation (30.89% compared to 21.62% for men, p value=0.0119). This finding is in line with Andreoni and Vesterlund (2001) that when altruism is expensive women are on average kinder, but when it is cheap men are on average more altruistic.
Finally, in the post experimental survey, participants were asked to rate the importance of
maximising their own income in the games from 1 (‘Not important at all’) to 4 (‘extremely important’). Not so surprisingly, the importance of maximising money is a significant
explanatory variable of performance in the second model, where additional control variable were included. Looking at distribution among the 4 categories between participants, we
observe that they were 12.39% to select the option ‘Not so important’ (10.81% for men;
13.82% for women), 53.41% to select the option ‘Very important’ (47.74% for men, 58.54%
Table 2 Determinants of performance - Hierarchical censored Tobit model (0-80)
All sample Men sample Women sample
Dependent variable Score Score Score
Models: XT Tobit (1) XT Tobit (2) XT Tobit (3) XT Tobit (4) XT Tobit (5) XT Tobit (6)
Tournament scheme 1.310**
(0.55) 1.310** (0.55) 1.995** (0.86) 1.995** (0.86) 0.682 (0.70) 0.682 (0.70)
Fix rate scheme -1.350**
(0.55) -1.350** (0.55) -1.945** (0.86) -1.945** (0.86) -0.894 (0.70) -0.894 (0.70)
Men only 2.449*
(1.43) 3.206* (1.84) 2.559* (1.87) 3.498*
(1.79) - -
Women only -2.388
(1.46)
-2.426
(1.65) - -
-2.459 (1.67)
-2.540 (1.72)
Payment scheme order (1=First; 2=Second; 3=Third) 0.673** (0.27) 0.673** (0.27) 0.084 (0.435) 0.084 (0.43) 1.170*** (0.35) 1.170*** (0.35) Socio-demographics
Sex (0=Men; 1=Women) 1.273
(2.01) - -
Age category (0=’<22’) -2.684** (1.24) -3.158* (1.80) -2.019 (1.68)
Work experience -2.630
(1.94)
-0.052 (2.71)
-5.268* (2.90)
Political attitude -0.120
(0.39) -0.094 (0.52) -0.336 (0.60) Behavioural
Dishonesty6 -2.907**
(1.34)
-3.245 (1.99)
-3.276* (1.82)
Trust7 1.062
(1.28)
2.752 (1.84)
-0.667 (1.76)
Fairness8 -1.732
(1.26)
-1.499 (1.79)
-2.082 (1.77)
Risk preference9 0.312
(0.31)
0.519 (0.44)
-0.049 (0.45)
Income maximisation10 1.832**
(0.92)
2.864** (1.28)
1.039 (1.35)
Constant 46.39***
(1.17) 42.514*** (4.74) 47.429*** (1.86) 35.415*** (6.16) 45.527*** (1.50) 51.954*** (6.60) Left-censored observations
0 0 0 0 0 0
Right-censored observations
0 0 0 0 0 0
Observations 702 702 333 333 369 369
Groups 234 234 111 111 123 123
Log-Likelihood -2481.266 -2472.897 -1191.121 -1183.731 -1283.632 -1279.501
6Do you think that it is justified to avoid the fare on public transport? (NO=0; YES=1)
7Generally speaking, would you say that most people can be trusted or that you need to be very careful in
dealing with people? (NO=0; YES=1)
8 Do you think that most people would try to take advantage of you if they got a chance or would they try to be
fair? (NO=0; YES=1)
9Are you generally a person who is fully prepared to take risks or do you try to avoid taking risks? Please use
the following scale, where the value 0 means: "risk averse" and the value 10 means: "fully prepared to take risks".
10How important was it for you to maximise your own income? (1:Not important at all; 2:Not so important;
3. Conclusions
Our experiment identifies gender differences in endurance, the capacity to maintain performance in non-rewarding tasks and over sequences of tasks. In particular, whilst both women and men are motivated by monetary rewards (as confirmed by the post experimental survey), the relative response of men to monetary (or extrinsic) rewards is on average higher (result 1). The size effects are not large, which suggests that these differences are indeed likely to lead to the formation of biased beliefs and the disproportionate allocation of non-rewarding tasks to women, as found in Babcock et al. (2017a and b).
We also find that women respond to social cues (result 2 on performance and gender composition of groups) but the effect is more through increased intrinsic motivation (ambition) than extrinsic motivation and opposite for men: men don’t bother or dare to compete as much when women are present and women instead get more ambitious when men are present. This can also help explain the relatively small advantages of gender segregation in education (college majors explain a substantial part of gender segregation across occupational groups in the US- Schneeweis and Zweimuller, 2012) on later labour market outcomes (Sullivan et al., 2011, find only a 5% wage premium for working women in the UK).
When looking at sequences of tasks (result 3) we instead find strong size effects in women’s
response to payment scheme order (and particularly a dislike of tournament as found in Niederle and Vesterlund, 2007, and related literature), men’s sensitivity to extrinsic rewards
References
Andreoni, J. and Vesterlund, L., 2001. Which is the fair sex? Gender differences in
altruism. The Quarterly Journal of Economics, 116(1), pp.293-312.
Apicella, Coren L., and Anna Dreber. 2015. “Sex Differences in Competitiveness: Hunter-Gatherer Women and Girls Compete Less in Gender-Neutral and Male-Centric
Tasks.” Adaptive Human Behavior and Physiology 1 (3): 247– 69.
Bandiera, O., Fischer, G., Prat, A. and Ytsma, E., 2016. Do women respond less to
performance pay? Building evidence from multiple experiments.
http://www.cepr.org/active/publications/discussion_papers/dp.php?dpno=11724
Babcock, L., Recalde, M.P., Vesterlund, L. and Weingart, L., 2017. Gender differences in
accepting and receiving requests for tasks with low promotability. The American Economic
Review, 107(3), pp.714-747.
Babcock, L., Recalde, M.P. and Vesterlund, L., 2017. Gender Differences in the Allocation
of Low-Promotability Tasks: The Role of Backlash. American Economic Review, 107(5),
pp.131-35.
Bertrand, M., Goldin, C. and Katz, L.F., 2010. Dynamics of the gender gap for young
professionals in the financial and corporate sectors. American Economic Journal: Applied
Economics, 2(3), pp.228-255.
Bohnet, I., 2016. What works: Gender equality by design. Harvard University Press.
Bordalo, P., Coffman, K., Gennaioli, N. and Shleifer, A., 2016. Stereotypes. The Quarterly
Journal of Economics, 131(4), pp.1753-1794.
Buser, Thomas, Noemi Peter, and Stefan Wolter. 2017. “Gender, Competitiveness, and Study
Choices in High School: Evidence from Switzerland.” American Economic Review. https://doi.org/10.1257/aer.p20171017.
Carter, M.J., 2014. Gender socialization and identity theory. Social Sciences, 3(2),
pp.242-263.
Coffman, K.B., 2014. Evidence on self-stereotyping and the contribution of ideas. The
Quarterly Journal of Economics, 129(4), pp.1625-1660.
Costa Jr, P., Terracciano, A. and McCrae, R.R., 2001. Gender differences in personality traits
across cultures: robust and surprising findings. Journai of Personality and Social Psychology 81( 2),pp.322-33.
Croson, Rachel, and Uri Gneezy. 2009. Gender Differences in Preferences. Journal of Eco- nomic Literature 47 (2): 448–74.
Eckel, C. C. and Fullbrunn, S. C., 2015. Thar SHE Blows? Gender, Competition, and Bubbles in Experimental Asset Markets. American Economic Review, 105(2):906–20.
Eckel, C.C. and Grossman, P.J., 1998. Are women less selfish than men?: Evidence from
dictator experiments. The economic journal, 108(448), pp.726-735.
Eckel, C.C. and Grossman, P.J., 2008. Men, women and risk aversion: Experimental
evidence. Handbook of experimental economics results, 1, pp.1061-1073.
Eswaran, M., 2014. Why gender matters in economics. Princeton University Press.
Falk, A., Becker, A., Dohmen, T.J., Enke, B. and Huffman, D., 2015. The nature and
predictive power of preferences: Global evidence.
Frey, B. and J. Gallus, 2017. Honours versus Money. Oxford University Press.
Environments: Gender Differences. Quarterly Jour- nal of Economics 118 (3): 1049–74.
Goldin, C., 2014. A grand gender convergence: Its last chapter. The American Economic
Review, 104(4), pp.1091-1119.
Howe, Leslie A. 2008. “On Competing Against Oneself, or ‘I Need to Get a Different Voice
in My Head.’” Sport, Ethics and Philosophy 2 (3): 353–66.
Karwowski, M., Lebuda, I., Wisniewska, E. and Gralewski, J., 2013. Big Five Personality
Traits as the Predictors of Creative Self‐Efficacy and Creative Personal Identity: Does
Gender Matter?. The Journal of Creative Behavior, 47(3), pp.215-232.
Kuhn, P., Villeval, MC. (2015). Are women more attracted to cooperation than men?, The Economic Journal, 125, 115–140. Doi: 10.1111/ecoj.12122.
Locke, Edwin A. 1968. “Toward a Theory of Task Motivation and Incentives.” Organizational Behavior and Human Performance 3 (2): 157– 89.
Nelson, J.A., 2014. The power of stereotyping and confirmation bias to overwhelm accurate
assessment: the case of economics, gender, and risk aversion. Journal of Economic
Methodology, 21(3), pp.211-231.
Nelson, J.A., 2015. Are Women Really More Risk‐Averse than Men? A Re‐Analysis of the
Literature Using Expanded Methods. Journal of Economic Surveys, 29(3), pp.566-585.
Niederle, M. and Vesterlund, L., 2010. Explaining the gender gap in math test scores: The
role of competition. The Journal of Economic Perspectives, 24(2), pp.129-144.
Niederle, Muriel, and Lise Vesterlund. 2007. “Do Women Shy Away from Competition? Do
Men Compete Too Much?” Quarterly Journal of Economics 122 (3): 1067–101.
Reuben, Ernesto, Paola Sapienza, and Luigi Zingales. 2015. “Taste for Competition and the
Gender Gap Among Young Business Pro fessionals.” National Bureau of Economic Research Working Paper 21695.
Schmitt, D.P., Realo, A., Voracek, M. and Allik, J., 2008. Why can't a man be more like a
woman? Sex differences in Big Five personality traits across 55 cultures. Journal of
personality and social psychology, 94(1), p.168.
Schneeweis, N. and Zweimüller, M., 2012. Girls, girls, girls: Gender composition and female
school choice. Economics of education review, 31(4), pp.482-500.
Sullivan, A., Joshi, H. and Leonard, D., 2011. Single‐sex schooling and labour market
outcomes. Oxford Review of Education, 37(3), pp.311-332.
Zetland, D. and Della Giusta, M., 2011. Focal points, gender norms and reciprocation in
Appendices
1. Participant Instructions
In this experiment you will be performing the same task three different times. The task will consist of moving as many balls as possible from one container to another, using the mouse, in 90 seconds. In order to get familiar with the task there is first a training session.
This is an example of how the task looks like:
In order to move the balls you need to click on the ball in the left-hand side container and drag the ball to the right-hand side container. The number of balls successfully moved in the right-hand side container appears on the top of the screen. To help with time management, there will be a clock counting down the seconds for the 90 seconds duration.
At the end of each task, you will receive new instructions for the following task.
BEGINNING OF THE TASK
On the computer in front of you the following screen will appear:
You will need to enter the personal code you have been given at the entrance. After you have entered the code, please press the arrow button to proceed.
A yellow box will appear, asking to confirm the personal code. Please check that the personal code typed matches exactly the one you have been given and then press confirm to proceed. On the next screen an arrow button will appear. Click on the arrow button you can see and a screen with four questions will appear. In these questions you will be asked your gender, if you have any work experience, if your mother has a job and if your father has a job. Please answer all the questions and then press the arrow button. A yellow box will appear asking confirmation regarding the answers you gave to the questions. Please press confirm to proceed. On the next screen an arrow button will appear. When you press the arrow button the practice task starts and you will be asked to move as many balls as possible from the left-hand side container to the right-left-hand side container in a 1 minute period. This first task will be only to practice with the game and it will only last 1 minute.
After 1 minute, the training session will be over and a yellow box will appear confirming that you finished this task.
Please click OK to proceed.
A general screen will appear where there are three buttons:
You will be asked to press one of the three buttons: play 1, play 2 or play 3. Please listen carefully to the instructions, I will tell you exactly which button you need to press each time. The numbers on the buttons do not correspond to the order of the tasks. You are requested to complete all the three tasks but I will tell you in which order.
The task to complete is always the same: move as many balls as possible from the left-hand side container to the right-hand side container in 90 seconds.
After you finish the three tasks you will be asked to complete a quick questionnaire. Please answer every question and then press the arrow button.
2. Post-experimental questionnaire
How old are you?
What is the degree programme you are registered for?
What is your nationality?
What is your religion?
What is your marital status?
What is the highest level of education your father has received?
What is the highest level of education your mother has received?
Please indicate your political attitude in the following scale:
Left о о о о о о о о о Right
How many participants in the experiment do you know by name?
Do you think that most people would try to take advantage of you if they got a chance or would they try to be fair? YES NO
Do you think that it is justified to avoid the fare on public transport? YES NO
Generally speaking, would you say that most people can be trusted or that you need to be very careful in dealing with people? YES NO
A
re you generally a person who is fully prepared to take risks or do you try to avoid taking risks? Please use the following scale, where the value 0 means: "risk averse" and the value 10 means: "fully prepared to take risks".
"Risk averse" 0 1 2 3 3 5 6 7 8 9 10 "Fully prepared to take risks"
How did you find the instructions? EASY DIFFICULT
How important was it for you to maximise your own income?
NOT IMPORTANT AT ALL
NOT SO IMPORTANT
VERY IMPORTANT