ORIGINAL RESEARCH
Patient Skin Dose during Neuroembolization by
Multiple-Point Measurement Using a
Radiosensitive Indicator
S. Suzuki S. Furui Y. Matsumaru S. Nobuyuki M. Ebara T. Abe D. Itoh
BACKGROUND AND PURPOSE: Although neuroembolization has recently spread quickly, sufficient attention has not been focused on the associated radiation exposure. The purpose of this research was to evaluate the patient’s entrance skin dose (ESD) during neuroembolizations in 6 institutions. MATERIALS AND METHODS: This study was approved by all of the 6 institutional review boards, and all of the patients gave informed consent. This study included a total of 103 consecutive neuroemboli-zations in the 6 institutions. Patient ESDs during the procedures were evaluated by using caps that had 44 radiosensitive indicators adherent to the surface. The patient ESDs were calculated from the color difference of the indicators. To check for effects on the scalp, clinical follow-up was performed at 1-2 days, 2 weeks, and 3 months after the procedure.
RESULTS: The averages of total fluoroscopic time, total number of digital subtraction angiography frames, and dose area product were 67.1⫾41.6 minutes, 883⫾626, and 257⫾150 Gy⫻cm2, respectively. The average maximum ESD for each patient was 1.9⫾1.1 Gy (range, 0.4 –5.6 Gy; median, 1.5 Gy). The average maximum ESDs of each institution ranged from 1.0 to 2.4 Gy. Epilation was observed in 6 patients.
CONCLUSIONS:The maximum ESDs during neuroembolizations exceed the thresholds for radiation skin injuries in some cases.
N
euroembolization is one treatment for diseases such as cerebral aneurysm, arteriovenous malformation, and du-ral arteriovenous fistula. Neuroembolization is characterized by low invasiveness and a wide range of indications, and so has recently spread quickly. The radiation exposure is greater than that during diagnostic angiography due to the prolonged flu-oroscopic time and large number of digital subtraction an-giography (DSA) frames, and it can induce radiation skin in-juries.1-4Although some methods of estimating the skin dose are available, the optimal method for archiving exposure to patients still has to be established. Different methods for the evaluation of entrance skin dose (ESD) and maximum skin dose have been proposed and tested.5-12In this study, we eval-uated the patients’ ESD during this procedure by multiple-point measurement using radiosensitive indicators in 6 institutions.Methods
Patient Population and Target Lesions
The protocol was approved by the regional ethics committees of the respective institutions. Informed written consent was obtained in
ac-cordance with the recommendations of the revised Declaration of Helsinki.
Our study included 103 consecutive patients (75 women and 28 men) who underwent neuroembolizations in 6 institutions (Founda-tion for Biomedical Research and Innova(Founda-tion, Jikei University Hos-pital, Kobe City Medical Center General HosHos-pital, Kurume University Hospital, University of Tokyo Hospital, and Toranomon Hospital) during the period from December 2005 to March 2007. Their mean
age was 58⫾14 years (range, 19 – 82 years). Patient height and weight
were 157.9⫾9.3 cm (range, 142.5–178.0 cm) and 57.4⫾11.5 kg
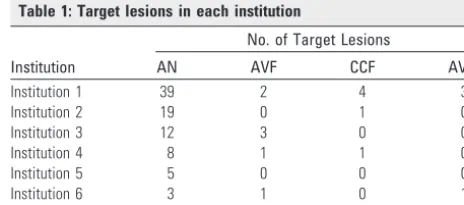
(range, 36.6 –90.2 kg), respectively. The details of target lesions were 86 cerebral aneurysms, 7 dural arteriovenous fistulas, 6 internal ca-rotid artery cavernous sinus fistulas, and 4 arteriovenous malforma-tions (Table 1).
Angiography
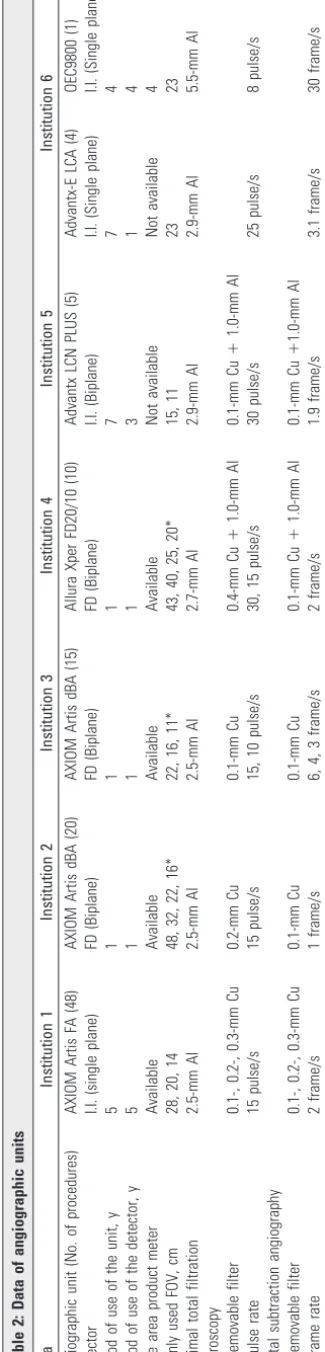
Seven kinds of angiographic units with image intensifier (n⫽4) or
digital flat panel detector (n⫽3) were used (Table 2). The period of
use of the units was 1–7 years.
The FOV mainly used in each procedure was 11 (n⫽5), 14 (n⫽
43), 15 (n⫽2), 16 (n⫽11), 20 (n⫽7), 22 (n⫽16), 23 (n⫽5), 25
(n⫽4), 28 (n⫽1), 32 (n⫽3), 40 (n⫽2), 43 (n⫽1), or 48 cm (n⫽
3). The FOVs of the digital flat panel detector were specified by the
Received November 24, 2007; accepted after revision January 15.
From the Department of Radiology (S.S., S.F.), Teikyo University School of Medicine, Tokyo, Japan; Department of Endovascular Neurosurgery (Y.M.), Toranomon Hospital, Tokyo, Japan; Department of Neurosurgery (S.N.), Kobe City Medical Center General Hospital, Kobe, Japan; Department of Neurosurgery (M.E.), Jikei University School of Medicine, Tokyo, Japan; Department of Radiology (T.A.), Kurume University School of Medicine, Fukuoka, Japan; Department of Radiology (D.I.), University of Tokyo Graduate School of Medicine and Faculty of Medicine, Tokyo, Japan.
This study was partially supported by Grant-in-Aid for Scientific Research from Japan Society for the Promotion of Science, Tokyo, Japan.
Please address correspondence to Shigeru Suzuki, Department of Radiology, Teikyo University School of Medicine, 2-11-1 Kaga, Itabashi-ku, Tokyo 173-8605, Japan; e-mail: [email protected]
[image:1.594.301.533.610.712.2]DOI 10.3174/ajnr.A1045
Table 1: Target lesions in each institution
Institution
No. of Target Lesions
AN AVF CCF AVM
Institution 1 39 2 4 3
Institution 2 19 0 1 0
Institution 3 12 3 0 0
Institution 4 8 1 1 0
Institution 5 5 0 0 0
Institution 6 3 1 0 1
Overall 86 7 6 4
diagonal length. Pulsed fluoroscopy was used during all 103 of the
procedures (8 pulses per minute,n⫽1; 10 pulses per minute,n⫽5;
15 pulses per minute,n⫽86; 25 pulses per minute,n⫽4; 30 pulses
per minute,n⫽7). Procedures were performed by 6 neurosurgeons
and 2 radiologists, who had 6-20 years of experience with neuro-intervention. As a part of the study, we recorded the total fluoroscopic time, total number of DSA frames, and total dose area product (DAP) value. For biplane units, we used the total values, combining the val-ues of frontal and lateral x-ray tubes.
Indicator Use and Evaluation
The patient put on a cap that had 44 radiosensitive indicators (RadiMap; Nichiyu Giken Kogyo, Saitama, Japan) adherent to the
surface (Fig 1). The indicator was a rectangle of 1.3⫻1.8 cm and was
applied with an adhesive to the reverse. Indicators were arranged in
the right aspect (n⫽19), left aspect (n⫽19), and parietal aspect (n⫽
6) at intervals of 5 cm. An indicator had 2 kinds of functional dye (high-dose type and low-dose type). In this study, only low-dose type was used. With x-ray absorption, the color of the functional dyestuffs changed from translucent to red in the low-dose type.
Suzuki et al13investigated methods to calculate the exposure dose
from the color of the indicator. They analyzed the color of the indi-cators with a color-measuring instrument (Chroma Meters CR-300; Konika Minolta Holdings, Tokyo, Japan) and measured the color difference after irradiation. According to their report, there was an almost linear relationship between the color difference of the indica-tor and the natural logarithm of the dose between 0.3 Gy and 6.0 Gy
for low-dose type. The regression equation was D⫽exp (DE*⫻
0.0543⫺2.168) for low-dose type, where D was the absorbed dose
(Gy); DE* was the color difference of the indicator.
We assessed the effect of the tube voltage, filtration, and dose rate on the dose response of the indicator as follows. MBR-1520A-two (Hitachi Medico, Tokyo, Japan) was used as the x-ray irradiation equipment. Irradiation conditions were based on the following pro-tocol: 50-, 75-, 100-, or 125-kVp tube voltage; 5- or 20-mA tube cur-rent; and total filtration of 2.2 mm of aluminum, 5.2 mm of
alumi-num, 3.7 mm of aluminum⫹0.1 mm of copper, and 3.7 mm of
aluminum⫹0.4 mm of copper. Indicators were irradiated at the dose
of 1 Gy. After the irradiation, the color of the indicators was analyzed with a color-measuring instrument (Chroma Meters CR-300). Figure
2Aillustrates the effect of tube voltage and filtration on the color
difference of the indicator. The difference in the color difference was
Fig 1.Photograph of indicators. A total of 44 indicators were adhered to a cap (right aspect,
n⫽19; left aspect,n⫽19; and parietal aspect,n⫽6) at intervals of 5 cm.
[image:2.594.301.535.42.203.2] [image:2.594.53.216.49.727.2]within 2.20, resulting in a difference less than 0.11 Gy in the absorbed
dose with the above regression equation. Figure 2B illustrates the
effect of dose rate on the color difference. For each filtration, the difference in the color difference between the 2 dose rates was within 0.79, resulting in a difference less than 0.04 Gy in the absorbed dose. As shown in Fig 2, little effect of these factors on the color differ-ence of the indicator was observed, and the angiographic unit factors are usually within these ranges. Therefore, we determined the ab-sorbed dose by using the above regression equation.
After the procedure, the color of the indicators was analyzed with a color-measuring instrument (Chroma Meters CR-300), and the ab-sorbed doses were calculated from the color difference of the indica-tors. We regarded the absorbed doses as the ESDs at the points. In each patient, we evaluated the ESDs in all of the 44 points on the cap and obtained the maximum ESD. Because the color of the indicator is changed by heat or light, the manufacturer recommends preservation at a temperature below 10°C in a dark place. According to the data provided by the manufacturer, little color change of the indicator is observed under fluorescent light at 40°C within 2 days. We preserved the cap with the indicators in a bag for shading and kept it in a refrig-erator before and immediately after the neuroembolization. We ana-lyzed the relationship between the total DAP and the maximum ESD
by the Pearson correlation coefficient (r).
Follow-Up to Check for Effects on the Skin
To check for effects on the scalp, clinical follow-up was performed at 1–2 days, 2 weeks, and 3 months after the neuroembolization in 79 patients (65 cerebral aneurysm, 6 dural arteriovenous fistulas, 5 in-ternal carotid artery cavernous sinus fistulas, and 3 arteriovenous malformations).
Results
Patient and Angiographic Data
Table 3 shows the averages of total fluoroscopic time, total number of DSA frames, DAP, and maximum ESD. The aver-age total fluoroscopic time was 67.1⫾41.6 minutes (range,
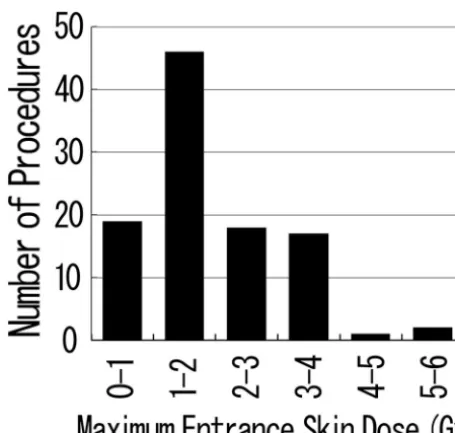
8.1–204.5 minutes), and the average total number of DSA frames was 883⫾626 (range, 219 –5280). The DAP values were available for 93 procedures in 4 institutions, and the av-erage DAP value was 257⫾150 Gy⫻cm2(range, 24 – 891 Gy⫻cm2). The mean of the maximum ESD for each patient was 1.9⫾1.1 Gy (range, 0.4 –5.6 Gy; median, 1.5 Gy). Of the 103 patients, 84 received ESDs exceeding 1 Gy, 20 received ESDs exceeding 3 Gy, and 2 received ESDs exceeding 5 Gy (Fig 3). The average dose, average total fluoroscopic time, average total number of DSA frames, and average DAP of each insti-tution were 1.0 to 2.4 Gy, 32.8 to 114.8 minutes, 604 –1756 frames, and 215–327 Gy⫻cm2, respectively.
Table 4 shows the averages of total fluoroscopic time, total number of DSA frames, DAP, and maximum ESD for each
Fig 3.Maximum ESD distribution of each procedure. The maximum ESD of the patients exceeded 1 Gy in 84 procedures, 3 Gy in 20 procedures, and 5 Gy in 2 procedures.
[image:3.594.56.519.42.187.2]Fig 2.Effects of tube voltage, filtration, and dose rate on the color difference of the indicator.A, Indicators were irradiated at the dose of 1 Gy by using 4 tube voltages (50, 75, 100, and 125 kV) and 4 types of filtration (2.2 mm of aluminum, 5.2 mm of aluminum, 3.7 mm of aluminum⫹0.1 mm of copper; and 3.7 mm of aluminum⫹0.4 mm of copper) with a 20-mA tube current. The difference in the color difference was within 2.20.B, The effect of the dose rate was also evaluated by using 2 tube currents (5 and 20 mA) for the 4 types of filtration at the dose of 1 Gy with tube voltage of 75 kVp. For each filtration, the difference in the color between the 2 dose rates was within 0.79. Al indicates aluminum; Cu, copper.
Table 3: Averages of total fluoroscopic time, number of DSA frames, DAP, and maximum ESD in each institution
Variable
Institution Overall
(n⫽103) 1 (n⫽48) 2 (n⫽20) 3 (n⫽15) 4 (n⫽10) 5 (n⫽5) 6 (n⫽5)
Total fluoroscopic time, min 62.3⫾35.1 50.6⫾30.0 114.8⫾40.2 32.8⫾24.0 56.4⫾14.7 107.8⫾53.8 67.1⫾41.6 Total no. of DSA frames 654⫾376 960⫾356 1447⫾368 604⫾231 1756⫾2024 770⫾191 883⫾626
DAP, Gy⫻cm2 218⫾141 327⫾162 326⫾98 215⫾162 * * 257⫾150
Maximum ESD, Gy 2.1⫾1.1 1.6⫾0.8 2.4⫾1.3 1.5⫾1.2 1.3⫾0.7 1.0⫾0.2 1.9⫾1.1
[image:3.594.55.534.206.274.2] [image:3.594.303.531.313.530.2]target lesion. In the procedures for dural arteriovenous fistulas and internal carotid artery cavernous sinus fistulas, the aver-age total fluoroscopic times exceeded 2 hours, and the maxi-mum ESDs were 2ⱖGy.
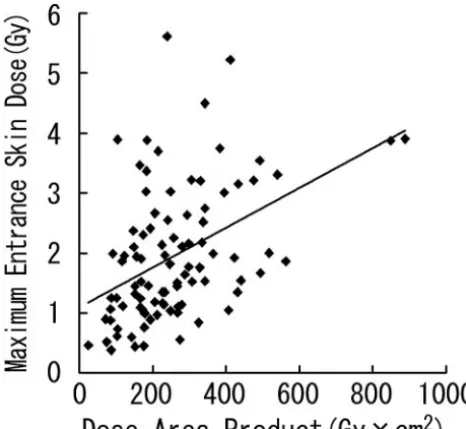
Linear regression demonstrated a significant correlation between DAP and the maximum ESD (r⫽0.445;P⬍.0001; maximum ESD [Gy]⫽1.100⫹0.003⫻DAP [Gy⫻cm2]; Fig 4). However, there was wide variation among individual instances.
Follow-Up to Check for Effects on the Skin
Radiation skin injuries, namely, epilation corresponding with the most exposed area, were observed in 6 patients (Table 5;
Fig 5). Epilation was observed in both of the patients, with the maximum ESD exceeding 5 Gy. Among the 18 patients with the maximum ESD of 3–5 Gy, 16 patients were followed up clinically, with epilation observed in 3 of them. In 1 patient with a maximum ESD of 2.7 Gy, epilation was observed at 3 months of follow-up.
Discussion
In acute irradiation, the thresholds of early transient ery-thema, temporary epilation, permanent epilation, and delayed dermal necrosis are 2, 3, 7, and 12 Gy, respectively.14,15The International Commission on Radiologic Protection has rec-ommended that the maximum skin dose and its location be recorded for interventional procedures with the maximum cumulative skin dose of 3 Gy or more (ⱖ1 Gy in repeatable cases).15The Food and Drug Administration has listed vascu-lar embolization as one of the procedures for which interven-tionalists should be aware of the potential for serious radia-tion-induced skin injury.16 It has been recommended that radiation dose information be reported for vascular emboliza-tion procedures, too.17
In this study, the maximum ESDs exceeded 3 Gy in 20 procedures, and epilation was observed in 6 patients. There-fore, it is desirable to estimate the patient ESDs in individual neuroembolizations. If the maximum ESD is 3 Gy or above, the patient should be followed up for 10 –14 days after the procedure and informed of the possible symptoms and signs.15
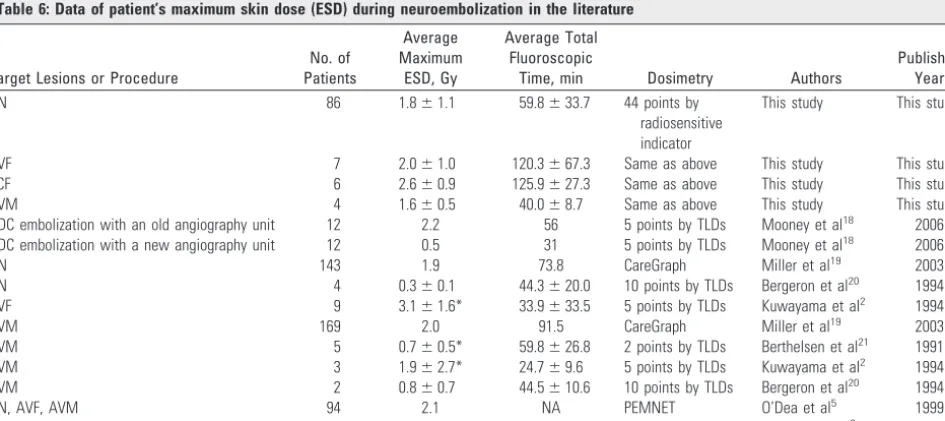
[image:4.594.53.284.69.167.2]We compared the patient skin doses during neuroemboli-zation in the literature2,5,6,18-21(Table 6). Mooney and Flynn18 reported that a new angiographic unit delivered less maxi-mum ESDs (0.5 Gy) with refined additional spectral filtration and improved resolution compared with an old unit (2.2 Gy). This may be the reason why the maximum ESD reported by Kuwayama et al2in 1994 was higher compared with the doses in the recent reports. The maximum ESDs in the reports with thermoluminescent dosimeters (TLDs) tend to be lower than the doses determined by other methods of dosimetry. As will be described later, dosimetry with TLD is likely to underesti-mate the maximum ESDs due to the restricted measurement points. On the other hand, this type of underestimation does not occur in the calculation of ESD by an on-line computer system, such as CareGraph19or PEMNET.5Our results are consistent with the results of O’Dea et al5and Miller et al19by using the on-line computer system. Also in their reports, the maximum ESDs during neuroembolization were approxi-mately 2 Gy. There were differences in the maximum ESDs among institutions. The average maximum ESD in one insti-tution was approximately 2.5-fold of that in another. The
Table 5: Six cases of radiation-induced epilation at the most exposed area
Case
No. Institution
Target Lesions
Maximum ESD, Gy
Total Fluoroscopic Time, min
Most Exposed Area
Time of Onset
Type of Epilation
Case 1 1 AN 2.7 70.5 Left occipital 3 mo Temporary
Case 2 1 AN 5.6 96.5 Right temporal 2 wk Temporary
Case 3 1 AN 3.0 75.0 Right occipital 2 wk Temporary
Case 4 1 AN 3.9 68.0 Right occipital 2 wk Temporary
Case 5 3 AN 5.2 111.4 Right occipital 2 wk Temporary
Case 6 3 AN 3.2 128.7 Right occipital 2 wk Temporary
Note:—AN indicates cerebral aneurysm.
Table 4: Averages of total fluoroscopic time, number of DSA frames, DAP, and maximum ESD for each target lesion
Variable
Target Lesions
AN (n⫽86)
AVF (n⫽7)
CCF (n⫽6)
AVM (n⫽4) Total fluoroscopic
time, min
59.8⫾33.7 120.3⫾67.3 125.9⫾27.3 40.0⫾8.7
Total no. of DSA frames
812⫾22 1405⫾758 1125⫾251 1141⫾320
DAP, Gy⫻cm2 233⫾132 380⫾166 428⫾233 307⫾36 Maximum ESD, Gy 1.8⫾1.1 2.0⫾1.0 2.6⫾0.9 1.6⫾0.5
Note:—Data are given as average⫾SD. AN indicates cerebral aneurysm; AVF, dural arteriovenous fistula; CCF, internal carotid artery cavernous sinus fistula; AVM, arterio-venous malformation; DSA, digital subtraction angiography; DAP, dose area product; ESD, entrance skin dose.
[image:4.594.53.286.211.425.2] [image:4.594.53.533.630.720.2]maximum ESDs can be affected by differences in the degree of difficulty of the target lesion, types of angiographic unit, modes of fluoroscopy and image acquisition, and techniques used for reduction of patient exposure. Therefore, interven-tionalists should estimate the patients’ maximum ESDs during the neuroembolizations in individual institutions. If the max-imum ESDs during the procedures are high, the causes should be investigated and dealt with. Interventionists should, in co-operation with medical physicists, establish the nominal doses (or usual range of doses) for the procedures that they com-monly perform.15
The optimal methods to estimate ESD at various skin sites during interventional radiology have not been established. The ESDs at several points can be estimated by placing the radiometer, such as the TLD, on the patient surface.2,6,18,20,21 However, the process of dosimetry usually takes time, and
real-time information about the skin dose is not available. In addition, the measurable area is generally restricted and can-not necessarily estimate the dose of the maximally exposed part. Another method is to calculate ESDs by using the DAP meter.22However, in neuroembolization, the x-ray beam can enter the patients in many directions, and it is not easy to evaluate the patients’ maximum ESD and its location with the DAP meter. In the study by Miller et al,19there was a good correlation between them (Pearsonr⫽0.848;P⬍.000001). However, they found wide variation among individual in-stances, especially at high doses, in their evaluation of the re-lationship between the maximum ESD and DAP. Therefore, they stated that predictions of the maximum ESD from regres-sion equation for DAP are imprecise. Also in this study, we found variation among individual instances in the evaluation of the relationship between the maximum ESD and DAP, though there was a significant correlation between them.
Calculation of ESD by on-line computer system without DAP meter is also available for estimation of patient’s ESD.5 However, the displayed ESD by this system also does not rep-resent the maximum ESD when the beam angulations are changed during the procedure. Miller et al19used a system that automatically measures patients’ skin doses by use of the geo-metric settings of the gantry, investigation table, x-ray beam, and an ionization chamber. It allows calculation of the accu-mulated skin radiation dose and detection of the high-dose area in real time. However, the system needs to be installed in individual angiographic equipment and can be used only in limited institutions. Furthermore, the system is no longer of-fered for sale on new equipment.23
The dosimetry with radiosensitive indicators gives real-time information about the skin dose distribution during neu-roembolizations, when the color of the indicators is compared with a color sample visually.24Real-time information about the skin dose will enable interventionalists to change the beam angulations before the dose exceeds the thresholds for severe radiation skin injury. Dosimetry with radiosensitive
indica-Fig 5.Distribution of ESDs in a patient with radiation skin injury. Neuroembolization for internal carotid-posterior communicating aneurysm was performed for a 43-year-old woman. The FOV mainly used was 14 cm. Total fluoroscopic time and DAP were 75.0 minutes and 182 Gy⫻cm2, respectively; 4° left anterior oblique with 17° cranial
[image:5.594.55.285.42.192.2]angulation view was mostly used. Exposed skin area was localized to the occipital region with the maximum ESD of 3.0 Gy. Temporary epilation was detected at the maximum exposure part (slanted lines) at 2 weeks and 3 months of follow-up. The number in the open square represents the ESD (Gy) at the point. — in the open square means the ESD at the point was less than 0.3 Gy.
Table 6: Data of patient’s maximum skin dose (ESD) during neuroembolization in the literature
Target Lesions or Procedure
No. of Patients
Average Maximum
ESD, Gy
Average Total Fluoroscopic
Time, min Dosimetry Authors
Published Year
AN 86 1.8⫾1.1 59.8⫾33.7 44 points by
radiosensitive indicator
This study This study
AVF 7 2.0⫾1.0 120.3⫾67.3 Same as above This study This study
CCF 6 2.6⫾0.9 125.9⫾27.3 Same as above This study This study
AVM 4 1.6⫾0.5 40.0⫾8.7 Same as above This study This study
GDC embolization with an old angiography unit 12 2.2 56 5 points by TLDs Mooney et al18 2006 GDC embolization with a new angiography unit 12 0.5 31 5 points by TLDs Mooney et al18 2006
AN 143 1.9 73.8 CareGraph Miller et al19 2003
AN 4 0.3⫾0.1 44.3⫾20.0 10 points by TLDs Bergeron et al20 1994 AVF 9 3.1⫾1.6* 33.9⫾33.5 5 points by TLDs Kuwayama et al2 1994
AVM 169 2.0 91.5 CareGraph Miller et al19 2003
AVM 5 0.7⫾0.5* 59.8⫾26.8 2 points by TLDs Berthelsen et al21 1991
AVM 3 1.9⫾2.7* 24.7⫾9.6 5 points by TLDs Kuwayama et al2 1994
AVM 2 0.8⫾0.7 44.5⫾10.6 10 points by TLDs Bergeron et al20 1994
AN, AVF, AVM 94 2.1 NA PEMNET O’Dea et al5 1999
AN, AVM 31 0.9⫾0.5 34.8⫾12.6 23 points by TLDs Kemerink et al6 2002
Note:—AN indicates cerebral aneurysm; AVF, dural arteriovenous fistula; CCF, internal carotid artery cavernous sinus fistula; AVM, arteriovenous malformation; GDC, Guglielmi detachable coil; TLD, thermoluminescent dosimeter; NA, not available; ESD, entrance skin dose.
[image:5.594.60.533.496.706.2]tors is also useful to reduce the cumulative skin dose in the same area during repeated procedures.24In the case of high-dose exposure during previous procedures, interventionalists can reduce the cumulative skin dose by marking the part on the cap with a radiopaque material and excluding the marker from the irradiation field. The measurement errors in the do-simetry with radiosensitive indicators have not been ade-quately assessed. Dosimetries are generally affected by such factors as tube voltage, filtration level, and dose rate of the angiographic units. However, this study showed little effect of these factors on the dosimetry with radiosensitive indicators (Fig 2). In addition, Suzuki et al24reported that ESDs esti-mated by TLD and the doses by indicators correlated well (r2 ⫽0.9679;P⬍.0001). Therefore, we think that the measure-ment error will not be significant for the practical dose evaluation.
This study has some limitations. We selected institutions at which neuroembolization is performed frequently, which might have biased the results. Further studies are required in many institutions.
In conclusion, the maximum ESDs during neuroemboliza-tion exceed the thresholds for radianeuroemboliza-tion skin injuries in some cases. Therefore, the patients’ ESDs at multiple points should be estimated to reduce the doses.
References
1. Huda W, Peters KR.Radiation-induced temporary epilation after a neurora-diologically guided embolization procedure.Radiology1994;193:642– 44 2. Kuwayama N, Takaku A, Endo S, et al.Radiation exposure in endovascular
surgery of the head and neck.AJNR Am J Neuroradiol1994;15:1801– 08 3. Norbash AM, Busick D, Marks MP.Techniques for reducing interventional
neuroradiologic skin dose: tube position rotation and supplemental beam filtration.AJNR Am J Neuroradiol1996;17:41– 49
4. Mooney RB, McKinstry CS, Kamel HA.Absorbed dose and deterministic ef-fects to patients from interventional neuroradiology. Br J Radiol 2000;73:745–51
5. O’Dea TJ, Geise RA, Ritenour ER.The potential for radiation-induced skin damage in interventional neuroradiological procedures: a review of 522 cases using automated dosimetry.Med Phys1999;26:2027–33
6. Kemerink GJ, Frantzen MJ, Oei K, et al.Patient and occupational dose in neu-rointerventional procedures.Neuroradiology2002;44:522–28
7. Theodorakou C, Horrocks JA.A study on radiation doses and irradiated areas in cerebral embolisation.Br J Radiol2003;76:546 –52
8. Struelens L, Vanhavere F, Bosmans H, et al.Skin dose measurements on pa-tients for diagnostic and interventional neuroradiology: a multicentre study.
Radiat Prot Dosimetry2005;114:143– 46
9. Gkanatsios NA, Huda W, Peters KR, et al.Evaluation of an on-line patient exposure meter in neuroradiology.Radiology1997;203:837– 42
10. D’Ercole L, Mantovani L, Thyrion FZ, et al.A study on maximum skin dose in cerebral embolization procedures.AJNR Am J Neuroradiol2007;28:503– 07 11. Amano M, Nishitani H, Kohno S, et al.Patient skin dose in interventional
radiology using radiochromic dosimetry film.Nippon Hoshasen Gijitsu Gakkai Zasshi2003;59:121–29
12. Rampado O, Ropolo R.A method for real time estimation of entrance skin dose distribution in interventional neuroradiology. Med Phys 2004;31:2356 – 61
13. Suzuki S, Furui S, Isshiki T, et al.Factors affecting the patient’s skin dose during percutaneous coronary intervention for chronic total occlusion.Circ J 2007;71:229 –33
14. Wagner LK, Eifel PJ, Geise RA.Potential biological effects following high X-ray dose interventional procedures.J Vasc Interv Radiol1994;5:71– 84 15. International Commission on Radiological Protection.Avoidance of radiation
injuries from medical interventional procedures. ICRP publication 85.Ann ICRP2000;30:25– 43
16. Food and Drug Administration.Avoidance of Serious X-Ray Induced Skin Injuries to Patients during Fluoroscopically-Guided Procedures.Statement 9. Rockville, MD: Food and Drug Administration; 1994
17. Food and Drug Administration.Recording Information in the Patient’s Medical Record that Identifies the Potential for Serious X-Ray-Induced Skin Injuries Fol-lowing Fluoroscopic Guided Procedures. Statement 15. Rockville, MD: Food and Drug Administration; 1995
18. Mooney RB, Flynn PA.A comparison of patient skin doses before and after replacement of a neurointerventional fluoroscopy unit. Clin Radiol 2006;61:436 – 41
19. Miller DL, Balter S, Cole PE, et al.Radiation doses in interventional radiology procedures: the RAD-IR study: part II: skin dose.J Vasc Interv Radiol 2003;14:977–90
20. Bergeron P, Carrier R, Roy D, et al.Radiation doses to patients in neurointer-ventional procedures.AJNR Am J Neuroradiol1994;15:1809 –12
21. Berthelsen B, Cederblad A.Radiation doses to patients and personnel involved in embolization of intracerebral arteriovenous malformations.Acta Radiol 1991;32:492–97
22. Fransson SG, Persliden J.Patient radiation exposure during coronary angiog-raphy and intervention.Acta Radiol2000;41:142– 44
23. Wagner LK.You do not know what you are doing unless you know what you are doing.Radiology2002;225:327–28