Munich Personal RePEc Archive
Analysis of internal factor (Operating
Margin) affect the Coty Incorporated
Performance.
Abdullah, Fara Izzatie
Universiti Utara Malaysia
18 November 2019
Online at
https://mpra.ub.uni-muenchen.de/97337/
Analysis of Internal Factor (Operating Margin) affect the Coty Incorporated performance
Fara Izzatie Binti Abdullah
School Of Economic, Finance And Banking, University Utara Malaysia (UUM), Sintok, Kedah, Malaysia
ABSTRACT
This paper aim to elaborate some most importance information regarding Coty Incorporation‘s performance and its determinant. This study been research from the company’s annual report and
other trusted resources that relate to the company for year 2014- 2018. The purpose is to know what internal and external factor that affect the company performance or more specific dependable variable. The internal factor consist of current ratio, quick ratio, average collection period, debt to income, operational ratio, operating margin and corporate governance index. Meanwhile for the external factor include the GDP, inflation, interest change, exchange rate and standard deviation. The method that been used to collect data is Statistical Package for the Social Science (SPSS) version 25. Every company been running to increase sale and profit, same goes to Coty Incorporation. Hence, this study using Return of Ratio (ROA) method as its dependable variable to identify how well the company can convert its investment in asset into profit. This method the most efficiency to the management of company and the investor in that company to see it. The higher this ratio, the higher company will earn the profit. After been analysis and interpret the data in SPSS, the study found the internal factor which is Operating Margin give a
strong influence to asset of Coty’s Incorporated. As already know, the operating margin is
amount revenue that left over after using all operating cost. Its mean the higher amount been left over, the higher cover for non-operating costs such as interest expenses.
1.0 INTRODUCTION
1.1 Overview
Coty Incorporated is one of the world’s largest beauty companies in global level. It’s involvement of a rich entrepreneurial tradition and iconic portfolio of brands. This company been founded since 1904and grown up into beauty company with multi-segment. Their leading market position already reach at North America and Europe through offering new product, sales channel been diversified, acquisitions and make strategies for global growth. Coty Incorporated well known as world leading beauty company making cosmetics, skincare, fragrances, hair colour and
any style that been of consumer’s demand. Beside that, Coty Inc. have been global leader in fragrance, a strong number two in professional salon hair color & styling, and number three in colour cosmetics.
Beside that, Coty Inc. organized into three division. These three are home to iconic global brands and much loved regional brands. That Is Consumer Beauty, Luxury and Professional Beauty. Each division has end-to-end responsibility to optimize the consumers’ beauty experiences in their relevant categories and channels and to translate this into profitable growth. Consumer Beauty is primarily focused on color cosmetics, retail hair coloring and styling products, body care and mass fragrances. Luxury is primarily focused on prestige fragrances, premium skincare and premium cosmetics. Professional Beauty is primarily focused on hair and nail care products for salon professionals.
Beauty Business, the acquisition of ghd, a premium brand in high-end hair styling appliances, the acquisition of the Brazilian personal care and beauty business of Hypermarcas S.A. known as Hypermarcas Brands. After that, Coty Inc. having joint venture with Younique LCC, leading online peer to peer social selling platform in beauty. Additional, Burberry Beauty luxury fragrances get acquiring the long-term global license.
own operation, they been reducing using energy and carbon, They have a zero waste to landfill target for all theirour owned manufacturing sites by the end of December 2018, the water use at Coty remains relatively consistent year on year when comparing FY17 and FY18 then they cover their supply chain with their own operation. Fifth, they are actively working in partnership wit hin and outside the Beauty industry to address the UN Global Compact principles collaboratively, and have joined it. That is United Nations Global Compact, AIM-Progress and SEDEX, Responsible Mica Initiative (RMI) and another alternative.
Each company will face with risk, same goes to Coty Inc. Coty Inc have been face with credit risk. That is they try to minimize exposure the credit more to public with join derivative
contracts with counterparties that have an “A” (or equivalent) credit rating. This contract of counterparties usually by financial institutions. The counterparties is bounded in the fair value of contract in net asset position can cause the exposure to credit risk. The total amount contract which $44.6 at June 2018. After that, they been face a market risk which focus to inflation risk. To date, they do not believe inflation will give affect much to their business, financial and the result of operates. However if term inflation do have affect their business in the future, they might cannot handle fully the higher cost. Their action that lead to failure handling that risk will harm their business, financial condition, results of operations, cash flows, as well as the trading price of their securities.
1.2 Problem Statement
Corporate Governance been well known long time ago and very important for each companies to apply it. This element have been tighten since big company such as Worldcam, Enron, and Lehman Brothers was fall. This companies had fallen due to lacking implying mechanism of corporate governance. According to Cadburry (2002) mention that corporate governance is a system which the companies being directed and controlled. There are many advantages to the companies to the companies that apply corporate governance but most importantly is the
company‘s reputation have been improve more. Beside that, corporate governance also help the
governance element will lead the company failure or bankruptcy. Thus, it is important to complete a research to discover how significant is the internal factor and external
(macroeconomic) factor impact the Coty Incorporated ‘s corporate governance index.
1.3 Research Objective
The purpose of this study to make research the impact of Coty Incorporated ‘s corporate governance index in relation to its determinant.
1. To investigate the internal factor towards corporate governance index of Coty Incorporated.
2. To investigate the external factor (macroeconomic) toward corporate governance index of Coty Incorporated.
3. To investigate the internal factor and external factor (macroeconomic) influence the corporate governance index of Coty Incorporated.
1.4 Research Question
1. What is the affect of internal factor to the corporate governance index of Coty Incorporated ?
2. What is the affect of external factor (macroeconomic) to the corporate governance index of Coty Incorporated ?
3. What is the affect of in internal and external (macroeconomic factor) to the corporates governance of Coty Incorporated ?
1.5 scope of Study
The sample of this study focus to cosmetic industry at United Stated that is Coty Incorporated. The financial and accounting based on Coty Incorporated annual report from year 2014-2018.
1.6 Organization of this study
company’s return of asset. Chapter three tells that the measurement of variables, research
methodology and data analysis. In chapter four, we discuss the findings and results of this study. In final chapter is discussion and conclusion of this study.
2.0 LITERATURE REVIEW
2.1 Corporate Governance
Corporate governance is the system by which companies are directed and controlled. It consists of Boards of directors and shareholder. Boards of directors are responsible for the governance of
their companies. Meanwhile, the shareholder’s role in governance is to choose the directors and
the auditors meet the satisfaction either applicable or not the governance structure been planned. The responsibilities or main of the board include are aim the company’s strategy, play role as leader to guide them, monitoring the management of the business and reporting to shareholders the framework on their stewardship. There are five main elements in Corporate Governance. That is accountability, fairness, and transparency, independence and responsibility. Implying this good corporate governance can operate the company smoothly. The firm or company that been practices of good corporate governance show the level performance more better than company that weak or fail to follow (Khatab et al, 2011). After that, according to Mazen Alomari , Mo'taz Kamel Al Zobi , Nahed Habis Alrawashdeh state that involving the management of the company, board of director , shareholder and other stakeholder in the organization can be defined as exist the concept of corporate governance. It showing the general framework that is to complete the
vulnerable organizations to liquidity because of the nature of their credit-based transactions, loans and other activities that are likely to achieve future losses.
2.2 Company Performance
2.2.1 Ratio of Asset
The asset turnover ratio is the most efficiency method to find accurate asset value. This
measurement asset value to see the company ability’s to generate sales from its asset. In other
words, this ratio shows how efficiently a company can use its assets to generate sales. This can decide based comparing net sales or revenues with average total asset. The percentage from this
calculation show how many sales are generated from each dollar of company’s asset. Net sales
can be found on the income statement of the company. The ratio that been calculated is ratio return and refund which value must break from total asset to find how the company asset capable to generate sale. Meanwhile, for average total asset been calculated by adding the beginning and ending total asset together and divide by two. The higher ratio of asset, higher of the efficiency that company manage their asset to generate asset. The formula been showed like the under table
Example for 2018 of Coty Incorporated is
-64.20/6592.5
2.2.2 Ratio of Equity
Ratio of equity indicates how much the company’ asset been paid or funded by equity shares. If the company get a lower ratio in their result showing the increase of debt that company used to pay its asset. This happen also affect to the shareholder of that company and it getting worst if the company involved a wide liquidation. The ratio, expressed as a percentage, is calculated by dividing total shareholders' equity by total assets of the firm, and it represents the amount of assets on which shareholders have a residual claim. The figures used to calculate the ratio are taken from the company balance sheet.
Ratio of equity for 2018 od Coty Incorporated
8,855.2/22,630.2
2.2.3 Credit risk
Credit Risk also known as default risk. Credit risk happen to the borrower who fails to meet their obligation in time and regarding the agree term. In simply way, the borrower who failed to make
a payment of the debt automatically been declared by lender that the borrower won’t get their
money back. Other than default risk, there are also migration risk, spread risk or concentration risk. Each of that have its own function. Migration risk mean probability mostly creditor that face unfortunately case will affect their contract. Meanwhile spread risk is market perception of increase risk on either macro or micro basis. After that concentration risk is when concentrate to investment in a particular geographical area or economic or industry sector will increase the exposure of losses. According to Stephen Zamore, Kwame Ohene Djan, Ilan Alon & Bersant Hobdari (2018), Credit Risk defines as happen when the borrower in a debt contract delay in repaying the debt either full or part of the payment.
One of the simplest way to calculating credit risk loss is the formula for expected loss which is computed as the product of the probability of default (PD), exposure at default (EAD) and one minus loss given default (LGD). In term of mathematically, it is represented as,
Expected loss = PD * EAD * (1 – LGD
There several important and benefit impact to the company. The major benefit of integrated, quantitative credit risk management is to reduce revenue losses. Monitoring well the credit risk
let’s the executive management detect which the potential client at the high risk. It will be their
strategy opportunity if the credit risk being managed well. If the company manages well the
credit risk, it will improve the company’s performance and secure the competitive advantages
2.2.4 Operational Risk
wide risk but it is remaining after determining financing and systematic risk also resulting from breakdown in internal procedures people and system if changes from industry to industry so the investor must careful to grab that chance. Industries with lower human interaction are likely to have lower operational risk.
In calculate operational risk, there are three main approaches from calculating operational risk capital requirement. First it called the basic indicator approach. In this approach, operational risk
is based on 15% of the bank’s annual gross income over the period of 3 years . it also includes
both interest and non interest income. Secondly, use standardized approach. In this approach, bank uses eight business lines with the annual gross income of the business line over the period of 3 years. The result are then added to arrive at total operational risk capital charge. Thirdly, use The Advanced measurement approach (AMA). Large banks are encouraged to move from standardized approach to AMA because with AMA, banks can reduce their capital requirement by investing in risk management infrastructure.
In financial industry, usually the occurrence of financial problem give more focus to operational risk. Even though the main reason it occur because of fraud and external events have been exist at the beginning, advance in technology also the reason possibility of operational risk increase.
The important of operating risk is owing to its ability to impact a firm’s reputation and the
2.2.5 Liquidity Risk
As for the Liquidity risk, it will be more understanding if explain the meaning of this risk first. It
is the risk that company unable to meet short term financial demands. That’s mean short term
refer to the business / individual that want to convert the money immediately, hold a valuable
asset which not trade or sell at affordable current economy’s price and market price due to lack
of buyers or inadequate market. Simply way, it happen cause of inability to convert a security /tangible asset to cash with losing a capital or income in the process. According to Mazen Alomari , Mo'taz Kamel Al Zobi , Nahed Habis Alrawashdeh state that Liquidity risk is the method that the ability of the bank to convert assets to a cash value and without losses to meet the obligations and credit requests. Its is important to pointed the Bank Strength and its ability to make sure cash or its equivalent and exchanging asset to convert into cash in short term period. Beside that, this risk main objectice is to get customer’s confidence and able to face the
bankruptcy. Liquidity is considered inconsistent with the profitability target. That’s why there
must be either risk or return that can lead bank to achieve their goal.
After that, liquidity do bring a lots of advantage or important especially to who face that risk.
First, a common model which is Approaches to Liquidity Modeling. It include Sources/Uses”
approach, where management identifies all sources of incoming cash and offsets it by all cash
outflows. Another approach, “Structure of Funds,” often augments or supports the Sources/Uses
method; this measures the change in the liquidity profile of marketable assets currently held on the balance sheet relative to assets likely to become illiquid under adverse conditions. Secondly,
Contingency Funding Plan. This funding plan is which stress testing an institution’s liquidity
position. Other than that, it defines the conditions and relative severity of market downturns, as well as the impact on sources and uses of liquidity. Thirdly, Basic Stress-Testing Principles. This principles is another way to recognize liquidity profile of the owner or company. The main key in this principles is the risk manager must maintain the data of their core depositors to detect if market rate changes. After that, the variety of period such as daily, monthly, and annual forecast. Each of it give different technique measurements. Then, assure that stress scenarios are comprehensive.
2.2.6 Market Risk
Market risk more relate to investment term. Market Risk always been faced by the investors due to fluctuation in the market. The investor experiencing a losses which happen cause by the performance in the financial market. Market risk happen when value in investment decrease because of overall performance in financial market. Market Risk can be in different situation. For example, civil unrest or political upheavals, economic sanction and natural disasters and extreme weather events. Consequently, overall performance in the financial market had been given impact by these several factor. The factors are equity risk which mean the risk that share price will change either go up or down. Secondly, commodity risk is the more to grain and metal change value dramatically. Thirdly, currency risk. This risk that possibility exchange rates going to change either will go up or down. Fourth, the interest rate risk mean risk happen from the decreasing or increasing in interest rate. Fifth, the inflation risk. High possibility that the inflation to increase the price of all good and services will undermine the value of money and probably adversely impact the value of investments.
additional rate of return over and above the risk-free rate, which the investors expect when they hold on to the risky investment. This concept is based on the CAPM model, which quantifies the relationship between risk and required return in a well-functioning market.
Cost of Equity CAPM formula = Risk-Free Rate of Return + Beta * (Market Rate of Return – Risk-free Rate of Return) here, Market Risk Premium Formula = Market Rate of Return – Risk Free Rate of Return.
The risk free rate is minimum rate investor that investor don’t involved in their investment.
Then, this risk free rate also known as theoretical interest rate which an investment paid at zero risk, and long-term yields on U.S. Treasuries have traditionally been used as a proxy for the risk-free rate because of the low default risk. The market risk premium consist of three concept which is required market risk premium, historical market risk and expected market risk return.
There are several important of Market risk. That is Setting the risk appetite and deriving the limit structure for individual task. This is highly method process that seeks to align top-down management targets with bottom-up business initiatives. After that, the risk group limit monitoring of control function. meanwhile Limit breaches are typically addressed directly or brought to joint
decision-making bodies bodies (for example, teams from risk and trading). Other than that, risk group or front office or associated operation unit manage the market data. Then, the Pricing
models and valuations will be stronger and more reflective of the business’s activities also the
3.0 METHODOLOGY
3.1 Introduction
Research methodology known as the way or method how we obtained the knowledge or material. For example in teaching or for carrying out research. Research methodology also defined as the approach used in the research to collect the data (Cohen and Manion, 1996). Other than that, It is also defined by Leedy and Ormrod (2001) as the general approach the researcher takes in carrying out the research project. By the end of this study, we will receive the perfect result from data of the company we been research for and can fulfill our main objective of this research. This study been conduct to know the influences of Coty Incorporation company performance and operational risk in cosmetic industry. The method that we used to collect data is Statistical Package for the Social Science (SPSS) version 25
3.2 Population/ Sampling
The unit of analysis is the major entity that is being analyzed in a study. For example, individuals, groups, and artifacts could be a unit of analysis in a study. In this study, organizations will be the unit of analysis. The population in this study is the company in the cosmetic industry sector in United State (US). From this population, one company where chosen
as sample which is Coty Incorporation. In order to research this company’s performance., data from the annual reports company is from the year 2014 until 2018 is used to measure the dependent variables (operational risk) and the independent variables (firm performance factors and macroeconomic factors).
3.3 Statistical Technique
3.4 Data Analysis
SPSS is the acronym of Statistical Package for the Social Science. SPSS is software package used in statistical analysis of data. It was developed by SPSS Inc. and acquired by IBM in 2009. SPSS is one of the most popular statistical packages which can perform highly complex data manipulation and analysis with simple instructions. According to Landau & Everitt,(2004) It is designed for both interactive and non-interactive (batch) uses. SPSS is a comprehensive system that help researcher in conducting a statistical for analyzing data. In 2014, SPSS was renamed and known as IBM SPSS Statistic after being acquired by IBM in 2009. I use to collect the data of this company in name of IBM SPSS Statistic version 25. The data framework consist of :
Internal Factor
External Factor
Internal and external Factor
Independent Variable
Return on Asset
(ROA)
4.0 FINDING AND ANALYSIS
4.1 Introduction
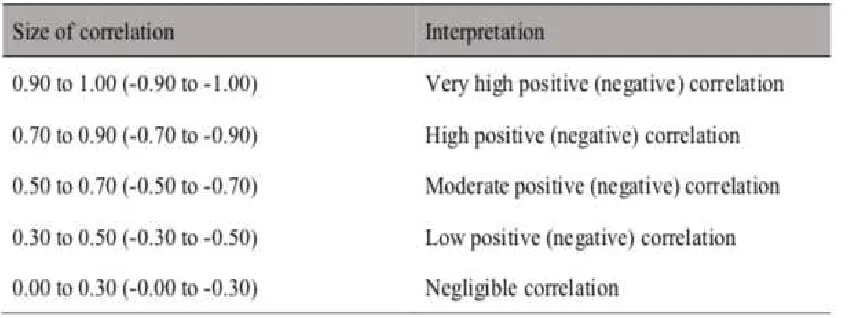
[image:17.612.73.500.288.447.2]In this chapter, table 4.1 show the correlation benchmark use as refer to which present the data that determine for correlation between dependent variable which is ROA and independence variable consist of current ratio, quick ratio, average collection period (ACP), Debt to income, operational ratio, operation margin, GDP, inflation, interest rate, exchange rate, STDV and Corporate Governance Index (CGI). The table below show to determine between the relationship variables.
4.2 Descriptive Statistic
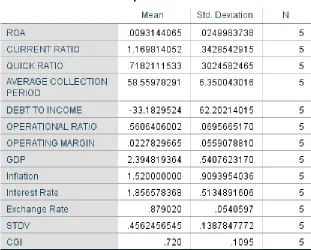
Table 4.1 show us the relationship between mean and standard deviation. It show mean and standard deviation for the dependent variable which internal control ROA, Corporate Governance Index (CGI), current ratio, quick ratio, average collection period, debt to income, operational ratio, operating margin), meanwhile external control that is GDP, inflation, interest rate exchange rate and standard deviation. From the table, as can see ROA is on average is 0.0093 with low standard variation is 0.2499. This indicate that the company’s income and asset can be easily predicted because can expected what the outcome value for the upcoming. Besides that, same apply to another internal which is operational margin with average 0.0227 and the standard deviation is 0.5590 showing their value can be expected from 2014-2018. After that, for Corporate Governance Index (CGI) on average is 0.720 with low standard deviation is 0.1095. This company have a good CGI within year 2014 until 2018. Meanwhile, for external control, GDP show that the standard deviation higher that is 0.5407 with the average is 2.394. This indicate that the value within these five years is unpredictable same to be apply to upcoming year because the value get spread in a wider range.
Table 4.1
[image:18.612.80.391.116.366.2]4.3 Trend Analysis
4.3.1 Return on Asset of Coty Incorporated from year 2014-2018
Graph 1.0 indicate the performance of Coty Inc during year from 2014 until 2018. Return of asset showing this company apply or using their asset well. The performance can relatable with
their corporate governance Index (CGI) which give a good result during these 5 years. It’s mean
this company apply well the corporate governance mechanism. Year 2014 until 2015 showing this company return of asset increase rapidly which -0.97% to 4.31%. It give a good performance to Coty Inc because the drastically changes form negative to positive. Positive at net income will give this company earn more money on their less investment or spending. It showing how efficiency Coty Inc using their asset to generate company business. Even so, this company did experience a drastically negative on their return on asset in year 2017 which is -1.77%. This might due because the company not too productive because still using the old one and not try to make innovation to create new one. Other than that, this company might experience wastage of either their product, raw material and labor hour.
2014 2015 2016 2017 2018 -0.0300 -0.0200 -0.0100 0.0000 0.0100 0.0200 0.0300 0.0400 0.0500
1 2 3 4 5
ROA
ROA
Graph 1.0 : Return of
4.3.2 Operating Margin of Coty Incorporated from year 2014-2018
Based on graph above, the operating margin of Coty Inc have been arise during year 2014 which is 0.56% and 2015 is 8.99%. This profit percentage have been arised by 8.42 %. This showing this company able to make profitable from their operations. Unfortunately the performance ratio of the operation profitable have been declined in year 2016 which is 5.84% and then the rapidly declined of profit keep continue by 11.57% until 2018 which is -5.72%. Generally, this usually happen when the sale been declined and the profit increase. However, in this case this company showing the increase of sales but they suffer a higher profit decrease. The company might want more focus to additional expenses as well unexpected increase their expenses cost with the demand of customer and prices increase. This cannot deny that can give the higher risk to the company. After that, the company have been maintain their operating margin again in 2018 with increase to 1.72%. It mean this indicate that the company business turns a higher profit margin on its revenues.
2014 2015 2016 2017 2018 -0.08000 -0.06000 -0.04000 -0.02000 0.00000 0.02000 0.04000 0.06000 0.08000 0.10000
1 2 3 4 5
OPERATING MARGIN
OPERATING MARGIN
Graph 2.0 : Operating
4.3.3 Average Collection Period of Coty Incorporated from year 2014-2018
Based on graph above, the average collection period of Coty Inc showing how much longer or shorter they collect their its receivable. Start from 2014 until 2016 showing the duration of collect its receivable nearest the same which 52.58, 55.66, and 56.53 respectively. It imply that their period to collect the receivable not quite bad and its reasonable for the company to pay the debt fully. However, in year 2017 this company showing rapidly increase of the period collection which is take 69.19 days. It is not surprising since their ROA which the net income give sign of negative impact. This might due because the company might spend more expenses rather than its revenue. To make it simply, the average for this company collect its receivable among 5 years is volatile which can easily predictable for incoming year.
2014
2015
2016
2017
2018
0.00 10.00 20.00 30.00 40.00 50.00 60.00 70.00 80.00
1 2 3 4 5
AVERAGE COLLECTION
PERIOD
AVERAGE COLLECTION PERIOD
4.4 Correlation
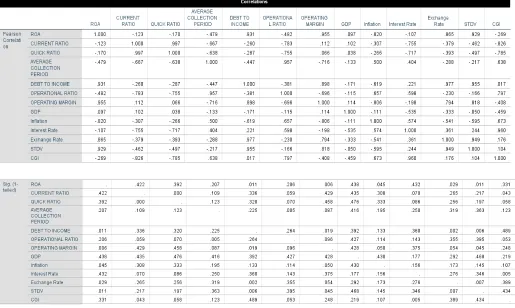
[image:22.612.73.588.106.414.2]On this internal and external model which refer to the table 4.4, it stated the movement of the significant. It refer from year 2014-2018 of Coty Incorporated. It show Coty Incorporated’s independent variable which is Operating Margin (OM) significant correlated to ROA. There is positive significant correlated between ROA and OM that is p value <0.005. This shows that when operating margin or expenses before interest and tax (EBIT) or revenue as a result it increase profit of the company. The remaining of independent variable which are current ratio, quick ratio debt to income, operational ratio, GDP, inflation, interest rate, exchange rate, standard deviation and Corporate Governance Index (CGI) are not significant correlated to ROA.
4.5 Model Summary
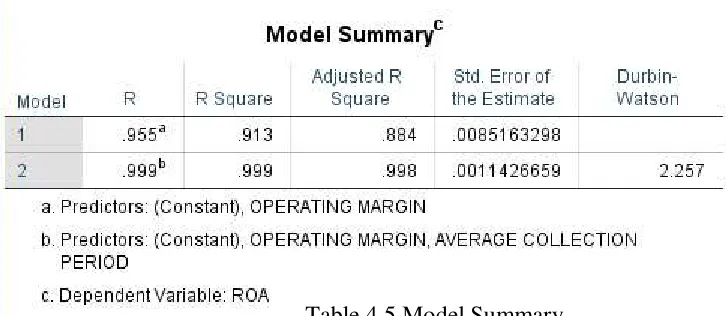
[image:23.612.74.437.104.262.2]According to model summary above, the adjusted R-Square is equal to 99.8%. this implies that Coty Inc Independent variable which is Operating margin and Average Collection Period able to explain the 99.8 performance of corporate governance performance of the company. Meanwhile the remaining 0.2 of the adjusted remain unknown. Others internal factor such as current ratio, quick ratio, operational ratio, also the external factor like GDP, inflation, interest rate, exchange rate, standard deviation and Corporate Governance Index (CGI) are unable to explain it. After that, Durbin Watson is to measure autocorrelation of the data. If the percentage more than 3 mean there is autocorrelation in data. In this study, the Durbin Watson for this company data is not autocorrelation.
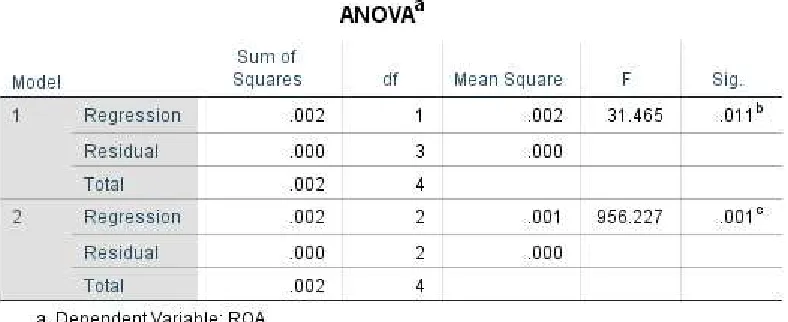
4.6 Anova
Table 4.6 Anova
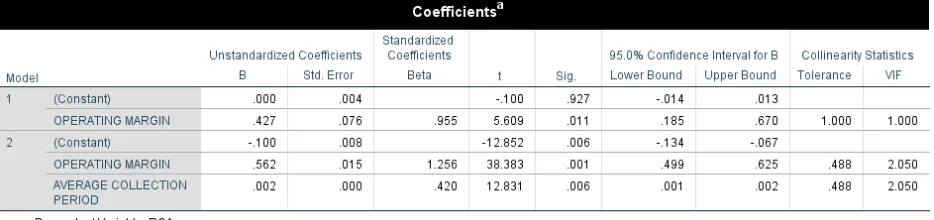
4.7 Coefficient
Table 4.7.1: Coefficient
Analysis on the coefficient table shows how does the independent variable (Operating Margin and Average Collection Period) has influence on the Return on Asset (ROA) the dependent variable. The study shows that when the independent variable has p value <0.001, it indicate that the independent variable has most affect or influence the dependent variable. Then if the p value <0.05 , it show that the independent variable has only moderate influence on the dependent variable. Next independent variable will totally loss influence or become insignificant to the dependent variables when p value <0.10 .
On this internal and external model which refer to the table 4.6, it stated the influence of the
significant. Based on the table 4.6, Coty Incorporated’s independent variable which is Operating
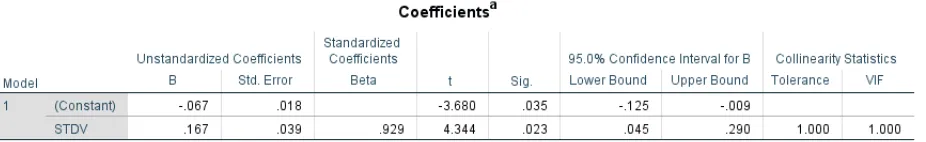
Table 4.7.2 : Coefficient
For external factor or model 2, the significant of coefficient is different from internal model. The independent variable that significant to ROA is standard deviation. Based on the table, standard variation has medium influence on the dependent variable with p value is <0.05 and t= 4.344. this study show that when increase the standard deviation will increase the profit as well. When profit increase, the share price in this case show volatility.
4.8 Equation
Model (1) known as internal factor
ROA= β0 + β1CR + β2QR + β3ACP + β4DTI + β5OR + β6OM+ e
Model (2) known as external factor
ROA= β0 + β1GDP + β2INFLA + β3i + β4EXCGR + β5STDV + β6CGI + e
Model (3) = combine of internal and external factor
ROA= β0 + β1CR + β2QR + β3ACP + β4DTI + β5OR + β6OM +
5.0 CONCLUSION
5.1 Introduction
The purpose of this study been conduct is to determinant relation of Coty Incorporated relationship with its determinants. To accomplish the objective of this study, the internal factor consist of current ratio, quick ratio, average collection period (ACP), debt to income, operating margin, corporate governance index (CGI) meanwhile the external which macroeconomic factor consist of GDP, inflation, interest rate, exchange rate, and standard deviation been used to run in
this company’s business. This chapter will elaborates regarding findings from previous chapter, limitation that been through and what can conclude from this study,
5.2 Discussion
The study purpose to determine the impact of corporate governance index of Coty Incorporated in relation to its determinant. A study has been conducted to accomplish the objectives below:
1. To investigate the internal factors toward corporate governance index of Coty incorporated.
2. To investigate the external factors toward corporate governance index of Coty incorporated.
3. To investigate the internal and external (macroeconomic) factors influence the corporate governance index of Coty Incorporated.
For this study, table 4.3 shows us the proof that return of asset (ROA) is influenced by the Operating Margin (one of the internal factors). From the table also we can identify that Operating Margin positively significant correlated to the CGI with p value <0.005 (0.006). This study also shows that the operating margin or revenue increase, the return of asset (ROA) also increase. After that, from the table 4.6 we can see that the Return of Asset (ROA) of Coty Incorporated are also influenced by the Operating Margin with p value <0.001 ( 0.001) and t = 38.383. Beside Operating Margin, there is additional internal factor which is Average Collection Period (ACP) also influence the return on asset (ROA) with p value <0.001 (0.006) and t = 12.831.
factor such as GDP. Inflation, interest rate, exchange rate, standard deviation was found was insignificant or just play a small role in influence and give impact to Coty Incorporated. For overall this study, we can conclude that these three independent variable play a main role to
make Coty Incorporated’s performance more better.
5.3 Limitation
The limitation that clearly identify when conduct this study only focus to one company only within five years. Hence, the data and information only limit for only specific these five years.
5.4 Conclusion
Based on the finding of this study, Operating margin, Average Collection period and standard deviation from external factor has a positively significant relationship with Return of Asset (ROA) of Coty Incorporated. These three independent variable give a positively significant to Return of Asset but we would find the most significant between these three which have most influence to the dependent variable that is Return of Asset (ROA). Operating Margin
significantly to ROA with p value <0.001 (0.001) meanwhile Average Standard Period (ACP) ‘s p value is <0.001 (0.006) and standard deviation’s p value is <0.05 (0.023). From this research,
Operating Margin give the most significant among these three independent variable and have strong influence to Return of Asset which p value accurate <0.001 (0.001). Every changes in Return on Asset will influence Operating Margin. Moreover, the increasing profit of this company will lead to increase the earning before interest and tax by increasing of the revenue. When Coty Incorporated have achieved a stable Operating Margin, it will help the company gain trust of their shareholders, protect the shareholder rights and at the same time can attract more new shareholders to invest in the company.
ACKNOWLEDGEMENT
REFERENCE
1) Olivia Labarre, (2019,May,24), Credit Risk, Important of credit risk, (2019,March,22) 2) Stephen Zamore, Kwame Ohene Djan, Ilan Alon & Bersant Hobdari (2018): Credit Risk
Research: Review and Agenda, Emerging Markets Finance and Trade, retrieved from DOI:10.1080/1540496X.2018.1433658
3) Operational Risks: Definition & Examples, Approaches of Operational Risk, retrieved from David R. Harper, (2019 Sept 18)
4) Alomari, Mazen & Mo'taz, Kamel & Alrawashedh, Nahed. (2018). The Impact of Corporate Governance and Ownership Structure on the Liquidity Risk in Jordanian Commercial Banks. 43.
5) Tyler Dunn, (2018 March 20), Why is Strong Liquidity Risk Management so Important? 6) James Chen, (2019 August 19), Market Risk .
7) McKinsey, (Amy, 2012) , Managing market risk: Today and tomorrow. 8) Statistical Package for the Social Sciences (SPSS), (n.d.).
9) Ratio of asset, (2019 November 16). Financial Analysis