Robust Co-occurrence Quantification for Lexical Distributional Semantics
Dmitrijs Milajevs Mehrnoosh Sadrzadeh Matthew Purver
Queen Mary University of London London, UK
{d.milajevs,m.sadrzadeh,m.purver}@qmul.ac.uk
Abstract
Previous optimisations of parameters af-fecting the word-context association mea-sure used in distributional vector space models have focused either on high-dimensional vectors with hundreds of thousands of dimensions, or dense vectors with dimensionality of a few hundreds; but dimensionality of a few thousands is of-ten applied in compositional tasks as it is still computationally feasible and does not require the dimensionality reduction step. We present a systematic study of the in-teraction of the parameters of the associ-ation measure and vector dimensionality, and derive parameter selection heuristics that achieve performance across word sim-ilarity and relevance datasets competitive with the results previously reported in the literature achieved by highly dimensional or dense models.
1 Introduction
Words that occur in similar context have simi-lar meaning (Harris, 1954). Thus the meaning of a word can be modeled by counting its co-occurrence with neighboring words in a corpus. Distributional models of meaning represent co-occurrence information in a vector space, where the dimensions are the neighboring words and the values are co-occurrence counts. Successful mod-els need to be able to discriminate co-occurrence information, as not all co-occurrence counts are equally useful, for instance, the co-occurrence
with the article the is less informative than with
the nounexistence. The discrimination is usually
achieved by weighting of co-occurrence counts. Another fundamental question in vector space de-sign is the vector space dimensionality and what
neighbor words should correspond to them. Levy et al. (2015) propose optimisations for co-occurrence-based distributional models, us-ing parameters adopted from predictive
mod-els (Mikolov et al., 2013): shifting and context
distribution smoothing. Their experiments and thus their parameter recommendations use high-dimensional vector spaces with word vector
di-mensionality of almost 200K, and many recent
state-of-the-art results in lexical distributional se-mantics have been obtained using vectors with similarly high dimensionality (Baroni et al., 2014; Kiela and Clark, 2014; Lapesa and Evert, 2014).
In contrast, much work on compositional
dis-tributional semantics employs vectors with much
fewer dimensions: e.g. 2K (Grefenstette and
Sadrzadeh, 2011; Kartsaklis and Sadrzadeh, 2014;
Milajevs et al., 2014),3K(Dinu and Lapata, 2010;
Milajevs and Purver, 2014) or10K(Polajnar and
Clark, 2014; Baroni and Zamparelli, 2010). The most common reason thereof is that these models assign tensors to functional words. For a vector
spaceV withkdimensions, a tensorV⊗V · · ·⊗V
of ranknhaskn dimensions. Adjectives and
in-transitive verbs have tensors of rank 2, in-transitive verbs are of rank 3; for coordinators, the rank can
go up to 7. Takingk = 200K already results in
a highly intractable tensor of8×1015dimensions
for a transitive verb.
An alternative way of obtaining a vector space with few dimensions, usually with just 100–500, is the use of SVD as a part of Latent Semantic Analysis (Dumais, 2004) or another models such as SGNS (Mikolov et al., 2013) and GloVe (Pen-nington et al., 2014). However, these models take more time to instantiate in comparison to weight-ing of a co-occurrence matrix, brweight-ing more param-eters to explore and produce vector spaces with uninterpretable dimensions (vector space dimen-sion interpretation is used by some lexical
els, for example, McGregor et al. (2015), and the passage from formal semantics to tensor models relies on it (Coecke et al., 2010)). In this work we focus on vector spaces that directly weight a co-occurrence matrix and report results for SVD, GloVe and SGNS from the study of Levy et al. (2015) for comparison.
The mismatch of recent experiments with non-dense models in vector dimensionality between lexical and compositional tasks gives rise to a number of questions:
• To what extent does model performance
de-pend on vector dimensionality?
• Do parameters influence 200K and 1K
di-mensional models similarly? Can the find-ings of Levy et al. (2015) be directly applied to models with a few thousand dimensions?
• If not, can we derive suitable parameter
se-lection heuristics which take account of di-mensionality?
To answer these questions, we perform a sys-tematic study of distributional models with a rich set of parameters on SimLex-999 (Hill et al.,
2014), a lexicalsimilairtydataset, and test selected
models on MEN (Bruni et al., 2014), a lexical
relatedness dataset. These datasets are currently widely used and surpass datasets stemming from information retrieval, WordSim-353 (Finkelstein et al., 2002), and computational linguistics, RG65 (Rubenstein and Goodenough, 1965), in quantity by having more entries and in quality by atten-tion to evaluated relaatten-tions (Milajevs and Griffiths, 2016).
2 Parameters
2.1 PMI variants (discr)
Most co-occurrence weighting schemes in
distri-butional semantics are based on point-wise
mu-tual information(PMI, see e.g. Church and Hanks (1990), Turney and Pantel (2010), Levy and Gold-berg (2014)):
PMI(x, y) = logPP(x(x, y)P()y) (1)
As commonly done, we replace the infinite PMI
values,1 which arise whenP(x, y) = 0, with
ze-roes and use PMI hereafter to refer to a weighting with this fix.
1We assume that the probability of a single token is al-ways greater than zero as it appears in the corpus at least once.
Parameter Values
DimensionalityD 1K, 2K, 3K, 5K10K, 20K, 30K, 40K, 50K
discr PMI, CPMI, SPMI, SCPMI
freq 1,n,logn
neg 0.2, 0.5, 0.7, 1, 1.4, 2, 5, 7
[image:2.595.319.513.63.154.2]cds global, 1, 0.75 Similarity Cosine, Correlation
Table 1:Model parameters and their values.
An alternative solution is to increment the
prob-ability ratio by 1; we refer to this as compressed
PMI(CPMI, see e.g. McGregor et al. (2015)):
CPMI(x, y) = log(1 +PP(x(x, y)P()y)) (2)
By incrementing the probability ratio by one,
the PMI values from the segment of (−∞; 0],
when the joint probabilityP(x, y)is less than the
chance P(x)P(y), are compressed into the
seg-ment of (0; 1]. As the result, the space does not
contain negative values, but has the same sparsity as the space with PMI values.
2.2 Shifted PMI (neg)
Many approaches use only positive PMI values,
as negative PMI values may not positively con-tribute to model performance and sparser matrices are more computationally tractable (Turney and Pantel, 2010). This can be generalised to an
ad-ditional cutoff parameterk(neg) following Levy
et al. (2015), giving our third PMI variant
(abbre-viated as SPMI):2
SPMIk= max(0,PMI(x, y)−logk) (3)
Whenk = 1SPMI is equivalent to positive PMI.
k > 1 increases the underlying matrix sparsity by keeping only highly associated co-occurrence
pairs. k < 1 decreases the underlying
ma-trix sparsity by including some unassociated co-occurrence pairs, which are usually excluded due to unreliability of probability estimates (Dagan et al., 1993).
We can apply the same idea to CPMI:
SCPMIk= max(0,CPMI(x, y)−log 2k) (4)
2SPMI is different from CPMI becauselog P(x,y)
P(x)P(y) −
logk= log P(x,y)
P(x)(P(y)k ̸= log
(
1 + P(x,y)
P(x)P(y)
)
−0.05 0.00 0.05 0.10 0.15 0.20 0.25 0.30 0.35 0.40
SimLex999
freq = 1 | discr = pmi freq = 1 | discr = cpmi freq = 1 | discr = spmi freq = 1 | discr = scpmi
−0.05 0.00 0.05 0.10 0.15 0.20 0.25 0.30 0.35 0.40
SimLex999
freq = n | discr = pmi freq = n | discr = cpmi freq = n | discr = spmi freq = n | discr = scpmi
1000 2000 3000 5000 10000 20000 30000 40000 50000 dimensionality
−0.05 0.00 0.05 0.10 0.15 0.20 0.25 0.30 0.35 0.40
SimLex999
freq = logn | discr = pmi
1000 2000 3000 5000 10000 20000 30000 40000 50000 dimensionality
freq = logn | discr = cpmi
1000 2000 3000 5000 10000 20000 30000 40000 50000 dimensionality
freq = logn | discr = spmi
1000 2000 3000 5000 10000 20000 30000 40000 50000 dimensionality
freq = logn | discr = scpmi
cds
[image:3.595.42.549.65.287.2]global 1 0.75
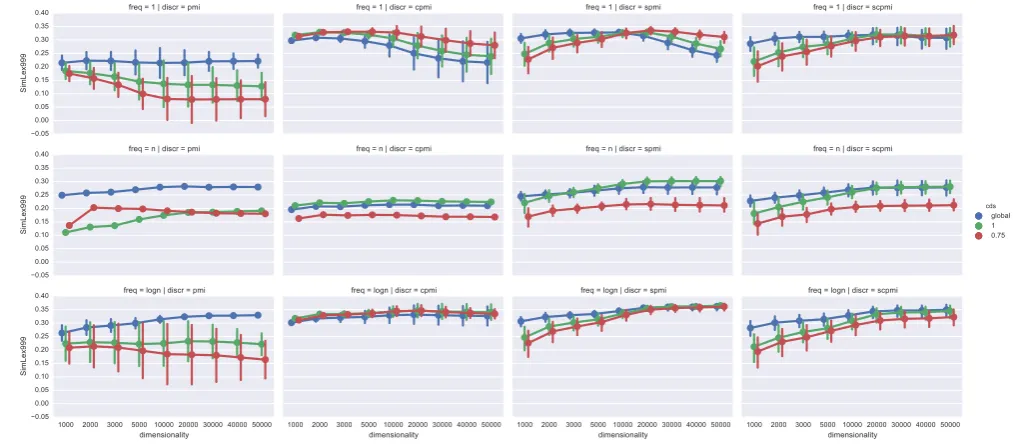
Figure 1: Effect of PMI variant (discr), smoothing (cds) and frequency weighting (freq) on
SimLex-999.Error bars correspond to a 95% confidence interval as the value is estimated by averaging
over all the values of the omitted parameters:negand similarity.
2.3 Frequency weighting (freq)
Another issue with PMI is its bias towards rare events (Levy et al., 2015); one way of solving this issue is to weight the value by the co-occurrence frequency (Evert, 2005):
LMI(x, y) =n(x, y) PMI(x, y) (5)
wheren(x, y)is the number of timesx was seen
together withy. For clarity, we refer ton-weighted
PMIs asnPMI,nSPMI, etc. When this weighting
component is set to 1, it has no effect; we can
ex-plicitly label it as1PMI,1SPMI, etc.
In addition to the extreme1 andnweightings,
we also experiment with alognweighting.
2.4 Context distribution smoothing (cds)
Levy et al. (2015) show that performance is
af-fected by smoothing the context distributionP(x):
Pα(x) = n(x) α
∑
cn(c)α (6)
We experiment with α = 1 (no smoothing) and
α = 0.75. We call this estimation method local
context probability; we can also estimate aglobal context probabilitybased on the size of the corpus
C:
P(x) = n|(Cx|) (7)
2.5 Vector dimensionality (D)
As context words we select the 1K, 2K, 3K, 5K, 10K, 20K, 30K, 40K and 50K most frequent lem-matised nouns, verbs, adjectives and adverbs. All context words are part of speech tagged, but we do not distinguish between refined word types (e.g. intransitive vs. transitive versions of verbs) and do not perform stop word filtering.
3 Experimental setup
Table 1 lists parameters and their values. As the source corpus we use the concatenation of Wack-ypedia and ukWaC (Baroni et al., 2009) with a symmetric 5-word window (Milajevs et al., 2014); our evaluation metric is the correlation with hu-man judgements as is standard with SimLex (Hill et al., 2014). We derive our parameter selection
heuristics by greedily selecting parameters (cds,
neg) that lead to the highest average performance
for each combination of frequency weighting, PMI
variant and dimensionality D. Figures 1 and 2
show the interaction of cds andneg with other
parameters. We also vary the similarity measure (cosine and correlation (Kiela and Clark, 2014)),
but do not report results here due to space limits.3
3The results are available at http://www.eecs.
−0.1 0.0 0.1 0.2 0.3 0.4 0.5
SimLex999
discr = spmi | freq = 1 discr = spmi | freq = n discr = spmi | freq = logn
1000 2000 3000 5000 10000 20000 30000 40000 50000
dimensionality
−0.1 0.0 0.1 0.2 0.3 0.4 0.5
SimLex999
discr = scpmi | freq = 1
1000 2000 3000 5000 10000 20000 30000 40000 50000
dimensionality discr = scpmi | freq = n
1000 2000 3000 5000 10000 20000 30000 40000 50000
dimensionality discr = scpmi | freq = logn
[image:4.595.48.548.67.261.2]neg 0.2 0.5 0.7 1 1.4 2 5 7
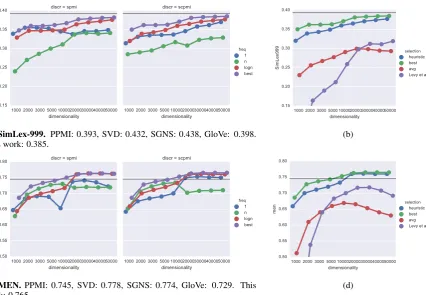
Figure 2: The behaviour of shifted PMI (SPMI) on SimLex-999. discr=spmi, freq=1 and
neg=1 corresponds to positive PMI. Error bars correspond to a 95% confidence interval as the value
is estimated by averaging over all the values of the omitted parameters:cdsand similarity.
4 Heuristics
PMI and CPMI PMI should be used with global context probabilities. CPMI generally out-performs PMI, with less sensitivity to parameters;
nCPMI andlognCPMI should be used with
lo-cal context probabilities and1CPMIshould apply
context distribution smoothing withα= 0.75.
SPMI 10K dimensional1SPMIis the least
sen-sitive to parameter selection. For models with
D > 20K, context distribution smoothing should
be used withα = 0.75; forD <20K, it is
ben-eficial to use global context probabilities. Shift-ing also depends on the dimensionality: models with D < 20K should set k = 0.7, but
higher-dimensional models should set k = 5. There
might be a finer-grainedkselection criteria;
how-ever, we do not report this to avoid overfitting.
lognSPMI should be used with global
con-text probabilities for models withD <20K. For
higher-dimensional spaces, smoothing should be
applied withα = 0.75, as with1SPMI. Shifting
should be applied withk = 0.5 for models with
D <20K, andk= 1.4forD >20K. In contrast to1SPMI, which might require change ofkas the
dimensionality increases,k= 1.4is a much more
robust choice forlognSPMI.
nSPMI gives good results with local context
probabilities (α = 1). Models with D < 20K
should usek= 1.4, otherwisek= 5is preferred.
SCPMI With 1SCPMI and D < 20K, global context probability should be used, with shifting
set tok= 0.7. Otherwise, local context
probabil-ity should be used withα= 0.75andk= 2.
With nSCPMI and D < 20K, global context
probability should be used withk = 1.4.
Other-wise, local context probability without smoothing
andk= 5is suggested.
For lognSCPMI, models with D < 20K
should use global context probabilities and k =
0.7; otherwise, local context probabilities without
smoothing should be preferred withk= 1.4.
5 Evaluation of heuristics
We evaluate these heuristics by comparing the per-formance they give on SimLex-999 against that obtained using the best possible parameter selec-tions (determined via an exhaustive search at each dimensionality setting). We also compare them to the best scores reported by Levy et al. (2015) for their model (PMI and SVD), word2vec-SGNS (Mikolov et al., 2013) and GloVe (Pennington et al., 2014)—see Figure 3a, where only the better-performing SPMI and SCPMI are shown.
For lognPMI and lognCPMI, our heuristics
pick the best possible models. For lognSPMI,
where performance variance is low, the heuris-tics do well, giving a performance of no more than 0.01 points below the best configuration. For
1SPMIandnSPMIthe difference is higher. With
1000 2000 3000 5000 1000020000300004000050000
dimensionality
0.15 0.20 0.25 0.30 0.35 0.40
SimLex999
discr = spmi
1000 2000 3000 5000 1000020000300004000050000
dimensionality discr = scpmi
freq 1 n logn best
(a)SimLex-999. PPMI: 0.393, SVD: 0.432, SGNS: 0.438, GloVe: 0.398. This work: 0.385.
1000 2000 3000 5000 1000020000300004000050000 dimensionality
0.15 0.20 0.25 0.30 0.35 0.40
SimLex999
selection heuristic best avg Levy et al.
(b)
1000 2000 3000 5000 1000020000300004000050000
dimensionality
0.50 0.55 0.60 0.65 0.70 0.75 0.80
men
discr = spmi
1000 2000 3000 5000 1000020000300004000050000
dimensionality discr = scpmi
freq 1 n logn best
(c)MEN.PPMI: 0.745, SVD: 0.778, SGNS: 0.774, GloVe: 0.729. This work: 0.765.
1000 2000 3000 5000 1000020000300004000050000 dimensionality
0.50 0.55 0.60 0.65 0.70 0.75 0.80
men
selection heuristic best avg Levy et al.
[image:5.595.90.517.63.358.2](d)
Figure 3:Best configurations.The black lines show the best count models (PPMI) reported by Levy et al. (2015). We also
give our best score, SVD, SGNS and GloVe numbers from that study for comparison. On the right, our heuristic in comparison to the best and average results together with the models selected using the recommendations presented in Levy et al. (2015).
the best selection, but with a wider gap than the
SPMI models. In generaln-weighted models do
not perform as well as others.
Overall, logn weighting should be used with
PMI, CPMI and SCPMI. High-dimensional SPMI
models show the same behaviour, but if D <
10K, no weighting should be applied. SPMI and SCPMI should be preferred over CPMI and PMI. As Figure 3b shows, our heuristics give perfor-mance close to the optimum for any dimensional-ity, with a large improvement over both an average parameter setting and the parameters suggested by
Levy et al. (2015) in a high-dimensional setting.4
Finally, to see whether the heuristics transfer robustly, we repeat this comparison on the MEN dataset (see Figures 3c, 3d). Again, PMI and CPMI follow the best possible setup, with SPMI and SCPMI showing only a slight drop below ideal performance; and again, the heuristic settings give performance close to the optimum, and signifi-cantly higher than average or standard parameters.
4Our results using Levy et al. (2015)’s parameters differ slightly from theirs due to different window sizes (5 vs 2).
6 Conclusion
This paper presents a systematic study of co-occurrence quantification focusing on the se-lection of parameters presented in Levy et al. (2015). We replicate their recommendation for high-dimensional vector spaces, and show that with appropriate parameter selection it is possible to achieve comparable performance with spaces of dimensionality of 1K to 50K, and propose a set of model selection heuristics that maximizes perfor-mance. We foresee the results of the paper are gen-eralisable to other experiments, since model se-lection was performed on a similarity dataset, and was additionally tested on a relatedness dataset.
In general, model performance depends on vec-tor dimensionality (the best setup with 50K sions is better than the best setup with 1K dimen-sions by 0.03 on SimLex-999). Spaces with a few thousand dimensions benefit from being dense and
unsmoothed (k < 1, global context probability);
while high-dimensional spaces are better sparse
and smooth (k > 1,α = 0.75). However, for
un-weighted andn-weighted models, these heuristics
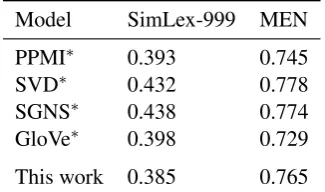
Model SimLex-999 MEN
PPMI∗ 0.393 0.745
SVD∗ 0.432 0.778
SGNS∗ 0.438 0.774
GloVe∗ 0.398 0.729
[image:6.595.100.263.63.159.2]This work 0.385 0.765
Table 2: Our model in comparison to the
pre-vious work. On the similarity dataset our model is 0.008 points behind a PPMI model, however on the relatedness dataset 0.020 points above. Note the difference in dimensionality, source corpora and window size. SVD, SGNS and GloVe
num-bers are given for comparison. ∗Results reported
by Levy et al. (2015).
of the high variance of the corresponding scores.
Based on this we suggest to use lognSPMI or
lognSCPMI with dimensionality of at least 20K to ensure good performance on lexical tasks.
There are several directions for the future work. Our experiments show that models with a few thousand dimensions are competitive with more dimensional models, see Figure 3. Moreover, for these models, unsmoothed probabilities give the best result. It might be the case that due to the large size of the corpus used, the probability es-timates for the most frequent words are reliable without smoothing. More experiments need to be done to see whether this holds for smaller corpora. The similarity datasets are transferred to other languages (Leviant and Reichart, 2015). The fu-ture work might investigate whether our results hold for languages other than English.
The qualitative influence of the parameters should be studied in depth with extensive error analysis on how parameter selection changes sim-ilarity judgements.
Acknowledgements
We thank Ann Copestake for her valuable com-ments as part of the ACL SRW mentorship pro-gram and the anonymous reviewers for their com-ments. Support from EPSRC grant EP/J002607/1 is gratefully acknowledged by Dmitrijs Mila-jevs and Mehrnoosh Sadrzadeh. Matthew Purver is partly supported by ConCreTe: the project ConCreTe acknowledges the financial support of the Future and Emerging Technologies (FET) programme within the Seventh Framework
Pro-gramme for Research of the European Commis-sion, under FET grant number 611733.
References
Marco Baroni and Roberto Zamparelli. 2010. Nouns are vectors, adjectives are matrices: Representing adjective-noun constructions in semantic space. In Proceedings of the 2010 Conference on Empirical Methods in Natural Language Processing, EMNLP ’10, pages 1183–1193, Stroudsburg, PA, USA. As-sociation for Computational Linguistics.
Marco Baroni, Silvia Bernardini, Adriano Ferraresi, and Eros Zanchetta. 2009. The wacky wide web: a collection of very large linguistically processed web-crawled corpora. Language Resources and Evaluation, 43(3):209–226.
Marco Baroni, Georgiana Dinu, and Germ´an Kruszewski. 2014. Don’t count, predict! a systematic comparison of context-counting vs. context-predicting semantic vectors. InProceedings of the 52nd Annual Meeting of the Association for Computational Linguistics (Volume 1: Long Papers), pages 238–247, Baltimore, Maryland, June. Association for Computational Linguistics.
Elia Bruni, Nam Khanh Tran, and Marco Baroni. 2014. Multimodal distributional semantics. J. Artif. Int. Res., 49(1):1–47, January.
Kenneth Ward Church and Patrick Hanks. 1990. Word association norms mutual information, and lexicog-raphy.Computational Linguistics, 16(1):22–29.
Bob Coecke, Mehrnoosh Sadrzadeh, and Stephen Clark. 2010. Mathematical foundations for a com-positional distributional model of meaning. CoRR, abs/1003.4394.
Ido Dagan, Shaul Marcus, and Shaul Markovitch. 1993. Contextual word similarity and estimation from sparse data. In Proceedings of the 31st An-nual Meeting on Association for Computational Lin-guistics, ACL ’93, pages 164–171, Stroudsburg, PA, USA. Association for Computational Linguistics.
Georgiana Dinu and Mirella Lapata. 2010. Measuring distributional similarity in context. InProceedings of the 2010 Conference on Empirical Methods in Natural Language Processing, EMNLP ’10, pages 1162–1172, Stroudsburg, PA, USA. Association for Computational Linguistics.
Susan T. Dumais. 2004. Latent semantic analysis. An-nual Review of Information Science and Technology, 38(1):188–230.
Lev Finkelstein, Evgeniy Gabrilovich, Yossi Matias, Ehud Rivlin, Zach Solan, Gadi Wolfman, and Ey-tan Ruppin. 2002. Placing search in context: The concept revisited. ACM Trans. Inf. Syst., 20(1):116– 131, January.
Edward Grefenstette and Mehrnoosh Sadrzadeh. 2011. Experimental support for a categorical composi-tional distribucomposi-tional model of meaning. In Proceed-ings of the Conference on Empirical Methods in Natural Language Processing, EMNLP ’11, pages 1394–1404, Stroudsburg, PA, USA. Association for Computational Linguistics.
Z.S. Harris. 1954. Distributional structure.Word. Felix Hill, Roi Reichart, and Anna Korhonen. 2014.
Simlex-999: Evaluating semantic models with (genuine) similarity estimation. arXiv preprint arXiv:1408.3456.
Dimitri Kartsaklis and Mehrnoosh Sadrzadeh. 2014. A study of entanglement in a categorical framework of natural language. InProceedings of the 11th Work-shop on Quantum Physics and Logic (QPL), Kyoto, Japan, June.
Douwe Kiela and Stephen Clark. 2014. A systematic study of semantic vector space model parameters. In Proceedings of the 2nd Workshop on Continu-ous Vector Space Models and their Compositionality (CVSC), pages 21–30, Gothenburg, Sweden, April. Association for Computational Linguistics.
Gabriella Lapesa and Stefan Evert. 2014. A large scale evaluation of distributional semantic models: Pa-rameters, interactions and model selection. Transac-tions of the Association for Computational Linguis-tics, 2:531–545.
Ira Leviant and Roi Reichart. 2015. Judgment lan-guage matters: Multilingual vector space models for judgment language aware lexical semantics. CoRR, abs/1508.00106.
Omer Levy and Yoav Goldberg. 2014. Neural word embedding as implicit matrix factorization. In Z. Ghahramani, M. Welling, C. Cortes, N.D. Lawrence, and K.Q. Weinberger, editors,Advances in Neural Information Processing Systems 27, pages 2177–2185. Curran Associates, Inc.
Omer Levy, Yoav Goldberg, and Ido Dagan. 2015. Im-proving distributional similarity with lessons learned from word embeddings. Transactions of the Associ-ation for ComputAssoci-ational Linguistics, 3:211–225.
Stephen McGregor, Kat Agres, Matthew Purver, and Geraint Wiggins. 2015. From distributional seman-tics to conceptual spaces: A novel computational method for concept creation. Journal of Artificial General Intelligence, 6(1):55–86, December. Tomas Mikolov, Kai Chen, Greg Corrado, and
Jef-frey Dean. 2013. Efficient estimation of word representations in vector space. arXiv preprint arXiv:1301.3781.
Dmitrijs Milajevs and Sascha Griffiths. 2016. Treating similarity with respect: How to evaluate models of meaning? CoRR, abs/1605.04553.
Dmitrijs Milajevs and Matthew Purver. 2014. Inves-tigating the contribution of distributional semantic information for dialogue act classification. In Pro-ceedings of the 2nd Workshop on Continuous Vector Space Models and their Compositionality (CVSC), pages 40–47, Gothenburg, Sweden, April. Associa-tion for ComputaAssocia-tional Linguistics.
Dmitrijs Milajevs, Dimitri Kartsaklis, Mehrnoosh Sadrzadeh, and Matthew Purver. 2014. Evaluating neural word representations in tensor-based compo-sitional settings. In Proceedings of the 2014 Con-ference on Empirical Methods in Natural Language Processing (EMNLP), pages 708–719, Doha, Qatar, October. Association for Computational Linguistics. Jeffrey Pennington, Richard Socher, and Christopher Manning. 2014. Glove: Global vectors for word representation. In Proceedings of the 2014 Con-ference on Empirical Methods in Natural Language Processing (EMNLP), pages 1532–1543, Doha, Qatar, October. Association for Computational Lin-guistics.
Tamara Polajnar and Stephen Clark. 2014. Improv-ing distributional semantic vectors through context selection and normalisation. InProceedings of the 14th Conference of the European Chapter of the As-sociation for Computational Linguistics, pages 230– 238, Gothenburg, Sweden, April. Association for Computational Linguistics.
Herbert Rubenstein and John B. Goodenough. 1965. Contextual correlates of synonymy. Commun. ACM, 8(10):627–633, October.