Isolation and identification of cell-specific
microRNAs targeting a messenger RNA using a
biotinylated anti-sense oligonucleotide capture
affinity technique
Tidi Hassan
1, Stephen G. J. Smith
2, Kevin Gaughan
1, Irene K. Oglesby
1, Shane O’Neill
1,
Noel G. McElvaney
1and Catherine M. Greene
1,*
1
Respiratory Research Division, Department of Medicine, Royal College of Surgeons in Ireland, Beaumont
Hospital, Dublin 9, Republic of Ireland and2Department of Clinical Microbiology, School of Medicine, Trinity
College Dublin, Dublin 2, Republic of Ireland
Received November 4, 2011; Revised and Accepted December 17, 2012
ABSTRACT
MicroRNAs (miRNAs) are small non-coding RNAs that regulate expression by translational repression or messenger RNA (mRNA) degradation. Although numerous bioinformatic prediction models exist to identify miRNA–mRNA interactions, experimental validation of bona fide interactions can be difficult and laborious. Few methods can comprehensively identify miRNAs that target a single mRNA. We have developed an experimental approach to search for miRNAs targeting any mRNA using a capture affinity assay involving a biotinylated DNA anti-sense oligonucleotide. This method identifies miRNAs targeting the full length of the mRNA. The method was tested using three separate mRNA targets: alpha-1 antitrypsin (AAT) mRNA, interleuk8 mRNA and secretory leucoprotease in-hibitor mRNA. AAT mRNA-specific and total miRNAs from three different cell lines (monocytic THP-1, bronchial epithelial 16HBE14o and liver HepG2 cells) were profiled, and validation studies revealed that AAT mRNA-specific miRNAs functionally target the AAT mRNA in a cell-specific manner, providing the first evidence of innate miRNAs selectively tar-geting and modulating AAT mRNA expression. Interleukin-8 and secretory leucoprotease inhibitor mRNAs and their cognate miRNAs were also suc-cessfully captured using this approach. This is a simple and an efficient method to potentially identify miRNAs targeting sequences within the full length of a given mRNA transcript.
INTRODUCTION
MicroRNAs (miRNAs) are a class of small non-coding RNAs that regulate messenger RNA (mRNA) at the post-transcriptional level. These highly conserved 21-mer RNAs regulate the translation of mRNA transcripts by binding principally to the 30untranslated regions (30UTR) of specific mRNAs. The primary transcripts of miRNAs, called pri-miRNAs, are transcribed as polycistrons or co-transcribed with protein-coding genes, being embedded in introns or exons (1). The RNase Drosha further processes the primary transcripts of miRNAs into 70–100-nt hairpin-shaped pre-miRNAs, which are exported from the nucleus by exportin 5 (2). After the latter are cleaved to mature forms by Dicer, miRNAs guide a complex of proteins that includes a member of the Argonaute family (Ago), assemble into the RNA-induced silencing complex (RISC) and negatively regulate expression by either translational repression or mRNA degradation (3).
Each miRNA is thought to regulate multiple tran-scripts, and many transcripts are thought to be regulated by multiple miRNAs. Target mRNA identification is challenging because miRNAs bind to their target mRNAs by partial complementarity over a short sequence. Nucleotides 2–8 of the miRNA, termed the ‘seed sequence’, are essential for target recognition and binding (4). miRNA targets for individual mRNAs can be predicted through a number of freely available bio-informatic programs, which apply free-energy prediction (G) thermodynamic calculations for miRNA binding affinities to sites within the full length of an mRNA or more commonly within its 30UTR. Defining bona fide targets of a miRNA is probably the most tedious aspect
*To whom correspondence should be addressed. Tel: +353 180 93712; Fax: +353 1 809 3808; Email: [email protected]
ßThe Author(s) 2013. Published by Oxford University Press.
of miRNA research owing to high false-positive rates sec-ondary to imperfect pairing and temporal/spatial differ-ences of miRNA:mRNA interactions (5).
Experimental methods to identify miRNA targets include reporter gene assays for 30UTR analysis and transcriptome and proteome analysis following miRNA modulation using pre-miRs or anti-miRs (6). Biochemical assays to search for target mRNAs of a known miRNA using pull-down approaches have been described. These include the use of highly specific mono-clonal antibodies (7), isolation of complementary DNA (cDNA) clones of target mRNAs that base pair in vivo
with an endogenous miRNA (8) and tagged miRNAs such as biotinylated (9) or digoxigenin-labelled miRNA (10). Other purification methods proven in vitro include the tandem affinity purification of miRNA:mRNA (TAP-Tar) in which complexes are sequentially immunoprecipitated using anti-Ago antibodies and then via the miRNA using streptavidin beads (11,12). The high-throughput sequencing of RNA isolated by cross-linking immunoprecipitation (HITS-CLIP) system also explores miRNA–mRNA interaction sites in vitro
using antibodies against members of the Ago protein family (13). Another method called photoactivatable-ribonucleoside-enhanced cross-linking and immunopre-cipitation (PAR-CLIP) was developed to uncover tens of thousands of binding sites for several important RNA-binding proteins (RBP) and can be used to assess the regu-latory impact of miRNA binding on their targets (14). Unexpectedly, besides 30UTR binding sites, these studies revealed that a large proportion of miRNA targets were mapped within the mRNA coding region.
Recently, methods to comprehensively identify miRNAs that regulate a single mRNA of interest have been developed. One method uses luciferase 30UTR reporter genes in which individual miRNAs must be trans-fected into a cell line (15). However, this approach can be laborious especially when bioinformatic screening predicts multiple potential regulatory miRNAs. An affinity purifi-cation approach involving fusion of the 30UTR of the mRNA of interest with an MS2 tag cloned downstream of a green fluorescent protein (GFP) reporter has also been developed whereby mRNA:miRNA complexes are captured with an MS2-binding protein (16). As both of these techniques are limited to the 30UTR, miRNAs tar-geting the 50UTR or coding region will not be identified.
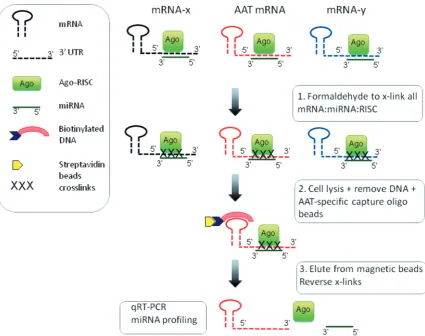
Here, we have developed an experimental approach to search for target miRNAs of a known, specific mRNA. Using formaldehyde to stabilize ternary complexes between endogenous miRNA, mRNA and RBPs, we de-veloped an affinity assay for isolation of a specific mRNA with its bound miRNAs using a biotinylated DNA anti-sense capture oligonucleotide specific to the mRNA of interest. We first selected the alpha-1 antitrypsin (AAT) mRNA for this study owing to the differential regulation and expression of AAT in different cell types. AAT is a serine proteinase inhibitor mainly produced by hepato-cytes but has also been shown to be synthesized by mono-cytes and bronchial epithelial cells. In AAT deficiency (also known as genetic emphysema), endoplasmic reticu-lum stress can occur owing to the aberrant folding of the
mutant Z protein in these cell types (17–19). There are 11 transcript variants of the AAT mRNA all over 3000 nu-cleotide bases and each of which encodes the same protein. Using the method described herein, miRNAs targeting the AAT mRNA were successfully isolated and profiled. Validation studies were performed using miRNA Taqman assays, quantitative reverse transcriptase-polymerase chain reaction (qRT-PCR) and enzyme-linked immunosorbent assay (ELISA) after miRNA modulation. The data generated showbona fidemiRNAs targeting the AAT mRNA that are specific to three different cell types. To demonstrate the general applicability of this method, we also developed strategies to successfully capture interleukin-8 (IL-8) and secretory leucoprotease inhibitor (SLPI) mRNA:miRNA complexes from monocytic cells. This approach is a simple and efficient method to poten-tially identify miRNAs targeting anywhere within the full length of an mRNA transcript.
MATERIALS AND METHODS
Cell culture and treatments
All cell lines were maintained at 37C in a humidified CO 2
incubator in appropriate media. THP-1 (human acute monocytic leukemia cell line), HepG2 (human hepatocellular carcinoma cell line) and HEK293 (human embryonic kidney cell line) cells were obtained from the European Collection of Cell Cultures (Salisbury, U.K). 16HBE14o cells (human bronchial epithelial cell line) were obtained as a gift from D. Gruenert (California Pacific Medical Center Research Institute, San Francisco, CA). THP-1 and HepG2 cells were cultured in RPMI 1640 and Dulbecco’s modified Eagle’s medium (Sigma-Aldrich, St. Louis, MO), respectively, whereas both 16HBE14o and HEK293 cells were cultured in Minimal Essential Medium (Sigma-Aldrich). All culture media contained 10% fetal calf serum (Gibco, Billings, MT) and 1% peni-cillin/streptomycin (Invitrogen, Carlsbad, CA) with the ex-ception of that for HepG2 cells, which was supplemented with L-glutamine and 0.1 mM non-essential amino acids. Before treatment, cells were washed with serum free media. For IL-8 mRNA:miRNAs capture, THP-1 cells were stimulated with lipopolysaccharide (LPS) (Sigma-Aldrich, 20mg/ml for 6 h).
GADPH andb-actin, which are reference mRNAs and are expressed in high abundance, IL-8 and IGF-1 mRNAs are also expressed in all cell lines (Supplementary Figure S1A). miRNA expression was measured using Taqman miRNA assays (Applied Biosystems, Austin, TX) accord-ing to the manufacturer’s instructions. Amplification for both mRNA and miRNA was performed on the Roche LC480 Lightcycler in triplicate samples, including no-template controls. Relative expression of transcripts and miRNAs relative to GAPDH and miR-16, respect-ively, were determined using the 2Ct method (20). GAPDH mRNA and miR-16 were chosen to normalize mRNA and miRNA, respectively. miR-16 is not predicted to regulate any of the mRNAs involved in this study; its expression is similar across all three cells and was un-affected by modulation studies involving pre-miRs and anti-miRs.
AAT ELISA
Supernatants were recovered from THP-1, 16HBE14o and HepG2 cells. AAT protein concentrations in these samples were determined by sandwich ELISA using specific antibodies to AAT (ICN Biomedicals, Solon, OH) (21).
Transfection of pre-miRs, anti-miRs and reporter plasmids THP-1, 16HBE14o and HepG2 cells (1105 in tripli-cate) were left non-transfected or transiently transfected (24 and 48 h) with indicated doses of a negative control pre-miR, synthetic pre-miRs or anti-miRs (Ambion, Life Technologies) using Ribojuice (Novogen, Madison, WI) in OptiMEM-reduced serum media (Life Technologies, Carlsbad, CA). The synthetic pre-miRs are small, chem-ically modified double-stranded RNA molecules that act as miRNA mimics, whereas the anti-miRs are chemically modified, single-stranded nucleic acids designed to specif-ically bind to and inhibit endogenous miRNA molecules.
RNA was isolated for qRT-PCR and Taqman miRNA assays, whereas supernatants were recovered for ELISA. HEK293 cells (1105 in triplicate) were transiently transfected with 250 ng pMIR-AAT-30UTR (Origene, Rockville, MD) and 100 ng of the reference Renilla
luciferase reporter plasmid pRLSV40 (Promega, Madison, WI) with Genejuice (Novagen). The pMIR AAT vector is a 30UTR-luciferase reporter in which the AAT 30UTR is cloned downstream of the firefly luciferase gene. Lysates were prepared and assayed for both firefly and Renilla luciferase using the Luciferase assay system (Promega) and coelenterazine (Marker Gene Technologies, Eugene, OR). Firefly luciferase activity was normalized to the Renillaluciferase activity.
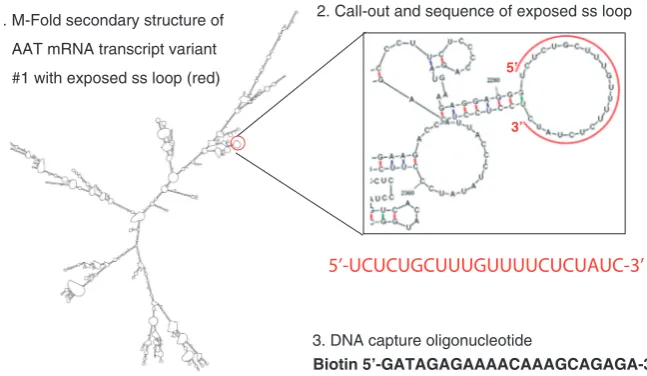
mRNA:miRNA isolation technique Biotinylated DNA oligonucleotide design
The secondary structures of the 11 mRNA transcript variants of AAT were modelled with M-Fold (mfold.rna.albany.edu/?q=mfold/RNA-Folding-Form). Two of the most thermodynamically stringent structures for each variant were selected, and an exposed single-stranded region, which was present in all variants, was identified between bases 2283 and 2304 of transcript variant 1 (Figure 1). Analysis with Basic Local Alignment Search Tool (BLAST, blast.ncbi.nlm.nih.gov/Blast.cgi) showed the sequence to have 100% total coverage and be exclusive to all but only transcripts of AAT mRNA. An anti-sense DNA oligonucleotide capture sequence (50-GATAGAGAAAACAAAGCAGAGA-30) with a 50 biotin modification was designed based on the canonical Watson–Crick RNA and DNA base paring. A mismatch DNA oligonucleotide capture sequence (altered bases indicated in bold) 50-GATAGAGAAAACAATAAAGA GA-30 also with a 50-biotin modification was designed as a negative control capture probe. Additional oligonucelotides to capture AAT mRNA included a 20-mer oligonucleotide (50-GGGGTTGCGGGGGTCAA
2. Call-out and sequence of exposed ss loop
3. DNA capture oligonucleotide
Biotin 5’-GATAGAGAAAACAAAGCAGAGA-3’
1. M-Fold secondary structure of
AAT mRNA transcript variant
#1 with exposed ss loop (red) 5’
3’
[image:3.612.150.474.518.706.2]5’-UCUCUGCUUUGUUUUCUCUAUC-3’
TGG-30) complementary to a second predicted single-stranded loop at position 2454–2474 and a 22-mer (50-CTGAAGACTGCAGGGACAGCAA-30) designed to capture a predicted double-stranded region at position 2532–2554.
To test the method on SLPI and IL-8 mRNAs, (i) a 30-mer capture oligonucleotide (50 TTATTTATTCATT GATCAACTGGCACTTCT-30) was designed to target a predicted single-stranded loop at position 546–576 in SLPI mRNA and (ii) as the IL-8 mRNA did not have any predicted single-stranded loops >15 nucleotides, a capture oligonucleotide (5-GTGGCCTCTGAAGATCT GCAGGGACAGCAA -30) directed against a predicted double-stranded region at position 413–443 was designed. Mismatch capture oligonucleotides with three mismatches were also designed for SLPI mRNA and IL-8 mRNA.
Formaldehyde cross-linking and cell lysis
Cells (5107 cells in triplicate) were treated with 37% formaldehyde (Sigma-Aldrich) to a final concentration of 1% and incubated at room temperature for 15 min for cross-linking (22). Glycine was added to a final con-centration of 0.2 M to stop the cross-linking process, and cells were washed with ice-cold Tris-buffered saline. Cell lysis was performed in lysis buffer (50 mM HEPES pH 7.5, 140 mM NaCl, 1 mM EDTA, 1% Triton, 0.1 % sodium deoxycholate) using a FastPrep cell disrupter 4–5 times at speed 5.5 for 30 s. DNA removal was performed by adding RNase-free DNase (Qiagen) and incubating at 37C for 15 min. This reaction was stopped with a final concentra-tion of 20 mM EDTA. Supernatants recovered following 12 000g centrifugation for 5 min were used for mRNA:miRNA capture. All buffers were treated with 100 protease inhibitor (Roche, Mannheim, Germany) and RNase inhibitor (Promega).
Streptavidin bead preparation and miRNA:AAT mRNA pulldown
Immobilization of 2000 pmol/ml of biotinylated capture oligonucleotide with 10 mg of streptavidin beads (Dynabeads M-280 Streptavidin) was performed accord-ing to the manufacturer’s instructions. Oligo-prepared beads (10 mg) were incubated with 1 ml of binding buffer [20 mM Tris–HCl (pH 7.5), 2 mM EDTA, 1 M LiCl] and mixed with an equal volume of formaldehyde-treated cell lysates for 30 min at room temperature for adequate an-nealing. The beads were washed twice using washing buffer [10 mM Tris–HCl (pH 7.5), 1 mM EDTA, 0.15 mM LiCl] and AAT mRNA:miRNA complexes were captured using a Dynal magnet. The beads were sus-pended in 10 mM Tris–HCl (pH 7.5) before heat treatment at 80C for 5 min to reverse the interaction between the biotin-labelled DNA:mRNA:miRNA complexes and the magnetic beads. Cross-linked nucleic acids and proteins were treated with proteinase K (Sigma-Aldrich) for diges-tion of RBPs and remaining DNase for 1 h at 42C. Next incubation at 65C for 20 min was performed to fully reverse the cross-linkages. Validation was performed to confirm the presence of AAT mRNA and true target miRNAs and to rule out the presence of other mRNAs
and miRNAs by qRT-PCR and Taqman miRNA assay. To determine the enrichment of the mRNA of interest compared with the expression of highly abundant mRNAs that may non-specifically bind to the oligo-beads, the 2Ctmethod was used to normalize the Cq values
against baseline expression of mRNAs in cell lysates.
Expression profiling of total and AAT mRNA-specific miRNAs
Total miRNAs and AAT mRNA-specific miRNAs isolated from THP-1, 16HBE14oand HepG2 cell lines were profiled commercially with the nCounter miRNA Expression Assay (Nanostring Technologies, Seattle WA). The samples were prepared with the nCounter miRNA Sample Preparation Kit according to manufac-turer’s instructions. Raw data were normalized based on the relative number of positive control counts and adjusted for probe and background corrections for each miRNA as available in the nCounter Data Analysis Guidelines.
Statistical analysis
All analyses were performed using GraphPad Prism 4.0 software package (San Diego, CA). Results are expressed as the mean ±SEM and were compared by Studentt-test (non-parametric, one tailed; Mann–Whitney) or one-sample t-test compared with 1.0 for data generated by the 2Ct
method, as appropriate. Differences were considered significant atP-values of0.05.
RESULTS
Differential expression of AAT mRNA and protein AAT is differentially expressed in hepatocytes, bronchial epithelial cells and monocytes. Using HepG2, 16HBE14o and THP-1 as representative cells lines for these cell types, AAT mRNA and protein expression were quantified by qRT-PCR and ELISA, respectively. AAT mRNA expres-sion in cell lines showed highest expresexpres-sion in the HepG2>16HBE14o>THP-1 (Supplementary Figure S2A). AAT is a secreted protein and cell supernatants con-tained 17 231± 1092, 148 ± 15 and 18 ± 2 ng/ml of AAT, respectively, (Supplementary Figure S2B).
with high miR-SVR scores were miR-132 and miR-212 (Supplementary Figure S3A).
Using standard miRNA methodologies to determine whether AAT mRNA is a molecular target of miR-940, miR-132 and miR-212, the effect of pre-miRs on expres-sion of a luciferase gene under the control of the AAT 30UTR (pMiR-REPORT-AAT) was examined in HEK293 cells. This resulted in significant decreases of up to 50% in luciferase expression from the AAT 30UTR reporter vector compared with cells transfected with a negative control pre-miR (Supplementary Figure S3B), demonstrating a causal relationship between the three miRs and the AAT 30UTR (P<0.0001). Controls performed with pre-miR-126 and pre-miR-145, which are not predicted to regulate AAT mRNA, showed no changes in luciferase gene expression (data not shown). The effect of pre-miR overexpression on AAT mRNA levels was next assessed. miR-940, miR-132 and miR-212 are not differentially expressed in THP-1, 16HBE14oor HepG2 cells (Supplementary Figure S1B). Transfection with pre-miR-940, -132 or -212 into these cells resulted in significant increases of over 1000-fold in the expression of each specific miRNA in HepG2 cells compared with non-transfected cells (Supplementary Figure S4A). qRT-PCR of AAT mRNA showed significantly reduced expression of 80, 74 and 55% in the three cell lines, re-spectively, following pre-miR-940 overexpression (P0.05, where ‘no pre-miR’ has been artificially set to 1.0) (Supplementary Figure S5). AAT ELISA on super-natants showed reductions of 31–55% in AAT protein production and secretion compared with non-transfected cells or negative control pre-miR-transfected cells (Supplementary Figure S5). There were no significant changes in AAT mRNA or protein production in response to pre-miR-132 or pre-miR-212 transfection. Only combined transfections with more than one pre-miR that included pre-pre-miR-940 showed a reduction of both the AAT mRNA and protein (data not shown).
It was also assessed whether antimiR940, 132 and -212 functionally increase AAT mRNA and protein pro-duction. Only cells transfected with anti-miR-940 resulted in significant increases in AAT mRNA expression (compared with ‘no pre-miR’, which was artificially set to 1.0) and protein production with fold changes ranging from 1.6 to 5.6–fold for mRNA and from 1.26 to 1.7–fold for protein (Supplementary Figure S6). There were no effects on the relative expression of miRNAs other than the specific miRNA targeted by each anti-miR with20% inhibition evident using 30 nM anti-miR however higher concentrations of anti-miR are likely to lead to improved knockdown (Supplementary Figure S4B). Together, these data establish that AAT mRNA can be modulated by miR-940 and that although miR-132 and mR-212 are pre-dicted to target the 30UTR of AAT mRNA, modulation of these miRs does not significantly affect AAT mRNA or protein expression.
AAT mRNA-specific isolation technique
To study miRNA regulation of AAT mRNA in more detail, an affinity capture technique was designed to
capture the AAT mRNA with its cognate miRNAs bound in a format amenable to downstream qualitative and quantitative study. First, the proposed secondary structures of all 11 AAT transcript variants were modelled using the M-fold web server. A predicted single-stranded region located between bases 2283 and 2304 of transcript variant 1, which is present in all variants, was used as a target against which a 50 biotinylated DNA capture oligonucleotide was designed (Figure 1). Cells were treated with formaldehyde to cross-link miR-Ago-RISC complexes with mRNA, lysed and treated with RNase-free DNase, and the biotinylated DNA capture oligonucleotide was used to capture AAT mRNA:miRNA complexes with streptavidin-coated magnetic beads. Samples were eluted from the magnetic beads, the DNase was inactivated and the formaldehyde cross-links were reversed. The resulting samples were used for qRT-PCR, miRNA TaqMan assays and miRNA ex-pression profiling (Figure 2).
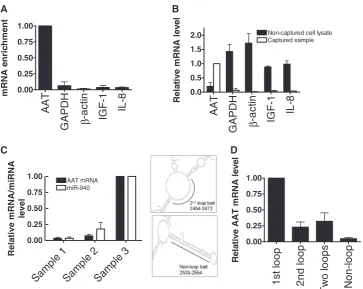
Validation of AAT mRNA:miRNA isolation technique To validate the AAT mRNA:miRNA complex affinity purification method, qRT-PCR was performed with AAT, GAPDH, b-actin, IL-8 and IGF-1 primers. Levels of mRNA in the ‘captured’ sample were normalized against levels of the same mRNA in cell lysates that did not undergo the capture procedure to identify the back-ground noise caused by highly abundant mRNAs that might associate with the streptavidin-coated beads non-specifically. This was performed using the 2Ct method. There was a substantial enrichment of the AAT mRNA by 16–75-fold compared with other highly abundant mRNAs in all three cell lines. The data for HepG2 cells are shown in Figure 3A. qRT-PCR was also performed on the remaining cell lysates post-capture, which showed that non-AAT mRNAs were not captured compared with the AAT mRNA (Figure 3B, where AAT mRNA levels in captured samples were artificially set to 1.0).
To confirm that the 5-min heat treatment at 80C used to reverse the interaction between the biotin-labelled DNA:mRNA:miRNA complexes and the Dynabeads did not dissociate the mRNA:miRNA interactions, AAT mRNA qRT-PCR and miR-940 Taqman assays were carried out on the magnetic beads pre-80C heat treatment and on the eluted samples post-80C heat treatment (Figure 3C). There were negligible levels of AAT mRNA and miR-940 in these samples, indicating that the mRNA and miRNAs are not lost at this step in the procedure. These samples were also compared with samples (artifi-cially set to 1.0) that were subsequently treated with pro-teinase K at 42C for 1 h followed by 65C heat treatment for 20 min to reverse the formaldehyde cross-links and release the mRNA and miRNAs, wherein 30–50-fold higher levels of AAT mRNA and 22–33-fold higher levels of miR-940 were present. Thus, the 5-min heat treat-ment at 80C is optional.
compared with capture oligonucleotides targeting a second predicted exposed single-stranded loop, an equimolar combination of capture oligonucleotides directed at loop 1 and loop 2 or a capture oligonucleotide targeting a predicted double-stranded sequence (Figure 3D). A capture oligonucleotide with three mismatches directed against the first loop was also used, but there was no enrichment of any mRNA including AAT mRNA (data not shown).
SLPI mRNA- and IL-8 mRNA-specific isolation
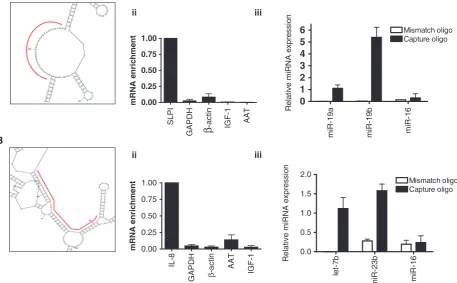
To determine whether this mRNA:miRNA complex affinity purification method was applicable to other mRNAs, strategies to isolate SLPI and IL-8 mRNAs were devised. SLPI has one transcript variant of 598 bases; IL-8 has one transcript variant of 1718 bases. Although the most thermodynamically stable secondary structure of SLPI mRNA revealed a 30-nucleotide loop at position 546–576, IL-8 mRNA did not have any pre-dicted single-stranded loop >15 nucleotides (Figure 4); instead, a capture oligonucleotide directed against a pre-dicted double-stranded region was designed. In THP-1 cells, capture using SLPI mRNA-specific oligonucleotide showed enrichment for SLPI mRNA, whereas IL-8
mRNA could be enriched using an IL-8 mRNA-specific capture oligonucleotide in cells stimulated with LPS (both of these values set to 1.0). Importantly, these mRNAs were not enriched when mismatch capture oligonucleo-tides (with three nucleotide changes compared to the wild-type sequence) were used. miR-19a (set to 1.0) and miR-19b are predictedin silicoto target SLPI mRNA and were detected in the captured samples, whereas let-7b (set to 1.0) and miR-23b, which are predicted to target IL-8 mRNA, were also detectable in the IL-8 mRNA captured assays.
miRNA expression profiling and testing AAT mRNA- and cell-specific miRNAs
[image:6.612.87.513.66.402.2]human miRNAs was performed using NanoString Technologies miRNA Expression Kit. Appreciable target detection (normalized data after probe and background correction >1) occurred for 196 miRNAs across all three cell lines (97 in all cell lines; 8, 25 and 19 exclusively in THP-1, 16HBE14o and HepG2, respectively; 20, 9 and 18 in two of the cell lines) (Supplementary Figure S7). miR-940, which regulates AAT mRNA and protein expression (Supplementary Figures S3–6), was not repre-sented in this miRNA expression kit.
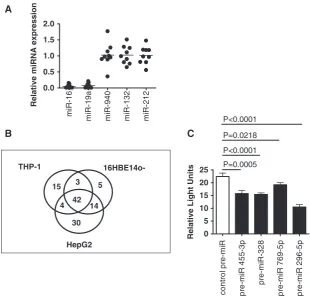
When AAT mRNA-specific miRNAs were profiled, 42, 15, 5 and 30 AAT mRNA-specific miRNAs were detected in all three cell lines, THP-1, 16HBE14o and HepG2 cells, respectively (Figure 5B and Supplementary Figure S8). By correlating appreciable target detection of AAT mRNA-specific miRNAs with miRNA abundance, miR-SVR score, the number of MREs predicted in the AAT mRNA 30UTR by miRanda and the number of MREs predicted for the whole length of the AAT mRNA pre-dicted by PITA, we observed correlations between captured AAT mRNA-specific miRNAs and miR-SVR scores and the number of predicted MREs (Supplementary Figure S9). These miRNAs were cross-referenced with the target prediction databases miRanda, TargetScan and PITA to identify 30UTR and
non-30UTR miRNAs. Of the miRNAs captured, 63% were predicted to target the 30UTR and non-30UTR of transcript variant 1.
Next, we cross-referenced 30UTR sequences predictedin
silicowith our profiling data to narrow down the miRNAs selected for functional studies. Four miRNAs with good miR-SVR scores, which were both cell and AAT mRNA-specific, were selected including miR-455-3p expressed in all cell lines, miR-328, miR-769-5p and miR-296-5p expressed exclusively in THP-1, 16HBE14o and HepG2, respectively. Co-transfection with these pre-miRs resulted in significant decreases in luciferase gene expression from the reporter vector con-taining the AAT 30UTR of 15–53% (Figure 5C) when compared with non-transfected and negative control pre-miR-transfected cells, demonstrating a causal relationship between the miRNAs isolated from AAT mRNA:miRNA complexes and the AAT 30UTR.
Functional effects of AAT mRNA-specific pre-miRs To determine whether the AAT mRNA-specific miRNAs have cell-specific effects on AAT expression, the selected miRNAs were overexpressed in three cell lines using pre-miR transfection. pre-miR-455-3p is expressed in all three cell lines. Overexpression of pre-miR-455-3p led to
S
am
pl
e 1
S
am
ple
2
Sa
m
pl
e 3
0.00 0.25 0.50 0.75 1.00
AAT mRNA miR-940
R
e
la
tive m
R
N
A
/m
iR
N
A
level
AAT
G
APD
H
-a
c
tin
β IG
F-1 IL-8 0.0
0.5 1.0 1.5
2.0 Non-captured cell lysate Captured sample
Re
la
ti
v
e
m
RNA l
e
v
e
l
AAT
GA
P
D
H
-act
in
β IGF
-1
IL
-8
0.00 0.25 0.50 0.75 1.00
m
RNA e
n
ri
c
h
m
e
n
t
1st
l
o
op
2nd l
o
op
Tw
o
lo
o
p
s
No
n
-lo
o
p
0.00 0.25 0.50 0.75 1.00
Re
la
ti
v
e
AAT m
R
NA l
e
v
e
l
A B
[image:7.612.132.496.65.354.2]C D
Figure 3. Validation of AAT mRNA-specific isolation technique. (A) qRT-PCR showing the enrichment of AAT mRNA compared with other mRNAs. Expression of captured mRNA was normalized to baseline expression of these transcripts in HepG2 cell lysates to demonstrate enrichment of the AAT mRNA compared with other highly abundant mRNAs. (B) qRT-PCR comparing the level of AAT mRNA and other mRNAs in captured samples compared with levels in the remaining cell lysates after capture. (C) AAT mRNA and miR-940 levels detectable on dynabeads pre-80C heat treatment (sample 1), in eluates post-80C heat treatment (sample 2) and in samples after reversal of formaldehyde cross-linking
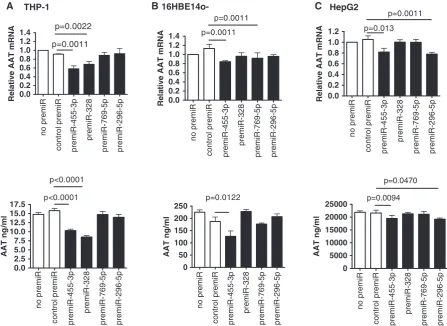
small but significant decreases for both AAT mRNA and protein expression in THP-1, 16HBE14o and HepG2 cells of 12–42% and 10–35%, respectively (Figure 6, where ‘no pre-miR’ was normalized to 1.0) and had greater effects in HepG2s at higher concentrations (Supplementary Figure S10). miR-328 targets AAT mRNA and is expressed uniquely in THP-1 cells. miR-328 overexpression resulted in small yet signifi-cant reductions of AAT mRNA and protein in THP-1 cells only. Similar results were also seen with miR-769-5p in 16HBE14o cells and miR-296-5p in HepG2 cells.
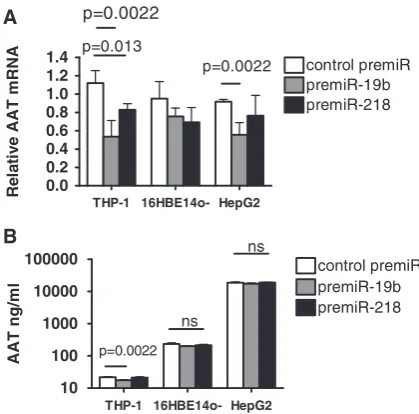
Transfections were also performed with pre-miR-19b and -218. miR-19b was detected in AAT mRNA-specific and total miRNAs in all three cell lines but was not pre-dicted to target AAT mRNA in TargetScan, miRanda or PITA. Meanwhile, miR-218 was strongly predicted in the latter databases, expressed in all three cell lines but not detected as an AAT mRNA-specific miRNA in any of the cell lines. Interestingly, pre-miR-19b transfection signifi-cantly decreased the expression of AAT mRNA in THP-1 (which was artificially set to 1.0) and HepG2 cells and decreased protein expression in THP-1s. Pre-miR-218 had little effect on AAT mRNA or protein ex-pression and only significantly decreased AAT mRNA in THP-1s (Figure 7).
DISCUSSION
Here, we present a novel method to identify multiple miRNAs targeting a known mRNA. This approach was used to isolate AAT, IL-8 and SLPI mRNAs with their miRNAs bound to RISC via formaldehyde cross-linking. Once captured using a biotinylated antisense oligonucleo-tide and magnetic beads, the cross-links in these complexes were reversed, and the RNA species were analysed with qRT-PCR and Taqman assay. In the case of AAT mRNA, its co-captured miRNAs were profiled, and the data showed that cell-specific miRNAs differen-tially regulate AAT expression in three cell types; THP-1, 16HBE14oand HepG2.
Owing to imperfect seeding of the mRNA:miRNA interaction, a method that bypasses or complements bioinformatic predictions can have several advantages. This method is an experimental approach for high-throughput identification of miRNAs targeting a specific mRNA. The false-positive rate of prediction programs has been reported to be 24–70% (5), and each program uses unique rules of targeting that can generate different lists of predicted targets. Combining the results of a variety of computational programs does increase the specificity of miRNA target identification. Here, we describe an experimental approach to generate a similar result and suggest that this method is a
SLPI
GAPDH
β
-actin IGF-1 AAT 0.00
0.25 0.50 0.75 1.00
mR
N
A
e
n
ric
h
m
e
n
t
i ii
IL-8
GAPDH β
-actin AAT IGF-1
0.00 0.25 0.50 0.75 1.00
mRNA enrichment
ii iii
i
iii
miR-19a miR-19b miR-16
0 1 2 3 4 5
6 Mismatch oligo
Capture oligo
Re
la
ti
ve
mi
RNA
e
x
p
re
s
s
io
n
let-7b
miR-23b miR-16
0.0 0.5 1.0 1.5 2.0
Mismatch oligo Capture oligo
Relative miRNA expression
A
[image:8.612.72.530.80.363.2]B
Figure 4. mRNA:miRNA isolation technique for (A) SLPI mRNA and (B) IL-8 mRNA from THP-1 cells. In all, 30-mer probes were designed to capture (i) a predicted single-stranded loop present in the SLPI mRNA and a predicted double-stranded sequence in the IL-8 mRNA (capture performed in three independent samples). qRT-PCR showed enrichment of (ii) SLPI and IL-8 mRNAs where expression of each transcript was normalized to the respective baseline expression in cell lysates using the 2Ct
method. Taqman assays showed enrichment of (iii), miR-19a/ miR-19b and let-7b/miR-23b, but not of miR-16 in samples captured with transcript-specific capture or mismatch oligonucleotides. mRNA and miRNA expression were quantified using the 2Ct
complementary tool for researchers studying miRNA regulation of target mRNAs. For example, in this study, cross-referencing of the captured miRNAs with those pre-dicted to bind to the 30UTR resulted in a highly selective and smaller number of miRNAs, presumably eliminating false positives for 30UTR-related miRNAs.
Most miRNA target prediction methods are limited to 30UTR sites. Given that the full-length transcript is used to capture interacting miRNAs, this method can also po-tentially identify miRNAs binding to coding and 50UTR regions of a transcript and is an advantage over other affinity purification systems, which identify miRNAs that target the 30UTR of an mRNA (16). Recent studies have shown that miRNA-mediated regulation is not limited to the 30UTR, although the functionality of target sites in the 50UTR and coding region requires further investigation. Comparable with the HITS-CLIP data, the PAR-CLIP study revealed that although 46% of miRNA-binding sites were mapped to the 30UTR, the other 50 and 4% of miRNAs were bound to the coding region and 50UTR, respectively. We have not, as yet, per-formed studies to validate the effects of these potential coding region- and 50UTR-targetting miRNAs with respect to regulation of the AAT mRNA.
The method described here can be easily applied to a variety of mRNAs as shown in this study for three separate target mRNAs. Initially, an important aspect of
the miRNA:mRNA capturing technique was designing the anti-sense capture oligonucleotide. Modelling the second-ary RNA structure of all AAT transcript variants with the M-fold web server identified a single-stranded region, which is present in the most thermodynamically stable structure of all variants; this region was used to design a capture oligonucleotide. However, the energetic model that M-fold uses ignores 3-dimensional interactions or protein–RNA interactions that could stabilize or desta-bilize an RNA fold. In addition, predictions from M-fold may not always correspond to the true biological fold of the RNA. Therefore, although the secondary struc-ture predicted by M-fold is unlikely to be identical to the folding structure of mRNA complexed to miRNAs, we have performed a number of experiments to suggest that in the AAT and SLPI mRNAs, a capture oligonucleotide that targets a predicted single-stranded loop is efficient. For SLPI mRNA, a 30-mer oligonucleotide based on this principle was effective. For AAT mRNA, two oligo-nucleotides designed to capture 22 and 20 base predicted single-stranded loops available in 22 secondary RNA structures representing the two most thermodynamically stable predictions for each of the 11 variants successfully captured AAT mRNA. Interestingly, when these two loops were used as combined capture oligonucleotides, the capture efficiency was reduced. This differs from another method that uses dozens of short oligonucleotide
THP-1
16HBE14o-HepG2 14 4
3
42
30 5 15
miR-16
miR-19a miR-940 miR-132 miR-212 0.0
0.5 1.0 1.5 2.0
Relative miRNA expression
c
ont
ro
l pr
e-m
iR
pr
e-m
iR
455-3
p
pr
e-m
iR
-328
pr
e-m
iR
769-5
p
pr
e-m
iR
296-5
p
0 5 10 15 20
25 P=0.0005
P=0.0218
P<0.0001 P<0.0001
Relative Ligh
t Units
A
[image:9.612.157.468.66.364.2]B C
Figure 5. miRNA expression profiling and testing of AAT mRNA- and cell-specific miRNAs. (A) Relative miRNA expression in AAT mRNA captured samples was quantified using the 2Ctmethod. Assays were performed in triplicate (n= 3). (
B) Numbers of miRNAs interacting with AAT mRNA in THP-1, 16HBE14oand HepG2 cells using NanoString Technologies miRNA Expression Kit. (C) Relative luciferase activity was measured in HEK293 cells (1105 in triplicate) transiently transfected with pMIR-AAT-30UTR and pRLSV40 and co-transfected with synthetic
probes to tile the length of a long non-coding RNA and requires no prior knowledge of an RNA’s secondary struc-ture or functional domains (24). Conversely, we have also shown that capture oligonucleotides designed against pre-dicted double-stranded sequences can also successfully capture AAT or IL-8 mRNAs. However, the efficiency of the IL-8 capture oligonucleotide cannot be compared with one that targets a predicted loop, as the secondary structure did not reveal any loop of>15 bases. Overall, although designing capture oligonucleotides based on pre-dicted single-stranded regions within the secondary struc-ture of target mRNAs was effective, given that this may not be the conformation adopted in vivo, any capture oligonucleotide based on a 20-mer sequence within the target mRNA should be effective, provided it is exclusive to that mRNA.
This method can be used to detect and compare miRNAs bound to a particular mRNA under different conditions, for example diseased versus healthy or treated versus non-treated, thus capturing the dynamic changes of miRNA:mRNA interactions in a biological system. Here, it was used to demonstrate cell-specific regu-lation of AAT mRNA by different miRNAs in three
unrelated cell types. By selecting miRNAs with a good miR-SVR score and multiple MREs in the 30UTR of the AAT mRNA, we attempted to select miRNAs that strongly regulate the AAT mRNA and confirmed this by showing AAT mRNA and protein downregulation follow-ing specific miRNA overexpression, in a cell-specific manner. In another example, the IL-8 mRNA-specific miRNAs captured after treatment of monocytic cells with lipopolysaccharide likely reflects miRNAs specific to this biological event. However, by pooling samples for the miRNA profiling, we cannot comment on the re-producibility and inherent variability of the genome-wide aspect of the method. Therefore, the profiling data pre-sented here represents a preliminary approach to select miRNAs for subsequent qRT-PCR work.
Another unique feature of this method compared with other technologies is the fact that the full-length endogen-ous mRNA is isolated, presumably in its natural conform-ation bound to innate miRNAs and Argonuate proteins, thereby reflecting the natural biological process in differ-ent cell types. Although other methods such as PAR-CLIP also have the advantage of analysing RNA–protein inter-actions in their native architecture, ultraviolet as opposed
no premiR
control premiR premiR-455-3p
premiR-328 premiR-769-5p premiR-296-5p 0.0 0.2 0.4 0.6 0.8 1.0 1.2 1.4 p=0.0011 p=0.0022
Relative AAT mRNA
no premiR
control premiR premiR-455-3p
premiR-328 premiR-769-5p premiR-296-5p 0.0 0.2 0.4 0.6 0.8 1.0 1.2 1.4 p=0.0011 p=0.0011 Re la ti v e AAT m RNA no pr emi R c ont ro l pr emi R pr emi R -455-3p pr emi R -3 28 pr emi R -769-5p pr emi R -296-5p 0.0 0.2 0.4 0.6 0.8 1.0 1.2 p=0.0011 p=0.013 Relative A AT m R N A no pr em iR cont ro l pr em iR pr em iR -4 55-3 p pr em iR -3 28 pr em iR -7 69-5 p pr em iR -2 96-5 p 0.0 2.5 5.0 7.5 10.0 12.5 15.0 17.5 p<0.0001 p<0.0001 AAT n g /m l no premiR
control premiR premiR-455-3p
premiR-328 premiR-769-5p premiR-296-5p 0 50 100 150 200 250 p=0.0122 AAT ng /m l no premiR
control premiR premiR-455-3p
premiR-328 premiR-769-5p premiR-296-5p 0 5000 10000 15000 20000 25000 p=0.0094 p=0.0470 AAT ng/ m l
THP-1 16HBE14o- HepG2
[image:10.612.75.523.68.394.2]A B C
Figure 6. Effects of pre-miR-455-3p, pre-miR-328, pre-miR-769-5p and pre-miR-296-5p overexpression on AAT mRNA (top) and protein (below) expression in (A) THP-1, (B) 16HBE14oand (C) HepG2. Cells (1105in triplicate) were left untreated (no pre-miR) or transfected with 30 nM negative control pre-miR (control pre-miR) or synthetic pre-miRs as indicated. 24 h post-transfection RNA was isolated and used in qRT-PCR reactions with AAT and GAPDH primers. Relative AAT mRNA expression was quantified using the 2Ctmethod. Thereafter, 24 and 48 h culture
to formaldehyde cross-linking can cause some redistribu-tion of cellular components and lead to ultraviolet-damaged molecules. Formaldehyde cross-linking has the advantage of being reversible and has been used in the identification of RISC proteins that bind to mRNAs and of miRNAs that bind to target mRNAs (25). Formaldehyde is also used in RNA–protein chromatin immunoprecipitation, which cross-links RNA–protein complexes in living cells and isolates these by immunopre-cipitation using a specific antibody (26). Similar to RNA– protein chromatin immunoprecipitation in which the results obtained are highly dependent on the quality of the immunoprecipitating antibody, the key to successful capturing using this method depends on the quality of the DNA anti-sense oligonucleotide.
Unlike PAR-CLIP and HITS-CLIP, this system does not map interaction sites. In addition, it is not possible to assess or predict the impact of the captured miRNAs on regulation of the target mRNA without further experi-mental validation. Thus, although initial bioinformatic screening is not necessary, these programs are important tools in subsequent analysis to predict MREs. Although some non-target mRNAs were detectable in the captured samples, possibly owing to their high abundance and/or ability to bind non-specifically to the oligo-beads, the normalized enrichment ratios were small. Interestingly, by using the nCounter miRNA expression assay, which does not use reverse transcription or pre-amplification, real-time quantification of bound miRNAs reflects a
high likelihood of AAT mRNA-specific miRNAs, with miRNA abundance likely depending on the presence of multiple binding sites in the target. Unlike other miRNA microarrays or qRT-PCR, this assay is more appropriate for methods that are unbiased but likely to have minimal contamination from non-specific miRNAs.
Three interesting observations were noted here regard-ing AAT mRNA and its co-captured miRNAs: (i) some miRNAs that were predictedin silico, which had an effect on the AAT 30UTR reporter gene, and that were co-captured with AAT mRNA did not have a functional effect on AAT mRNA or protein expression when tested in pre-miR and anti-miR experiments (i.e. miR-32 and miR-212). This suggests that although the specific associ-ation of some miRNAs with a particular mRNA can be demonstrated, the interaction on occasion may show no functional effect. It is not known why this is the case, and it may be owing to, as yet undetermined, miRNA- or transcript-specific inhibitory factors. The percentage miRNA knockdown by anti-miRs in this case was small; therefore, further experiments using higher concentrations of anti-miRs may help to explain this phenomenon. (ii) miR-218 was strongly predicted to target AAT mRNA and although detectable in the total miRNA profile of the three cell types was not isolated with AAT mRNA and did not have a significant effect on AAT mRNA or protein expression other than in THP-1 cells. However, as the activity of a miRNA in a particular cell type is a function of its availability and the demand for its binding, ‘target competition’ could explain in part why predicted and expressed miRNAs such as miR-218 are absent from the pull-down. Further validation should include wild-type and mutant AAT 30UTR reporter assays carried out in the actual cell line of interest to allow for competition with, for example endogenous RBPs and other miRNAs that might be confounding factors. Mimic and antagonist dose–response experiments would also be required to validate whether miR-218 can truly regulate AAT mRNA. Importantly, although mimic overexpression studies demonstrate that a miRNA can regulate a target mRNA when present in vast stoichiomet-ric excess, anti-miRs show whether these miRNA do regulate the mRNA by disrupting endogenous complexes. (iii) miR-19b was not predicted to regulate AAT mRNA but was captured with AAT mRNA and had inhibitory effects on AAT mRNA and protein expression in some pre-miR experiments. For miR-19b and all miRNAs isolated by this method, it is recommended that additional biochemical assays be performed to independently confirm the observations. This should be standard practice when confirming data generated using any affinity capture method and is particularly important, given that miRNA targets can differ temporally and spatially. Furthermore, miRNAs regulate target mRNA expression in a moderate way and can work synergistically or additively with other miRNAs. Overall, the results pre-sented here suggest that the combined regulation of many different factors determines the cell- and target-specific functionality of a miRNA.
This study provides direct evidence of miRNAs target-ing and modulattarget-ing AAT mRNA and protein expression. THP-1 16HBE14o- HepG2
0.0 0.2 0.4 0.6 0.8 1.0 1.2
1.4 control premiR
premiR-19b premiR-218
p=0.0022
p=0.0022 p=0.013
Re
la
ti
v
e
AAT m
R
NA
THP-1 16HBE14o- HepG2 10
100 1000 10000
100000 control premiR
premiR-19b premiR-218
p=0.0022 ns
ns
AAT ng/
m
l
A
[image:11.612.73.283.67.274.2]B
Figure 7. The effects of pre-miR-19b and pre-miR-218 overexpression on (A) AAT mRNA and (B) AAT protein expression in THP-1, 16HBE14oand HepG2. Cells (1105 in triplicate) were transfected with 30 nM negative control pre-miR (control pre-miR) or synthetic pre-miRs as indicated. Twenty-four hours post-transfection RNA was isolated and used in qRT-PCR reactions with AAT and GAPDH primers. Relative AAT mRNA expression for each cell type was quantified using the 2Ct
Expression levels of AAT are known to vary in different cell types and in response to different stimuli (27). Previous studies have focused on cell and stimulus-specific transcriptional regulation with a tissue-specific promoter known to be present in the liver. The transcription factors hepatocyte nuclear factor 1-alpha and 4 regulate basal AAT mRNA expression however, as an acute-phase response protein, an enhancer sequence modulates cytokine-induced expression by interleukin-6 and oncostatin M (28). Alternative promoters have also been shown for other tissues that express AAT (29,30). Here, we show that cell-specific miRNA expression is likely to be another previously unrecognized mechanism modulating cell-specific AAT expression. However, it is important to acknowledge that given that the expression of AAT mRNA ranges 10-fold whilst the protein ranges over 1000-fold between different cell types, secondary mechan-isms other than miRNA, such as cell-specific mRNA stability and translation efficiency are also likely at play.
In conclusion, this is a simple and efficient method of identifying native interacting miRNAs targeting the whole sequence of an endogenous mRNA transcript. Together with target prediction programs and more sensitive and specific assays for further elucidation of miRNA biogen-esis and functionality, this method is likely to significantly advance miRNA research.
SUPPLEMENTARY DATA
Supplementary Data are available at NAR Online: Supplementary Table 1 and Supplementary Figures 1–10.
FUNDING
Science Foundation Ireland via a Technology Innovation Development Award [12/TIDA/B2265]; Medical Research Charities Group and Health Research Board. Funding for open access charge: Science Foundation Ireland via a Technology Innovation Development Award [12/TIDA/ B2265].
Conflict of interest statement. None declared.
REFERENCES
1. Cai,X., Hagedorn,C.H. and Cullen,B.R. (2004) Human microRNAs are processed from capped, polyadenylated transcripts that can also function as mRNAs.RNA,10, 1957–1966.
2. Lee,Y., Ahn,C., Han,J., Choi,H., Kim,J., Yim,J., Lee,J., Provost,P., Ra˚dmark,O., Kim,S.et al. (2003) The nuclear RNase III Drosha initiates microRNA processing.Nature,25, 415–419. 3. Chendrimada,T.P., Gregory,R.I., Kumaraswamy,E., Norman,J.,
Cooch,N., Nishikura,K. and ans Shiekhattar,R. (2005) TRBP recruits the Dicer complex to Ago2 for microRNA processing and gene silencing.Nature,436, 740–744.
4. Grimson,A., Farh,K.K., Johnston,W.K., Garrett-Engele,P., Lim,L.P. and Bartel,D.P. (2007) MicroRNA targeting specificity in mammals: determinants beyond seed pairing.Mol. Cell,27, 91–105.
5. Sethupathy,P., Megraw,M. and Hatzigeorgiou,A.G. (2006) A guide through present computational approaches for the identification of mammalian microRNA targets.Nat. Methods,3, 881–886.
6. Ørom,U.A. and Lund,A.H. (2010) Experimental identification of microRNA targets.Gene,451, 1–5.
7. Beitzinger,M. and Meister,G. (2011) Experimental identification of microRNA targets by immunoprecipitation of Argonaute protein complexes.Methods Mol. Biol.,732, 153–167.
8. Andachi,Y. (2008) A novel biochemical method to identify target genes of individual microRNAs: identification of a new
Caenorhabditis eleganslet-7 target.RNA,14, 2440–2451. 9. Orom,U.A. and Lund,A.H. (2007) Isolation of microRNA
targets using biotinylated synthetic microRNAs.Methods,43, 162–165.
10. Hsu,R.J. and Tsai,H.J. (2011) Performing the Labeled microRNA pull-down (LAMP) assay system: an experimental approach for high-throughput identification of microRNA-target mRNAs. Methods Mol. Biol.,764, 241–247.
11. Nonne,N., Ameyar-Zazoua,M., Souidi,M. and Harel-Bellan,A. (2010) Tandem affinity purification of miRNA target mRNAs (TAP-Tar).Nucleic Acids Res.,38, e20.
12. Zheng,W., Zou,H.W., Tan,Y.G. and Cai,W.S. (2011)
Identification of microRNA target genesin vivo.Mol. Biotechnol.,
47, 200–204.
13. Chi,S.W., Zang,J.B., Mele,A. and Darnell,R.B. (2009) Argonaute HITS-CLIP decodes microRNA-mRNA interaction maps.Nature,
460, 479–486.
14. Hafner,M., Landthaler,M., Burger,L., Khorshid,M., Hausser,J., Berninger,P., Rothballer,A., Ascano,M. Jr, Jungkamp,A.C., Munschauer,M.et al. (2010) Transcriptome-wide identification of RNA-binding protein and microRNA target sites by PAR-CLIP. Cell,141, 129–141.
15. Wu,S., Huang,S., Ding,J., Zhao,Y., Liang,L., Liu,T., Zhan,R. and He,X. (2010) Multiple microRNAs modulate p21Cip1/Waf1 expression by directly targeting its 30 untranslated region.
Oncogene,29, 2302–2308.
16. Vo,N.K., Dalton,R.P., Liu,N., Olson,E.N. and Goodman,R.H. (2010) Affinity purification of microRNA-133a with the cardiac transcription factor, Hand2.Proc. Natl Acad. Sci. USA,107, 19231–19236.
17. Kelly,E., Greene,C.M., Carroll,T.P., McElvaney,N.G. and O’Neill,S.J. (2009) Selenoprotein S/SEPS1 modifies endoplasmic reticulum stress in Z variant alpha-1 antitrypsin deficiency.J. Biol. Chem.,284, 16891–16897.
18. Greene,C.M., Miller,S.D., Carroll,T.P., Oglesby,I.K., Ahmed,F., O’Mahony,M., Taggart,C.C., McElvany,N.G. and O’Neill,S.J. (2010) Anti-apoptotic effects of Z alpha1-antitrypsin in human bronchial epithelial cells.Eur. Respir. J.,34, 1155–1163. 19. Carroll,T.P., Greene,C.M., O’Connor,C.A., Nolan,A.M.,
O’Neill,S.J. and McElvaney,N.G. (2010) Evidence for unfolded protein response activation in monocytes from individuals with alpha-1 antitrypsin deficiency.J. Immunol.,184, 4538–4546.
20. Livak,K.J. and Schmittgen,T.D. (2001) Analysis of relative gene expression data using real-time quantitative PCR and the 2(-Delta Delta C(T)) method.Methods,25, 402–408.
21. Carroll,T.P., Greene,C.M. and McElvaney,N.G. (2011) Measurement of the unfolded protein response (UPR) in monocytes.Methods Enzymol., 489, 83–95.
22. Gilbert,C. and Svejstrup,J.Q. (2006) RNA immunoprecipitation for determining RNA-protein associationsin vivo.Curr. Protoc. Mol. Biol.,27, Unit 27.4.
23. Betel,D., Koppal,A., Agius,P., Sander,C. and Leslie,C. (2010) Comprehensive modeling of microRNA targets predicts functional non-conserved and non-canonical sites.Genome Biol.,
11, R90.
24. Chu,C., Qu,K., Zhong,F.L., Artandi,S.E. and Chang,H.Y. (2011) Genomic maps of long non-coding RNA occupancy reveal principles of RNA-chromatin interactions.Mol. Cell,44, 667–678. 25. Vasudevan,S., Tong,Y. and Steitz,J.A. (2007) Switching from
repression to activation:microRNAs can up-regulate translation. Science,318, 1931–1934.
26. Niranjanakumari,S., Lasda,E., Brazas,R. and Garcia-Blanco,M.A. (2002) Reversible cross-linking combined with
27. Hafeez,W., Ciliberto,G. and Perlmutter,D.H. (1992) Constitutive and modulated expression of the human alpha 1 antitrypsin gene. Different transcriptional initiation sites used in three different cell types.J. Clin. Invest., 89, 1214–1222.
28. Rangan,V.S. and Das,G.C. (1990) Purification and biochemical characterization of hepatocyte nuclear factor 2 involved in liver-specific transcription of the human alpha 1-antitrypsin gene. J. Biol. Chem.,265, 8874–8879.
29. Perlino,E., Cortese,R. and Ciliberto,G. (1987) The human alpha 1-antitrypsin gene is transcribed from two different promoters in macrophages and hepatocytes.EMBO J.,6, 2767–2771. 30. Sifers,R.N., Carlson,J.A., Clift,S.M., DeMayo,F.J., Bullock,D.W.
and Woo,S.L. (1987) Tissue specific expression of the human alpha-1-antitrypsin gene in transgenic mice.Nucleic Acids Res.,