Original Article
Abnormalities in the fiber composition
and contractility in diabetic skeletal muscles
Lina Huang, Lianhua Chen, Yimin Qiu, Shitong Li
Department of Anesthesiology, The Affiliated First People’s Hospital, School of Medicine, Shanghai Jiaotong University, Shanghai 201620, China
Received February 29, 2016; Accepted November 26, 2016; Epub February 15, 2018; Published February 28, 2018
Abstract: The study aimed to investigate the changes induced by diabetes in diaphragm (DIA), extensor digitorum-longus (EDL), and soleus (SOL) contractility and histochemistry throughout a broad time span. The contractility and ATPase staining of DIA, EDL, and SOL from the streptozotocin-induced rats and age-matched control ratswere observed over a period ranging from 4 weeks to 16 weeks after streptozotocin treatment. Only the muscle weight-to-body weight ratio of EDL displayed a reduction. Twitch tension force and tetanic tension decreased, while the time to peak tension and half-relaxation time were prolonged in diabetic rats. The fatigue index of DIA demonstrated an increase from 4 weeks to 8 weeks and a decline from 12 weeks to 16 weeks after the induction of diabetes. Regarding fatigue indexes, EDL and SOL demonstrated an incremental trend during the time frame. For DIA and
SOL in the diabetic rats, the proportion of type I fibers grew higher, while EDL revealed a similar composition as the control rats. Both the fiber areas of type I and type II fibers decreased in the diabetic rats. DIA, EDL, and SOL
appeared to suffer from muscle atrophy. The contractile forces and speed-related properties were impaired in the diabetic rats. The increased fatigability was demonstrated in DIA at a later stage, whereas resistance to fatigue in DIA at an early stage of diabetes was noted. The endurance to fatigue decreased in EDL and SOL as well. The study
indicated that the differential alterations of contractile properties were associated with streptozotocin-induced fiber
transformation.
Keywords: Streptozotocin, diaphragm, extensor digitorum longus, soleus, diabetes
Introduction
Diabetes Mellitus (DM) is a metabolic disorder characterized by abnormally high blood glucose levels due to decreased secretion or effective-ness in the function of insulin. Diabetes, if poorly controlled, leads to skeletal muscle atro-phy, decreasing the quality of life [1-3]. Recently, diabetic myopathy has received much attention [4-6]. The pathophysiology of diabetic myopa-thy includes reduced physical capacity, as well asloss of muscle mass and contractile function [4, 7, 8].
Skeletal muscles are composed of
heteroge-neous types of fibers based on the expression
of different myosin heavy chain (MyHC)
iso-forms [9, 10]. Skeletal muscle fibers are classi
-fied intothree types: slow-twitch oxidative (type
I) containing only the slow MyHC isoform, whereas fast-twitch oxidative-glycolytic (type
IIA) and fast-twitch glycolytic (FG, type IIB)
skel-etal muscle fibers containing the fast MyHC
isoforms [6]. Extensor digitorum longus (EDL) muscle and soleus (SOL) muscle are typical fast and slow twitch muscles, composed of
predominately fast and slow twitch fibers,
respectively. Regarding diaphragm (DIA), it is a kind of respiratory muscle, composed of
mixed twitch fibers, and is considered a limiting
factor for overall muscle performance [11]. Muscle contractile properties depend on the alterations of muscle types [7, 8]. The typing of
muscle fibers is based on oxidative and glyco -lytic capacities, twitch characteristics, and ATPase activity [12]. Besides the effects of
dif-ferent muscle fiber types, muscle contractile
of contractile proteins by Ca2+ [11]. The SR
den-sity in type II fibers is twice than that of type I fibers, which may be one reason for different
contractile properties [13]. Moreover, it has
been shown that in fast twitch fibers the SR had
a larger capacity and the endogenous Ca2+ con-tent was a relatively lower percentage of
maxi-mum compared with slow twitch fibers [14].
Diabetic human and animals have been
report-ed to show an increase in type I fibers and a reduction in type IIA and IIB fibers in several
muscles [6, 7, 15]. Due to these, the contractile
properties in diabetes may be muscle specific
[7, 8, 16, 17].
It has been demonstrated that the progress in
muscle functions and fiber alteration occurs in
a time-dependent manner [18]. The duration of
diabetes may markedly influence the perfor -mance of the complication. However, few stud-ies have directly assessed the progressive alterations of skeletal muscles in DM under the same conditions.
Streptozotocin (STZ) is a diabetogenic agent that had been widely used in animal models to study insulin-dependent DM and had demon-strated awide variety of physiological effects on peripheral nerves and muscles [19]. The STZ-induced diabetes is a well-known model of type 1 DM, which has a distinct etiology from type 2 DM. Aside from the distinctions, the alterations in muscle structures associated with reduc-tions in muscle funcreduc-tions are quite similar [20].
So the findings of the current study are of great
clinical relevance.
The aim of the current study was to investigate the changes induced by diabetes in DIA, EDL, and SOL contractility and histochemistry thr- oughout a broad time span. This study obser- ved STZ-induced diabetic rats and age-match- ed control rats over a period ranging from 4 weeks to 16 weeks after STZ treatment. Materials and methods
Animals
This study was approved by the Animal Care and Use Committee of the Shanghai Jiaotong University School of Medicine and was per-formed in compliance with the World Health Organization International Guiding Principles
for Animal Research. A total of 48 male Spra- gue-Dawley rats (Experimental Animal Center of the School of Medicine, Shanghai Jiaotong University, Shanghai, China), weighing 220-260 g, were housed in groups of three. They were fasted but allowed to have free access to wa- ter and food prior to the experiments.
Induction of diabetes
Rats were randomly divided into two groups. One group (n=24) was the diabetic group, which was induced by a single intraperitoneal injec-tion of STZ (60 mg/kg, Sigma, St Louis, MO, USA) in 20 mm sodium citrate buffer (pH 4-5) after 12 hours fasting. Another group (n=24) was the normal group, which comprised normal animals matched in age and was given the same volumes of citric acid buffer solution only. Two days after injection, blood sugar was mea-sured twice in series by cutting tails. Successful models were determined if the blood sugar val-ues were above 16.7 mmol/L. The rats with blood sugar tested below 16.7 mmol/L were rejected from the study. After modeling suc-cessfully, the diabetic rats and the age-matched control rats were randomly divided into four subgroups: diabetic 4 weeks group (4wDM), diabetic 8 weeks group (8wDM), diabetic 12 weeks group (12wDM), and diabetic 16 weeks (16wDM) group and control 4 weeks group (4wC), control 8 weeks group (8wC), control 12 weeks group (12wC), and control 16 weeks group (16wC) (n=6 each group), respectively.
The rats were sacrificed at 4 weeks, 8 weeks,
12 weeks, and 16 weeks after STZ admini- stration.
Muscle preparations
Rats were killed with 60 mg/kg pentobarbital intraperitoneally. Strips of DIA, EDL, and SOL were established for direct electrical stimula-tion as described previously [8, 21, 22]. The body temperature was maintained at 37°C using a heating blanket and radiant heat. Strips of DIA with a central tendon and rib cage intact (5 mm wide), which were cut parallel to
the muscle fibers, were rapidly removed from
the other leg. The SOL was exposed by section-ing the tendons connectsection-ing the plantaris and
gastrocnemius muscles to the heel, and reflect -ing the muscles back. A silk thread was attached to the distal tendon of the SOL, and the tendon was sectioned. The muscle was then carefully freed of surrounding tissues, ensuring the blood supply remained intact. The EDL was prepared in the similar manner after
first exposing the muscle by reflection of the
anterior tibialis muscle. The silk sutures were tied to the proximal and distal tendons of the EDL and/or SOL muscles, and the muscles were removed, tendon to tendon. The EDL, SOL, and DIA of the other side were dissected simultaneously for ATPase staining.
The isolated muscle preparations were dipped
immediately into plexiglass chambers filled
with Krebs solution, maintained at 37°C and bubbled with 95% oxygen/5% CO2. The compo-sition of the Krebs solution was as follows: 137 mM NaCl, 4 mM KCl, 2 mM CaCl2, 1 mM MgCl2, 1 mM KH2PO3, 12 mM NaHCO3, and 6.5 mM glucose, with a pH 7.40±0.05 during bubbling.
Muscle contractile properties
The electrical stimulation-evoked twitch ten-sion was recorded with MPA Multiple Channel Biological Signal Analysis System (provided by the Department of Anesthesiology, Shanghai First People’s Hospital, Shanghai Jiaotong University). Each isolated strip was mounted vertically in a tissue chamber, inferiorly posi-tioned. One side of the isolated DIA preparation
was fixed at the rib cage; meanwhile, the other
side was suspended at the central tendon from a force displacement transducer using a 3-0 silk suture (ALC-M System for Isolated Tissue-Organ Research, Acquisition and Analysis System for Life Science Research, Shanghai Alcott Biotech, Shanghai, China; 40 mL in vol-ume). As for the EDL and SOL preparations, they were aligned vertically with a distal tendon attached to the force displacement
trans-ducerand a proximal tendon fixed to the stain
-less steel fixed-post. The chamber was filled
with Krebs solution as mentioned earlier. The muscle strip was placed between two large
sil-ver electrodes and pretreated with a sufficient concentration (12 μM) of d-tubocurarine to
completely eliminate neuromuscular transmi- ssion.
Isometric tension was elicited by direct supra-maximal constant-voltage stimulation at 0.1 Hz for 0.2 ms, using a stimulator and a constant-voltage unit. The twitch tension was recorded via the force transducer on a recorder (ALC-MPA 2000 m, Acquisition and Analysis System for Life Science Research, Shanghai Alcott Biotech, Shanghai, China). The stimulator was activated by a personal computer. Twitch stimu-li were used to determine the optimal length (L0) at which skeletal muscle may generate the greatest force. A number of measurements were performed as described in the subse-quent sections.
Twitch tension
Three twitches were recorded at L0 to obtain maximal twitch force (Pt), timetopeak tension (TPT), and half-relaxation time (HRT). The aver-age values were calculated for analysis.
Tetanic tension
Two supramaximal stimuli with a frequency of 120 Hz for 250 msat an optimal length were generated to obtain the maximal tetanic force (P0) and twitch tension-to-tetanic force ratio (Pt/P0).
Fatigue
Muscle strips were fatigued by means of 330 ms stimulations repeated at 40 Hz and applied every second for 5 minutes. Fatigue index (FI)
is defined as the ratio oftension after 5-minute
fatigue protocol to maximal isometric tension [22].
Following the experiment, the muscles were weighed and the cross-sectional area (CSA) was estimated based on the formulas as fol-lows: for DIA, CSA (cm2)=muscle weight (g)/[L0 (cm)×1.056 (g/cm3)], assuming muscle density as 1.056 g/cm3 [21]; for EDL and SOL, CSA (cm2)=muscle weight (g)/[L0 (cm)×1 (g/cm3)], assuming muscle density as 1 g/cm3 [22]. Absolute force, normalized per CSA (in N/cm2) was determinedat the end of the equilibration period.
Muscle histochemical study
followed by further freezing in liquid nitrogen.
Muscle blocks were serially sliced at 15 μm on
a cryostat (Leica CM1850, Nussloch, Germany).
The modified ATPase staining method was
applied in addition to hematoxylin and eosin staining.
Myofibrillar ATPase staining was done following
alkaline pH 10.4 and acid pH 4.5 using a
modi-fication of the procedure described by Brooke and Kaiser [23]. Fibers were classified into type I (slow-twitch muscle fiber with weak mATPase activity) and type II (fast-twitch muscle fiber
with strong mATPase activity) [12]. The image analysis software Image-Pro Plus, version 5.1 (Media Cybernetics, MD, USA) was used to eval-uate the prepared samples. Then,
approximate-ly 400 fibers per muscle were measured for muscle fiber type distribution and CSA (μm2) of
each fiber type. The distribution of muscle fibers of a given fiber type (type I or II) was expressed as a percentage of all the fibers in
the section.
Statistical analysis
All data were analyzed by SPSS version 13.0 software (IBM, NY, USA). Data were expressed as mean ± standard deviation (SD). One-way
analysis of variance was used to test the signifi -cance of differences among all groups. The paired t test was used for comparison between control group and diabetic group in the same time groups. P<0.05 was considered to
indi-cate a statistically significant difference. Results
Blood glucose levels
At the time of sacrifice, the level of blood glu -cose was measured by glu-cose-strip reader and found to be 25.01±4.05 versus 4.90± 0.53 mmol/L for the 4Wdm group and the age-matched control animals, respectively (n= 6 for each experimental group, P<0.01), not
increasing significantly with diabetes progres -sion, 26.30±5.01 versus 5.31±1.51 mmol/L in 8wDM rats and 8wC, 25.60±4.91 versus
5.53±1.72 mmol/L in 12wDM rats and 12wC, 26.11±4.59 versus 5.44±1.63 mmol/L in 16wDM rats and 16wC, respectively (n=6 for each group, P<0.01).
Body and muscle weight
[image:4.612.90.523.83.190.2]Body weights of the control rats showed a steady increase from 378.9±72.4 g (4wC) to Table 1. Body and muscle weights from the diabetic rats and age-matched controls
Variables 4 weeks 8 weeks 12 weeks 16 weeks
Control Diabetic Control Diabetic Control Diabetic Control Diabetic
Body weight (g) 378.9±72.4 260.0±93.9* 431.7±64.8 224.7±39.4* 490.6±49.6 216.7±45.9* 496.4±72.4 218.3±29.1*
DIA weight (g) 0.074±0.013 0.052±1.342* 0.081±0.015 0.043±0.014* 0.083±0.028 0.036±0.010* 0.084±0.013 0.033±0.012*
DIA M/B ratio (×10-4) 1.95±0.42 2.00±0.43 1.88±0.36 1.91±0.41 1.69±0.33 1.66±0.46 1.69±0.37 1.51±0.41
EDL weight (g) 0.157±0.011 0.098±0.015* 0.179±0.033 0.081±0.014* 0.210±0.088 0.074±0.150* 0.214±0.013 0.067±0.007* EDL M/B ratio (×10-4) 4.14±0.32 3.77±0.57* 4.15±0.54 3.60±0.43* 4.28±0.31 3.41±0.34* 4.31±0.33 3.06±0.24* SOL weight (g) 0.145±0.041 0.107±0.134* 0.171±0.032 0.097±0.015* 0.196±0.018 0.089±0.006* 0.197±0.020 0.089±0.010*
SOL M/B ratio (×10-4) 3.82±0.45 4.11±0.52* 3.96±0.39 4.31±0.37* 4.00±0.29 4.11±0.43 3.97±0.41 4.07±0.40
Values are expressed as mean ± SD. Statistical analysis was performed by one-way ANOVA with post-hoc Bonferroni testing. *P<0.05 versus age-matched controls.
ANOVA, Analysis of variance; DIA, diaphragm; EDL, extensor digitorum longus; SOL, soleus; M/B ratio, muscle weight to body weight ratio.
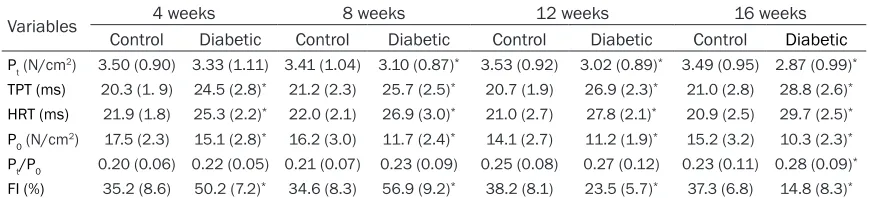
Table 2. Contractile properties of diaphragm from the diabetic rats and age-matched controls
Variables 4 weeks 8 weeks 12 weeks 16 weeks
Control Diabetic Control Diabetic Control Diabetic Control Diabetic
Pt (N/cm2) 3.50 (0.90) 3.33 (1.11) 3.41 (1.04) 3.10 (0.87)* 3.53 (0.92) 3.02 (0.89)* 3.49 (0.95) 2.87 (0.99)* TPT (ms) 20.3 (1. 9) 24.5 (2.8)* 21.2 (2.3) 25.7 (2.5)* 20.7 (1.9) 26.9 (2.3)* 21.0 (2.8) 28.8 (2.6)*
HRT (ms) 21.9 (1.8) 25.3 (2.2)* 22.0 (2.1) 26.9 (3.0)* 21.0 (2.7) 27.8 (2.1)* 20.9 (2.5) 29.7 (2.5)*
P0 (N/cm2) 17.5 (2.3) 15.1 (2.8)* 16.2 (3.0) 11.7 (2.4)* 14.1 (2.7) 11.2 (1.9)* 15.2 (3.2) 10.3 (2.3)*
Pt/P0 0.20 (0.06) 0.22 (0.05) 0.21 (0.07) 0.23 (0.09) 0.25 (0.08) 0.27 (0.12) 0.23 (0.11) 0.28 (0.09)*
FI (%) 35.2 (8.6) 50.2 (7.2)* 34.6 (8.3) 56.9 (9.2)* 38.2 (8.1) 23.5 (5.7)* 37.3 (6.8) 14.8 (8.3)*
Data are presented as mean (SD). Statistical analysis was performed by one-way ANOVA with post hoc Bonferroni testing. *P<0.05 versus
age-matched controls. ANOVA, Analysis of variance; Pt, twitch tension; TPT, time to peak tension; HRT, half-relaxation time; P0, tetanic tension; Pt/P0,
[image:4.612.89.524.239.338.2]496.4±72.4 g (16wC), whereas the diabetic rats demonstrated a decline from 260.0±93.9
g (4wDM) to 218.3±29.1 g (16wDM). A signifi -cant difference was observed in body weights in the diabetic group compared with that in the age-matched group (P<0.05, Table 1). Muscle weights of DIA, EDL, and SOL for the diabetic rats reduced compared with those for the control rats. While expressed relative to body weight, only the EDL muscle weight-to-body weight ratio (M/B ratio) displayed a reduc-tion (P<0.05, Table 1). For SOL, the M/B ratio
showed a significant increase compared with
the age-matched control rats (P<0.05, Table 1). For DIA, the M/B ratio was similar in the dia-betic and control animal rats (P>0.05, Table 1).
Contractile properties
The results of contractile performances in DIA are shown in Table 2. Pt and P0 expressed per CSA were lower in most of the diabetic rats than in the age-matched control rats. However, Pt was not affected in diabetic rats at 4 weeks after induction. Pt/P0 showed a higher ratio in
the 16wDM group. TPT and HRT significantly
prolonged in DIA of the diabetic rats from 4 weeks to 16 weeks post-treatment of STZ. Additionally, TPT and HRT progressively slowed over the course of the investigation (TPT, 20% by 4 weeks to 37% by 16 weeks; HRT, 16%-30%, respectively). Interestingly, the fatigue index (FI) of DIA demonstrated an increase from 4 weeks to 8 weeks (15.0%-22.3%) and a decline from 12 weeks to 16 weeks (14.7%-22.5%) after induction of diabetes.
The results of contractile measurements in the EDL are shown in Table 3. It seemed that Pt and P0 were significantly reduced and Pt/P0 was higher in diabetes groups. The increase in TPT and HRT induced by diabetes was recorded in the 12wDM group. Regarding FI in EDL, it demonstrated an incremental trend from 6.3%, 9.7%, and 16.0% to 19.1% during the time frame.
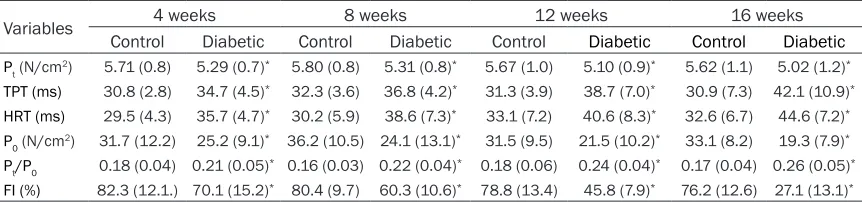
Data of the contractile properties from SOL are summarized in Table 4. Pt and P0 corrected by CSA decreased in the diabetic groups. Pt/P0 was gradually higher accompanying the prog-Table 3. Contractile properties of extensor digitorum longus from the diabetic rats and age-matched controls
Variables 4 weeks 8 weeks 12 weeks 16 weeks
Control Diabetic Control Diabetic Control Diabetic Control Diabetic
Pt (N/cm2) 4.04 (0.84) 3.66 (0.90)* 4.11 (0.93) 3.70 (0.89)* 4.21 (0.79) 3.68 (0.97)* 4.17 (0.91) 3.45 (0.84)*
TPT (ms) 13.4 (0.7) 14.2 (1.1) 13.2 (1.3) 13.9 (0.9) 13.6 (1.1) 14.6 (1.2)* 13.7 (0.8) 15.0 (1.8)*
HRT (ms) 12.9 (0.5) 13.4 (1.4) 13.1 (1.2) 13.7 (1.0) 13.0 (1.3) 14.0 (1.2)* 13.1 (1.1) 14.8 (1.3)*
P0 (N/cm2) 50.1 (8.4) 38.6 (7.3)* 58.7 (12.4) 36.4 (16.3)* 46.8 (7.8) 30.6 (15.3)* 52.1 (12.5) 28.9 (8.9)*
Pt/P0 0.08 (0.02) 0.09 (0.03) 0.07 (0.03) 0.10 (0.04)* 0.09 (0.05) 0.12 (0.04)* 0.08 (0.03) 0.12 (0.01)*
FI (%) 56.3 (8.2) 50 (9.3)* 55.5 (10.2) 45.8 (7.6)* 56.1 (11.1) 40.1 (8.4)* 53.7 (9.6) 34.6 (8.7)*
Data are presented as mean (SD). Statistical analysis was performed by one-way ANOVA with post hoc Bonferroni testing. *P<0.05 versus
[image:5.612.91.523.96.197.2]age-matched controls. ANOVA, Analysis of variance; Pt, twitch tension; TPT, time to peak tension; HRT, half-relaxation time; P0, tetanic tension; Pt/P0, twitch/tetanic ratio. FI, fatigue index, the ratio of tension after 5-minute fatigue protocol to maximal isometric tension.
Table 4. Contractile properties of soleus from diabetic rats and age-matched controls
Variables 4 weeks 8 weeks 12 weeks 16 weeks
Control Diabetic Control Diabetic Control Diabetic Control Diabetic
Pt (N/cm2) 5.71 (0.8) 5.29 (0.7)* 5.80 (0.8) 5.31 (0.8)* 5.67 (1.0) 5.10 (0.9)* 5.62 (1.1) 5.02 (1.2)* TPT (ms) 30.8 (2.8) 34.7 (4.5)* 32.3 (3.6) 36.8 (4.2)* 31.3 (3.9) 38.7 (7.0)* 30.9 (7.3) 42.1 (10.9)*
HRT (ms) 29.5 (4.3) 35.7 (4.7)* 30.2 (5.9) 38.6 (7.3)* 33.1 (7.2) 40.6 (8.3)* 32.6 (6.7) 44.6 (7.2)*
P0 (N/cm2) 31.7 (12.2) 25.2 (9.1)* 36.2 (10.5) 24.1 (13.1)* 31.5 (9.5) 21.5 (10.2)* 33.1 (8.2) 19.3 (7.9)*
Pt/P0 0.18 (0.04) 0.21 (0.05)* 0.16 (0.03) 0.22 (0.04)* 0.18 (0.06) 0.24 (0.04)* 0.17 (0.04) 0.26 (0.05)*
FI (%) 82.3 (12.1.) 70.1 (15.2)* 80.4 (9.7) 60.3 (10.6)* 78.8 (13.4) 45.8 (7.9)* 76.2 (12.6) 27.1 (13.1)*
Data are presented as mean (SD). Statistical analysis was performed by one-way ANOVA with post hoc Bonferroni testing. *P<0.05 versus
[image:5.612.91.522.260.361.2]ress of diabetes. TPT and HRT were longer in the diabetic rat muscles than in the control rat muscles with the progressive character over the duration of diabetes. The SOL endurance was more pronounced than the EDL endurance in the control rats; however, similar to that in EDL, the decreased endurance induced by dia-betes was evidently shown as FI, 12.2% at 4 weeks, 20.1%, 33%, and 49.1% at 8 weeks, 12 weeks, and 16 weeks from experimental mod-els established.
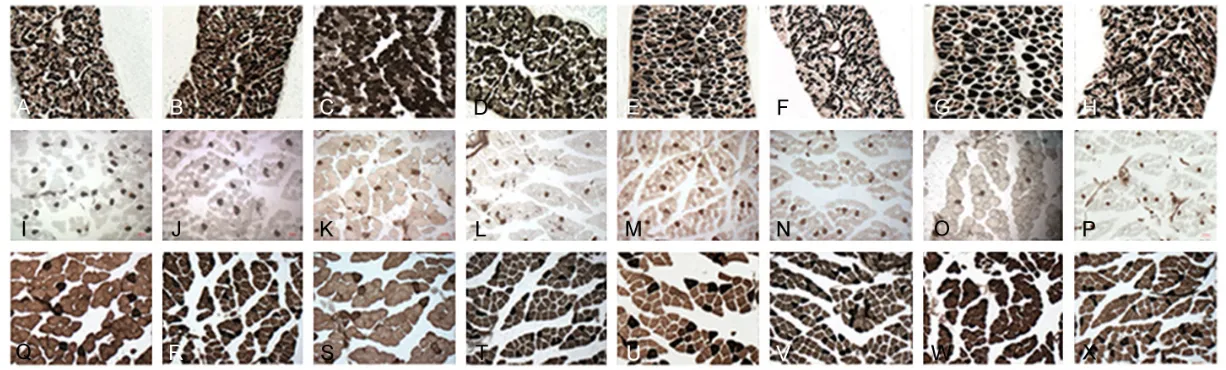
Histochemical study
The morphological analysis of ATPase staining of DIA, EDL, and SOL showed the trend of
switching from type II to type I fibers accompa
-nied by a remarkable decrease in fiber areas
(Figures 1-3).
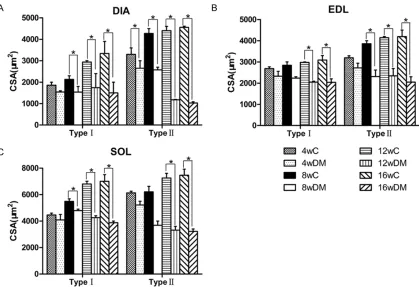
The proportion of type I fibers grew steadily
higher inthe DIA of the diabetic rats than ofthe age-matched control rats (59.9±2.5 versus
52.5±2.3% by 4 weeks; 64.1±2.3 versus
53.4±2.3%, 66.8±3.1 versus 55.8±3.4%, and 69.8±4.9 versus 56.1±5.4% by 8, 12, and 16
weeks, respectively). The areas of type I and
type II fibers reduced by 55% and 77%, respec -tively, at 16 weeks in the diabetic rats.
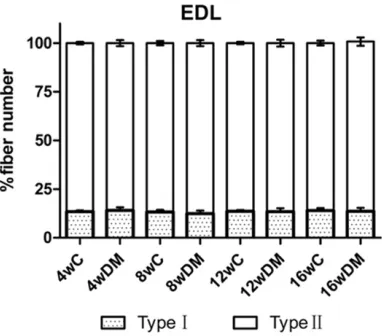
EDL muscles in the diabetic rats revealed a similar composition as in the control rats, with approximately 13% of type I versus 87% of type
II fibers in both groups. Fiber areas of type I fibers were affected by diabetes with a decline of 33%, whereas type II fibers decreased by
51% at 16 weeks.
For SOL muscles, the proportion of type I was
significantly higher in the diabetic rats (83.3±
2.3 versus 75.3±2.2% by 4 weeks; 84.4±3.5
versus 77.3±2.8%, 84.2±1.4 versus 77.9±1.9
%, and 87.5±2.5 versus 79.1±2.0% by 8, 12, 16 weeks, respectively).
There was a 44% reduction in areas of type I
fibers and a 58% decline in areas of type II fibers for the diabetic groups at the end of the
observation.
Discussion
[image:7.612.326.517.77.245.2]Over the period of 16 weeks, the normal incre- ase in body weight observed in the age-match-
Figure 2. Fiber-type proportions in diaphragm
ed rats was lessened by diabetes induced by STZ. Although the diabetic rats failed to main-tain muscle weights of DIA, EDL, and SOL, only
the M/B ratio of EDL showed a significant
decrease, thus indicating preferential
dystro-phy of fast fibers that was reflected in fiber area
determination [7]. However, the M/B ratio of DIA and SOL in the diabetic rats remained simi-lar to the control rats. These results were con-sistent with the previous studies showing that fast twitch muscles were most affected by STZ-induced diabetes [7, 17]. The mechanism un-
derlying the phenomenon is that fast fibers, especially FG fibers, are most susceptible to
the catabolic action of glucocorticoids, which
was testified that the corticosterone plasma
level of diabetic rats rose to 134% of control rats at 33 days after STZ induction [24, 25].
Aside from the largest decline of the type II fiber area, it was established that type I fiber areas
of three kinds of skeletal muscles decreased
significantly, as well, which disaccorded with
previous experiments [7, 26]. The discrepancy
may be due to different ages of the animals observed.
Here in this study, the twitch tensions (Pt and P0) were normalized by CSA, and, therefore, cor-rected for any change in muscle size, to avoid
the influence of muscle size growing larger with
time going on. Pt and P0 are the values repre-senting the capacity of contractile force, depending on the number of myosin heads
bound with the actin filaments and the avail -ability of ATP and Ca2+ in the sarcoplasm [27]. The fast twitch muscles are abundant in type II
fibers, which have the greatest tension-produc -ing capability, depend-ing largely on glycogenol-ysis for ATP production [28]. The most affected
[image:8.612.98.517.74.361.2]type II fibers will lead to the decrease in Pt and P0. Therefore, Pt and P0 of EDL will show a marked decline in diabetes. However, there are contradictory opinions about the changes of Pt and P0 in muscles of diabetic rats. In earlier reports, Pt and P0 of EDL and SOL in diabetic rats remained unchanged; Pt of DIA in diabetic
Figure 3. Fiber diameters in diaphragm (A), extensor digitorum longus (B), and soleus (C) in the diabetic and
rats was similar to that of control rats, while P0 of DIA in diabetic rats decreased [8, 29]. Nonetheless, it was shown that P0 of EDL and SOL in diabetic rats was lower than that of con-trols, and Pt was of no significant decline in dia -betic rats in another investigation [17]. Cotter et al demonstrated the obvious reduction of Pt and P0 in EDL and SOL of diabetic rats com-pared with those of weight-matched controls
[7]. Yet, in the present study, significant
decrease in Pt and P0 of DIA, EDL, and SOL in
diabetic rats was observed. The findings are in
agreement with the morphological results that
both typeI and type II fibers were affected, though type II fibers demonstrated preferential
atrophy. The distinctions may be ascribed to the different control animals and the duration of diabetes. Pt/P0 is defined as a sensitive indi
-cator of changeover from fast to slow fibers. For SOL, the significant changes in Pt/P0 were in
accordance with the conversion in fiber types.
For EDL and DIA, Pt/P0 increased at a later stage of diabetes, indicating the later changes
in muscle fiber types in these two muscles.
The prolongation of TPT and HRT was well established in the current study, which was in accordance with previous reports [7, 27, 29,
30]. The slowing of TPT and HRT may reflect the
loss of fast isomyosins, and the decreases in myosin ATPase, which imply the reduced Ca2+ cycling ability of the SR [7, 27]. TPT represents the rapidity of the release of Ca2+ from the SR, and HRT means the rapidity of Ca2+ pump to transport Ca2+ from the sarcoplasm into the SR [31]. Besides the switching from fast to slow
fibers verified in this investigation, the damage
in myosin ATPase was reported in muscles of diabetic rats,which may result in the changes in TPT and HRT [32].
Regarding FI, ATP exhaustion rate, glycogen stores, oxidative capacity, and Ca2+ release depending on the cAMP-dependent stimulation of uptake and sequestering of Ca2+ in the SR may be relevant for the index. As for SOL and EDL, the lower oxidative capacity and higher
glycogen stores of slow fibers may contribute to
the resistance of SOL to fatigue in normal rats [31]. In STZ-induced diabetes, increased fatiga-bility was documented in SOL and EDL in the current study. The higher rate of ATP exhaus-tion, reduced glycogen stores, increased lac-tate levels, higher oxidative stress, and dimin-ished ability to utilize glycogen in muscles of
diabetic rats may account for the observation [27]. An increase in DIA was reported from 4 weeks to 8 weeks and a decline from 12 weeks to 16 weeks after STZ injection, indicating that DIA of the diabetic rats fatigued even less than that of the age-matched control rats. The inter-esting performance meant that adaptive changes to physiopathologic alterations, such as lack of insulin, occurred in DIA of diabetic rats at the early stage. The result of this study was in accordance with a previous study, in which a greater Ca2+ sensitivity of the skinned
fibers at both 4 and 8 weeks after diabetes than controls was testified [11]. From 12 weeks
to 16 weeks post-diabetes, the adaption was lost and increased fatigability occurred as EDL and SOL. The lower Ca2+ sensitivity of the con-tractile proteins and the loss of cooperativity between the contractile proteins in later stage of diabetes were also recorded [11]. In clinical practice, diabetic patients exhibit increased
muscle fatigability and difficulty in squatting
and in performing repetitive motions [33]. The differences may be relative to the character of DIA, a kind of respiratory muscles. The com-pensatory responses of DIA lead to greater ven-tilation and enhanced muscle function in the early stage of diabetes. While in the later stage, the decompensation of DIA function appears gradually to a deteriorated condition.
In conclusion, STZ-induced diabetes had differ-ential effects on the contractile and histochem-ical properties of DIA, EDL, and SOL in rats. Overall, DIA, EDL, and SOL appeared to suffer from muscle atrophy in terms of lower muscle weight-to-body weightratio and decreased
mus-cle fiber areas. The contractile forces and
speed-related properties were impaired in dia-betic rats. The increased fatigability was dem-onstrated in DIA at a later stage, whereas resis-tance to fatigue in DIA at an early stage of dia-betes was noted. The endurance to fatigue decreased in EDL and SOL, as well. An increased distribution of type I was observed in these muscles. The current study indicated that the differential alterations of contractile properties
were associated with STZ-induced fiber
trans-formation.
Acknowledgements
Disclosure of conflict of interest
None.
Abbreviations
EDL, Extensor digitorum longus muscle; SOL,
soleus muscle; DIA, diaphragm; STZ,
strepto-zotocin; DM, diabetes mellitus; Pt, maximal twitch force; TPT, time to peak tension; HRT, half-relaxation time; FI, fatigue index; P0, the maximal tetanic force; Pt/P0, twitch tension-to-tetanic tension ratio; CSA, cross-sectional area. Address correspondence to: Shitong Li, Department
of Anesthesiology, The Affiliated First People’s
Hospital, School of Medicine, Shanghai Jiaotong University, Shanghai 201620, China. Tel: +86-18001780050; E-mail: [email protected]
References
[1] Shah S, Sonawane P, Nahar P, Buge K and Vaidya S. Are we ignoring diabetic disability: a cross sectional study of diabetic myopathy. Indian J Med Sci 2011; 65: 186-192.
[2] Fuso L, Pitocco D, Longobardi A, Zaccardi F, Contu C, Pozzuto C, Basso S, Varone F, Ghirlanda G and Antonelli Incalzi R. Reduced respiratory muscle strength and endurance in type 2 diabetes mellitus. Diabetes Metab Res Rev 2012; 28: 370-375.
[3] Martinelli AR, Mantovani AM, Nozabieli AJ, Ferreira DM, Barela JA, Camargo MR and Fregonesi CE. Muscle strength and ankle mo-bility for the gait parameters in diabetic neu-ropathies. Foot (Edinb) 2013; 23: 17-21. [4] Chen KH, Cheng ML, Jing YH, Chiu DT, Shiao
MS and Chen JK. Resveratrol ameliorates met-abolic disorders and muscle wasting in strep-tozotocin-induced diabetic rats. Am J Physiol Endocrinol Metab 2011; 301: E853-863. [5] Hulmi JJ, Silvennoinen M, Lehti M, Kivela R
and Kainulainen H. Altered REDD1, myostatin, and Akt/mTOR/FoxO/MAPK signaling in strep-tozotocin-induced diabetic muscle atrophy. Am J Physiol Endocrinol Metab 2012; 302: E307-315.
[6] Murakami S, Fujita N, Kondo H, Takeda I, Mo- mota R, Ohtsuka A and Fujino H. Abnormalities
in the fiber composition and capillary architec -ture in the soleus muscle of type 2 diabe-
tic Goto-Kakizaki rats. ScientificWorldJournal
2012; 2012: 680189.
[7] Cotter M, Cameron NE, Lean DR and Robertson S. Effects of long-term streptozotocin diabetes on the contractile and histochemical proper-ties of rat muscles. Q J Exp Physiol 1989; 74: 65-74.
[8] McGuire M and MacDermott M. The influence
of streptozotocin diabetes and metformin on erythrocyte volume and on the membrane po-tential and the contractile characteristics of the extensor digitorum longus and soleus mus-cles in rats. Exp Physiol 1999; 84: 1051-1058. [9] Brooke MH and Kaiser KK. Muscle fiber types:
how many and what kind? Arch Neurol 1970; 23: 369-379.
[10] Aloisi M. [Intra-tissue specialization of skeletal muscle]. Riv Istochim Norm Patol 1975; 19: 43-49.
[11] Brotto M, Brotto L, Jin JP, Nosek TM and Romani A. Temporal adaptive changes in con-tractility and fatigability of diaphragm muscles from streptozotocin-diabetic rats. J Biomed Biotechnol 2010; 2010: 931903.
[12] Peter JB, Barnard RJ, Edgerton VR, Gillespie CA
and Stempel KE. Metabolic profiles of three fi -ber types of skeletal muscle in guinea pigs and rabbits. Biochemistry 1972; 11: 2627-2633. [13] Sieck GC and Prakash YS. Morphological
adap-tations of neuromuscular junctions depend on
fiber type. Can J Appl Physiol 1997; 22:
197-230.
[14] Trinh HH and Lamb GD. Matching of sarcoplas-mic reticulum and contractile properties in rat
fast- and slow-twitch muscle fibres. Clin Exp
Pharmacol Physiol 2006; 33: 591-600. [15] Salvi N, Guellich A, Michelet P, Demoule A, Le
Guen M, Renou L, Bonne G, Riou B, Langeron O and Coirault C. Upregulation of PPARbeta/ delta is associated with structural and func-tional changes in the type I diabetes rat dia-phragm. PLoS One 2010; 5: e11494.
[16] Cameron NE, Cotter MA and Robertson S. Changes in skeletal muscle contractile proper-ties in streptozocin-induced diabetic rats and role of polyol pathway and hypoinsulinemia. Diabetes 1990; 39: 460-465.
[17] Cotter MA, Cameron NE, Robertson S and Ewing I. Polyol pathway-related skeletal muscle contractile and morphological abnormalities in diabetic rats. Exp Physiol 1993; 78: 139-155. [18] Fahim MA, Hasan MY and Alshuaib WB. Early
morphological remodeling of neuromuscular junction in a murine model of diabetes. J Appl Physiol (1985) 2000; 89: 2235-2240.
[19] Medina Sanchez M, Rodriguez Sanchez C, Vega Alvarez JA and Menendez Pelaez A. Ultrastructural study of neuromuscular junc-tion in rectus femoris muscle of streptozotocin-diabetic rats. Histol Histopathol 1992; 7: 607-610.
[21] Narimatsu E, Niiya T, Kawamata M and Namiki A. Sepsis stage dependently and differentially attenuates the effects of nondepolarizing neuromuscular blockers on the rat diaphragm in vitro. Anesth Analg 2005; 100: 823-829, table of contents.
[22] Oishi PE, Cholsiripunlert S, Gong W, Baker AJ and Bernstein HS. Myo-mechanical analysis of isolated skeletal muscle. J Vis Exp 2011. [23] Brooke MH and Kaiser KK. Three “myosin
ad-enosine triphosphatase” systems: the nature of their pH lability and sulfhydryl dependence. J Histochem Cytochem 1970; 18: 670-672. [24] Goldberg AL and Goodman HM. Relationship
between cortisone and muscle work in deter-mining muscle size. J Physiol 1969; 200: 667-675.
[25] Rhees RW, Wilson CT and Heninger RW.
Influence of streptozotocin diabetes and insu -lin therapy on plasma corticosterone levels in male rats. Horm Metab Res 1983; 15: 353-354.
[26] Hegarty PV and Rosholt MN. Effects of strepto-zotocin-induced diabetes on the number and
diameter of fibres in different skeletal muscles
of the rat. J Anat 1981; 133: 205-211. [27] Bin Aleem S, Hussain MM and Farooq Y.
Levo-carnitine reduces oxidative stress and im-proves contractile functions of fast muscles in type 2 diabetic rats. Iran Biomed J 2013; 17: 29-35.
[28] Amin KA and Nagy MA. Effect of Carnitine and herbal mixture extract on obesity induced by high fat diet in rats. Diabetol Metab Syndr 2009; 1: 17.
[29] McGuire M and MacDermott M. The influence
of streptozotocin-induced diabetes and the antihyperglycaemic agent metformin on the contractile characteristics and the membrane potential of the rat diaphragm. Exp Physiol 1998; 83: 481-487.
[30] Whitman SA, Long M, Wondrak GT, Zheng H and Zhang DD. Nrf2 modulates contractile and metabolic properties of skeletal muscle in streptozotocin-induced diabetic atrophy. Exp Cell Res 2013; 319: 2673-2683.
[31] Warmington SA, Tolan R and McBennett S. Functional and histological characteristics of skeletal muscle and the effects of leptin in the genetically obese (ob/ob) mouse. Int J Obes Relat Metab Disord 2000; 24: 1040-1050. [32] Rothig HJ, Stiller N, Dahlmann B and Reinauer
H. Insulin effect on proteolytic activities in rat skeletal muscle. Horm Metab Res 1978; 10: 101-104.