Multi-document summarization using A* search and discriminative training
Ahmet Aker Trevor Cohn
Department of Computer Science University of Sheffield, Sheffield, S1 4DP, UK
{a.aker, t.cohn, r.gaizauskas}@dcs.shef.ac.uk
Robert Gaizauskas
Abstract
In this paper we address two key challenges for extractive multi-document summarization: the search problem of finding the best scoring summary and the training problem of learn-ing the best model parameters. We propose an A* search algorithm to find the best extractive summary up to a given length, which is both optimal and efficient to run. Further, we pro-pose a discriminative training algorithm which directly maximises the quality of the best sum-mary, rather than assuming a sentence-level
decomposition as in earlier work. Our
ap-proach leads to significantly better results than earlier techniques across a number of evalua-tion metrics.
1 Introduction
Multi-document summarization aims to present multiple documents in form of a short summary. This short summary can be used as a replacement for the original documents to reduce, for instance, the time a reader would spend if she were to read the original documents. Following dominant trends in summarization research (Mani, 2001), we focus solely on extractive summarization which simplifies the summarization task to the problem of identify-ing a subset of units from the document collection (here sentences) which are concatenated to form the summary.
Most multi-document summarization systems de-fine a model which assigns a score to a candidate summary based on the features of the sentences in-cluded in the summary. The research challenges are
then twofold: 1) thesearchproblem of finding the
best scoring summary for a given document set, and
2) the training problem of learning the model
pa-rameters to best describe a training set consisting of pairs of document sets with model or reference sum-maries – typically human authored extractive or ab-stractive summaries.
Search is typically performed by a greedy al-gorithm which selects each sentence in decreasing order of model score until the desired summary length is reached (see, e.g., Saggion (2005)) or us-ing heuristic strategies based on position in docu-ment or lexical clues (Edmundson, 1969; Brandow
et al., 1995; Hearst, 1997; Ouyang et al., 2010).1
We show in this paper that the search problem can be solved optimally and efficiently using A* search (Russell et al., 1995). Assuming the model only uses features local to each sentence in the summary, our algorithm finds the best scoring extractive summary up to a given length in words.
Framing summarization as search suggests that many of the popular training techniques are max-imising the wrong objective. These approaches train a classifier, regression or ranking model to distin-guish between good and bad sentences under an evaluation metric, e.g., ROUGE (Lin, 2004). The model is then used during search to find a summary
composed of high scoring (‘good’) sentences (see
for a review Ouyang et al. (2010)). However, there is a disconnect between the model used for training and the model used for prediction. In this paper we present a solution to this disconnect in the form of a training algorithm that optimises the full predic-tion model directly with the search algorithm intact. The training algorithm learns parameters such that
1
Genetic algorithms have also been devised for solving the search problem (see, e.g., Riedhammer et al. (2008)), however these approaches do not guarantee optimality, nor are they effi-cient enough to be practicable for large datasets.
the best scoring whole summary under the model has a high score under the evaluation metric. We demonstrate that this leads to significantly better test performance than a competitive baseline, to the tune of 3% absolute increase for ROUGE-1, -2 and -SU4.
The paper is structured as follows. Section 2
presents the summarization model. Next in
sec-tion 3 we present an A* search algorithm for finding the best scoring (argmax) summary under the model with a constraint on the maximum summary length. We show that this algorithm performs search effi-ciently, even for very large document sets composed of many sentences. The second contribution of the paper is a new training method which directly opti-mises the summarization system, and is presented in section 4. This uses the minimum error-rate training (MERT) technique from machine translation (Och, 2003) to optimise the summariser’s output to an ar-bitrary evaluation metric. Section 5 describes our experimental setup and section 6 the results. Finally we conclude in section 7.
2 Summarization Model
Extractive multi-document summarization aims to find the most important sentences from a set of doc-uments, which are then collated and presented to the user in form of a short summary. Following the predominant approach to data-driven summari-sation, we define a linear model which scores sum-maries as the weighted sum of their features,
s(y|x) = Φ(x,y)·λ , (1)
where x is the document set, composed of k
sen-tences, y ⊆ {1. . . k} are the set of selected
sen-tence indices,Φ(·,·)is a feature function which re-turns a vector of features for the candidate summary
andλare the model parameters. We further assume
that the features decompose with the sentences in
the summary, Φ(x,y) = P
i∈yφ(xi), and
there-fore the scoring function also decomposes along the same lines,
s(y|x) =X
i∈y
φ(xi)·λ . (2)
While this assumption greatly simplifies inference, it does constrain the representative power of the model by disallowing global features, e.g., those which
measure duplication in the summary.2 Under this
model, the search problem is to solve
ˆ
y= arg max
y
s(y|x) , (3)
for which we develop a best-first algorithm using A* search, as described in section 3. The training
chal-lenge is to find the parameters,λ, to best model the
training set. This is achieved by findingλsuch that
ˆ
y is similar to the gold standard summary
accord-ing to an automatic evaluation metric, as described in section 4.
3 A* Search
The prediction problem is to find the best scoring
extractive summary (see Equation3) up to a given
length,L. At first glance, this appears to be a
sim-ple problem that might be solved efficiently with a greedy algorithm, say by taking the sentences in or-der of decreasing score and stopping just before the summary exceeds the length threshold. However, the greedy algorithm cannot be guaranteed to find the best summary; to do so requires arbitrary back-tracking to revise previous incorrect decisions.
The problem of constructing the summary can be considered a search problem in which we start with an empty summary and incrementally enlarge the summary by concatenating a sentence from our doc-ument set. The search graph starts with an empty summary (the starting state) and each outgoing edge adds a sentence to produce a subsequent state, and is assigned a score under the model. A goal state is any state with no more words than the given thresh-old. The summarisation problem is then equivalent to finding the best scoring path (summed over the edge scores) between the start state and a goal state. The novel insight in our work is to use A* search (Russell et al., 1995) to solve the prediction prob-lem. A* is a best-first search algorithm which can
efficiently find the best scoring path or the n-best
paths (unlike the greedy algorithm which is not op-timal, and the backtracking variant which is not ef-ficient). The search procedure requires a scoring
function for each state, here s(y|x) from (2), and
2
a heuristic function which estimates the additional score to get from a given state to a goal state. For the search to be optimal – guaranteed to find the best scoring path as the first solution – the heuristic must be admissible, meaning that it bounds from above the score for reaching a goal state. We present three different admissible heuristics later in this section, which bound the score with differing tightness and consequently different search cost.
Algorithm 1 presents A* search for our extractive summarisation model. Given a set of sentences to summary, a scoring and a heuristic function, it finds the best scoring summary. This is achieved by build-ing the search graph incrementally, and storbuild-ing each frontier state in a priority queue (line 1) which is sorted by the sum of the state’s score and its heuris-tic. These states are popped off the queue (line 3) and expanded by adding a sentence, which is then added to the schedule (lines 8–14). We designate special finishing states using a boolean variable (the last entry in the tuple in lines 1, 7 and 12).
Fin-ishing states (with value T) denote ceasing to
ex-pand the summary, and consequently their scores
do not include the heuristic component.
When-ever one of these states is popped in line 2, we know that it outscores all competing hypotheses and therefore represents the optimal summary (because the heuristic is guaranteed to never underestimate
the cost to a goal state from an unfinished state).3
Note that in algorithm 1 we create the summary by building a list of sentence indices in sorted or-der to avoid spurious ambiguity which would un-necessarily expand the search space. The function
length(y,x) =P
n∈ylength(xn)returns the length
of sentences specified.
We now return to the problem of defining the
heuristic function,h(y;x, l)which provides an
up-per bound on the additional score achievable in
reaching a goal state from statey. We present three
different variants of increasing fidelity, that is, that bound the cost to a goal state more tightly. Algo-rithm 2 is the simplest, which simply finds the max-imum score per word from the set of unused
sen-3
To improve the efficiency of Algorithm 1 we make a small modification to avoid expanding every possible edge in step 8, of which there areO(k)options. Instead we expand a small number (here, 3) at a time and defer the remaining items until later by inserting a special node into the schedule. These special nodes are represented using a third ‘to-be-continued’ state into the done flag.
Algorithm 1A* search for extractive summarization.
Require: set of sentences,x=x1, . . . , xk Require: scoring functions(·)
Require: heuristic functionh(·)
Require: summary length limitL
1: schedule = [(0,∅,F)] {priority queue of triples} {(A* score, sentence indices, done flag)} 2: whileschedule6=[]do
3: v,y, f ←pop(schedule) 4: iff = Tthen
5: return y {success}
6: else
7: push(schedule,(s(y|x),y,T)) 8: fory←[max(y) + 1, k]do
9: y0←y∪y
10: iflength(y0,x)≤Lthen
11: v0←s(y0|x) +h(y0;x, l)
12: push(schedule,(v0,y0,F)) 13: end if
14: end for
15: end if
16: end while
tences and then extrapolates this out over the re-maining words available to the length threshold. In
the algorithm, we use the shorthandsn=φ(xn)·λ
for sentencen’s score,ln=length(xn)for its length
andly=Pn∈ylnfor the total length of the current
state (unfinished summary).
Algorithm 2Uniform heuristic,h1(y;x, L) Require: xsorted in order of score/length
1: n←max(y) + 1 2: return (L−ly) max
sn
ln,0
Theh1heuristic is overly simple in that it assumes
we can ‘reuse’ a high scoring short sentence many times despite this being disallowed by the model.
For this reason we develop an improved bound,h2,
in Algorithm 3. This incrementally adds each sen-tence in order of its score-per-word until the length
limit is reached. If the limit is to be exceeded,
the heuristic scales down the final sentence’s score based on the fraction of words than can be used to reach the limit.
The fractional usage of the final sentence in h2
could be considered overly optimistic, especially
when the state has length just shy of the limitL. If
the next best ranked sentence is a long one, then it will be used in the heuristic to over-estimate of the state. This is complicated to correct, and doing so exactly would require full backtracking which is in-tractable and would obviate the entire point of using A* search. Instead we use a subtle modification in
Algorithm 3Aggregated heuristic,h2(y;x, L) Require: xsorted in order of score/length
1: v←0 2: l0←ly
3: forn∈[max(y) + 1, k]do
4: ifsn≤0then
5: return v 6: end if
7: ifl0+ln≤Lthen
8: l0←l0+ln 9: v←v+sn 10: else
11: return v+ ln
L−l0sn 12: end if
13: end for
14: return v
instance where the next best score/word sentence is too long, where it skips over these sentences until it finds the best scoring sentence that does fit. This
helps to address the overestimate of h2 and should
therefore lead to a smaller search graph and faster runtime due to its early elimination of dead-ends.
Algorithm 4Agg.+final heuristic,h3(y;x, L)
Require: xsorted in order of score/length 1: n←max(y) + 1
2: ifn≤k ∧ sn>0then
3: ifly+ln≤Lthen
4: return h2(y;x, L)
5: else
6: form∈[n+ 1, k]do
7: ifly+lm≤Lthen
8: return smLl−ly
m 9: end if
10: end for
11: end if
12: end if
13: return 0
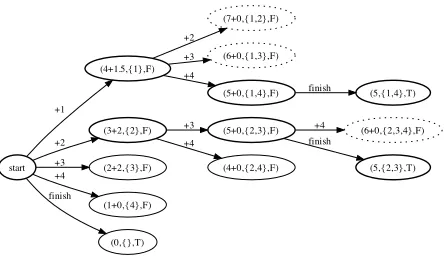
The search process is illustrated in figure 1. When a node is visited in the search, if it satisfied the length constraint then the all its child nodes are added to the schedule. These nodes are scored with the score for the summary thus far plus a heuristic term. For example, the value of 4+1.5=5.5 for the
{1}node arises from a score of 4 plus a heuristic of
(7−5)·34 = 1.5, reflecting the additional score that would arise if it were to use half of the next sentence to finish the summary. Note that in finding the best two summaries the search process did not need to instantiate the full search graph.
To test the efficacy of A* search with each of the different heuristic functions, we now present empir-ical runtime results. We used the training data as described in Section 5.2 and for each document set
start
(4+1.5,{1},F)
+1
(3+2,{2},F) +2
(2+2,{3},F) +3
(1+0,{4},F) +4
(0,{},T) finish
(7+0,{1,2},F)
+2
(6+0,{1,3},F) +3
(5+0,{1,4},F) +4
(5+0,{2,3},F) +3
(4+0,{2,4},F) +4
(5,{1,4},T) finish
(6+0,{2,3,4},F) +4
[image:4.612.320.544.66.196.2](5,{2,3},T) finish
Figure 1: Example of the A* search graph created to find
the two top scoring summaries of length≤7when
sum-marising four sentences with scores of 4, 3, 2 and 1 re-spectively and lengths of 5, 4, 3 and 1 rere-spectively. The
h1 heuristic was used and the score and heuristic scores
are shown separately for clarity. Bold nodes were visited while dashed nodes were visited but found to exceed the length constraint.
generated the 100-best summaries with word limit
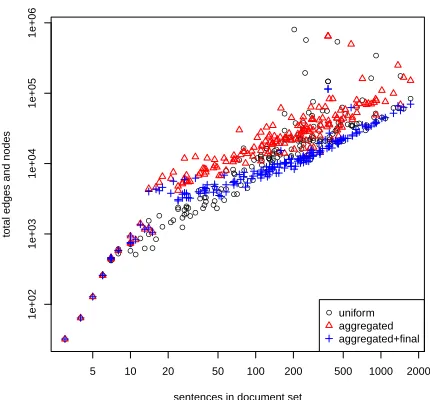
L = 200. Figure 2 shows the number of nodes and edges visited by A* search, reflecting the space and time cost of the algorithm, as a function of the number of sentences in the document set being sum-marised. All three heuristics shown an empirical increase in complexity that is roughly linear in the document size, although there are some notable out-liers, particularly for the uniform heuristic.
Surpris-ingly the aggregated heuristic, h2, is not
consider-ably more efficient than the uniform heuristic h1,
despite bounding the cost more precisely. However,
the aggregated+final heuristic,h3, consistently
out-performs the other two methods. For this reason we
have usedh3in all subsequent experimentation.
4 Training
We frame the training problem as one of finding
model parameters, λ, such that the predicted
out-put, yˆ closely matches the gold standard, r.4 The
quality of the match is measured using an automatic evaluation metric. We adopt the standard machine learning terminology of loss functions, which mea-sure the degree of error in the prediction,∆(ˆy,r). In our case the accuracy is measured by the ROUGE
4The gold standard is typically an abstractive summary, and
● ● ● ● ● ● ● ● ● ● ● ● ● ● ● ● ● ● ● ● ● ● ● ● ● ● ● ● ● ● ● ● ● ● ● ● ● ● ● ● ● ● ● ● ● ● ● ● ● ● ● ● ● ● ● ● ● ● ● ● ● ● ● ● ● ● ● ● ● ● ● ● ● ● ● ● ● ● ● ● ● ● ● ● ● ● ● ● ● ● ● ● ● ● ● ● ● ● ● ● ● ● ● ● ● ● ● ● ● ● ● ● ● ● ● ● ● ● ● ● ● ● ● ●● ● ● ● ● ● ● ● ● ● ● ● ● ● ● ● ● ● ● ● ● ● ● ● ● ● ● ● ● ● ● ● ● ● ● ● ● ● ● ● ● ● ● ● ● ● ● ● ● ● ● ● ● ● ● ● ● ● ● ●
5 10 20 50 100 200 500 1000 2000
1e+02
1e+03
1e+04
1e+05
1e+06
sentences in document set
total edges and nodes
[image:5.612.73.288.73.273.2]● uniform aggregated aggregated+final
Figure 2: Efficiency of A* search search is roughly linear in the number of sentences in the document set. The y axis measures the search graph size in terms of the num-ber of edges in the schedule and the numnum-ber of nodes visited. Measured with the final parameters after training to optimise ROUGE-2 with the three different heuristics and expanding five nodes in each step.
score, R, and the loss is simply 1 - R. The training problem is to solve
ˆ
λ= arg min
λ
∆(ˆy,r) , (4)
where with a slight abuse of notation, yˆ and rare
taken to range over the corpus of many document-sets and summaries.
To optimise the weights we use the minimum er-ror rate training (MERT) technique (Och, 2003), as used for training statistical machine translation sys-tems. This approach is a first order optimization method using Powell search to find the parameters which minimise the loss on the training data. MERT
requires n-best lists which it uses to approximate
the full space of possible outcomes. We use the
A* search algorithm to construct thesen-best lists,5
and use MERT to optimise the ROUGE score on the training set for the R-1, R-2 and R-SU4 variants of the metric.
5We usedn= 100in our experiments.
5 Experimental settings
In this section we describe the features for which we learn weights. We also describe the input data used in training and testing.
5.1 Summarization system
The summarizer we use is an extractive, query-based multi-document summarization system. It is given two inputs: a query (place name) associated with an image and a set of documents. The summarizer uses the following features, as reported in previous work (Edmundson, 1969; Brandow et al., 1995; Radev et al., 2001; Conroy et al., 2005; Aker and Gaizauskas, 2009; Aker and Gaizauskas, 2010a):
• querySimilarity: Sentence similarity to the query (cosine similarity over the vector repre-sentation of the sentence and the query).
• centroidSimilarity: Sentence similarity to the centroid. The centroid is composed of the 100 most frequently occurring non stop words in the document collection (cosine similarity over the vector representation of the sentence and the centroid). For each word/term in the vec-tor we svec-tore a value which is the product of theterm frequencyin the document and the in-verse document frequency, a measurement of the term’s distribution over the set of docu-ments (Salton and Buckley, 1988).
• sentencePosition: Position of the sentence within its document. The first sentence in the document gets the score 1 and the last one gets
1
n where n is the number of sentences in the
document.
• inFirst5: Binary feature indicating whether the sentence occurs is one of the first 5 sentences of the document.
• isStarter: A sentence gets a binary score if it
starts with the query term (e.g. Westminster
Abbey, The Westminster Abbey, The Westmin-sterorThe Abbey) or with the object type, e.g.
The church. We also allow gaps (up to four
words) between theand the query/object type
to capture cases such asThe most magnificent
abbey, etc.
• LMProb: The probability of the sentence
un-der a unigram language model. We trained
church,bridge, etc. When we generate a sum-mary about a location of type church, for in-stance, then we apply the church language model on the related input documents related to the location.6
• sentenceCount: Each sentence gets assigned a
value of1. This feature is used to learn whether
summaries with many sentences are better than summaries with few sentences or vice versa.
• wordCount: Number of words in the summary, to decide whether the model should favor long summaries or short ones.
5.2 Data
For training and testing we use the freely avail-able image description corpus described in Aker and Gaizauskas (2010b). The corpus is based around
289 images of static located objects (e.g Eiffel
Tower,Mont Blanc) each with a manually assigned
place name and object type category (e.g. church,
mountain). For each place name there are up to four model summaries that were created manually after reading existing image descriptions taken from theVirtualTouristtravel community web-site. Each summary contains a minimum of 190 and a maxi-mum of 210 words. We divide this set of 289 place names into training and testing sets. Both sets are described in the following subsections.
Training We use 184 place names from the 289
set for training feature weights. For each
train-ing place name we gather all descriptions
associ-ated with it from VirtualTourist. We compute for
each sentence in each description a ROUGE score by comparing the sentence to those included in the model summaries for that particular place name and retaining the highest score. Table 1 gives some de-tails about this training data.
We use ROUGE as a metric to maximize
be-cause it is also used in DUC7 and TAC.8
How-ever, it should be noted that any automatic metric could be used instead of ROUGE. In particular we use ROUGE 1 (R-1), ROUGE 2 (R-2) and ROUGE SU4 (R-SU4). R-1 and R-2 compute the number
6For our training and testing sets we manually assigned each
location to its corresponding object type (Aker and Gaizauskas, 2009).
7
http://duc.nist.gov/
8http://www.nist.gov/tac/
Max Min Avg
Sentences/place 1724 3 260
Words/sentence 37 3 17
Table 1: The training input data contains 184 place names with 42333 sentences in total. The numbers in the columns give detail about the number of sentences for each place and the lengths of the sentences.
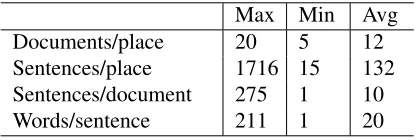
Max Min Avg
Documents/place 20 5 12
Sentences/place 1716 15 132
Sentences/document 275 1 10
[image:6.612.324.533.53.96.2]Words/sentence 211 1 20
Table 2: In domain test data. The numbers in the columns give detail about the number of documents (descriptions) for each place, number of sentences for each place and document (description) and the lengths of the sentences.
of uni-gram and bi-gram overlaps, respectively, be-tween the automatic and model summaries. R-SU4 allows bi-grams to be composed of non-contiguous words, with a maximum of four words between the bi-grams.
Testing For testing purposes we use the rest of the place names (105) from the 289 place name
set. For each place name we use a set of input
documents, generate a summary from these docu-ments using our summarizer and compare the results against model summaries of that place name using ROUGE. We experimented with two different input document types: out of domain and in domain.
[image:6.612.323.533.161.231.2]Max Min Avg
Sentences/place 1773 55 328
Sentence/document 874 1 32
[image:7.612.319.533.53.164.2]Words/sentence 236 1 21
Table 3: Out of domain test data. The numbers in the columns give detail about the number of sentences for each place and document and the lengths of the sentences.
6 Results
To evaluate our approach we used two different as-sessment methods: ROUGE (Lin, 2004) and manual readability. In the following we present the results of each assessment.
6.1 Automatic Evaluation using ROUGE
We report results for training and testing. In
both training and testing we distinguish between
three different summaries: wordLimit,
sentence-Limitandregression. WordLimitandsentenceLimit
summaries are the ones generated using the model trained by MERT. As described in section 4 we trained the summariser using the A* search decoder to maximise the ROUGE score of the best scoring
summaries. We used the heuristic function h3 in
A* search because it is the best performing heuris-tic, and 100-best lists. To experiment with differ-ent summary length conditions we differdiffer-entiate
be-tween summaries with a word limit (wordLimit, set
to 200 words) and summaries containingNnumber
of sentences (sentenceLimit) as stop condition in A*
search. We setNso that in bothwordLimitand
sen-tenceLimit summaries we obtain more or less the same number of words (because our training data contains on average 17 words for each word we set
Nto 12, 12*17=194). However, this is only the case
in the training. In the testing for bothwordLimitand
sentenceLimitwe generate summaries with the same word limit constraint which allows us to have a fair comparison between the ROUGE recall scores.
The regression summaries are our baseline. In these summaries the sentences are ranked based on the weighted features produced by Support
Vec-tor Regression (SVR).9 Ouyang et al. (2010) use
multi-document summarization and linear regres-sion methods to rank sentences in the documents. As regression model they used SVR and showed
9We use the term
regressionto refer to SVR.
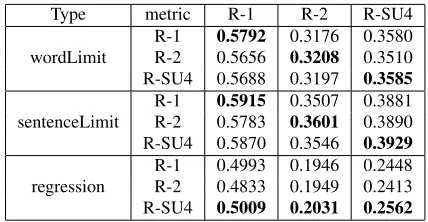
Type metric R-1 R-2 R-SU4
wordLimit
R-1 0.5792 0.3176 0.3580
R-2 0.5656 0.3208 0.3510 R-SU4 0.5688 0.3197 0.3585
sentenceLimit
R-1 0.5915 0.3507 0.3881
R-2 0.5783 0.3601 0.3890 R-SU4 0.5870 0.3546 0.3929
regression
R-1 0.4993 0.1946 0.2448 R-2 0.4833 0.1949 0.2413 R-SU4 0.5009 0.2031 0.2562
Table 4: ROUGE scores obtained on the training data.
that it out-performed classification and Learning To Rank methods on the DUC 2005 to 2007 data. For comparison purpose we use SVR as a baseline sys-tem for learning feature weights. It should be noted that these weights are learned based on single sen-tences. However, to have a fair comparison between all our summary types we use these weights to gen-erate summaries using the A* search with the word limit as constraint. We do this for reporting both for training and testing results.
[image:7.612.81.292.53.110.2]The results for training are shown in Table 4. The table shows ROUGE recall numbers obtained by comparing model summaries against automatically generated summaries on the training data. Because in training we used three different metrics (R-1, R-2, R-SU4) to train weights we report results for each of these three different ROUGE metrics.
In Table 4 we can see that the scores forwordLimit
and sentenceLimit type summaries are always at maximum on the metric they were trained on (this can be observed by following the main diagonal of the result matrix). This confirms that MERT is max-imizing the metric for which it was trained. How-ever, this is not the case for regression results. The scores obtained with R-SU4 metric trained weights achieve higher scores on R-1 and R-2 compared to the scores obtained using weights trained on those
metrics. This is most likely due to SVR being
trained on sentences rather than over entire sum-maries, and thereby not adequately optimising the metric used for evaluation.
Type metric R-1 R-2 R-SU4
wordLimit
R-1 0.3733 0.0842 0.1399
R-2 0.3731 0.0842 0.1402
R-SU4 0.3627 0.0794 0.1340
sentenceLimit
R-1 0.3664 0.0774 0.1321 R-2 0.3559 0.0717 0.1251 R-SU4 0.3629 0.0778 0.1312
regression
[image:8.612.78.291.52.163.2]R-1 0.3431 0.0669 0.1229 R-2 0.2934 0.0560 0.1043 R-SU4 0.3417 0.0668 0.1226
Table 5: ROUGE scores obtained on the testing data. The automated summaries are generated using the in domain input documents.
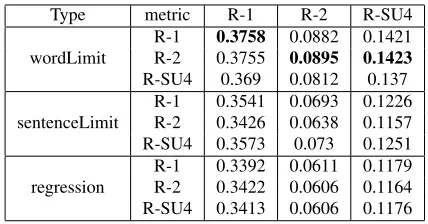
Type metric R-1 R-2 R-SU4
wordLimit
R-1 0.3758 0.0882 0.1421
R-2 0.3755 0.0895 0.1423
R-SU4 0.369 0.0812 0.137
sentenceLimit
R-1 0.3541 0.0693 0.1226 R-2 0.3426 0.0638 0.1157 R-SU4 0.3573 0.073 0.1251
regression
R-1 0.3392 0.0611 0.1179 R-2 0.3422 0.0606 0.1164 R-SU4 0.3413 0.0606 0.1176
Table 6: ROUGE scores obtained on the testing data. The automated summaries are generated using the out of do-main input documents.
of domain data). Again as with the training setting we report results for the different metrics (R-1, R-2, R-SU4) separately.
From Table 5 we can see that thewordLimit
sum-maries score highest compared to the other two types
of summaries. This is different from the
train-ing results wheresentenceLimitsummary type
sum-maries are the top scoring ones. As mentioned
ear-lier thesentenceLimitsummaries contain exactly 12
sentences, where on average each sentence in the
training data has 17 words. We picked 12
sen-tences to achieve roughly the same word limit
con-straint (12×17 = 204) so they can be compared
to the wordLimit and regression type summaries.
However, these sentenceLimit summaries have an
average of 221 words, which explains the higher ROUGE recall scores seen in training compared to testing (where a 200 word limit was imposed).
ThewordLimitsummaries are significantly better than the scores from the other summary types
ir-respective of the evaluation metric.10 It should be
10Significance is reported at level p < 0.001. We used
Wilcoxson signed ranked test to perform significance.
noted that these summaries are the only ones where the training and testing had the same condition in A* search concerning the summary word limit
con-straint. The scores insentenceLimittype summaries
are significantly lower than wordLimit summaries,
despite using MERT to learn the weights. This
shows that training the true model is critical for
getting good accuracy. The regression type
sum-maries achieved the worst ROUGE metric scores. The weights used to generate these summaries were trained on single sentences using SVR. These results indicate that if the goal is to generate high scoring summaries under a length limit in testing, then the same constraint should also be used in training.
From Table 5 and 6 we can see that the summaries obtained from VirtualTourist captions (in domain data) score roughly the same as the summaries gen-erated using web-documents (out of domain data) as input. A possible explanation is that in many cases the VirtualTourist original captions contain text from Wikipedia articles, which are also returned as results from the web search. Therefore the web-document sets included similar content to the VirtualTourist captions.
6.2 Manual Evaluation
We also evaluated our summaries using a readabil-ity assessment as in DUC and TAC. DUC and TAC manually assess the quality of automatically gener-ated summaries by asking human subjects to score
each summary using five criteria –grammaticality,
redundancy, clarity, focus and coherence criteria. Each criterion is scored on a five point scale with high scores indicating a better result (Dang, 2005).
For this evaluation we used the best scoring
sum-maries from thewordLimitsummary type (R-1, R-2
and R-SU4) generated using web-documents (out of domain documents) as input. We also evaluate the
regressionsummary types generated using the same input documents to investigate the correlation be-tween high and low ROUGE metric scores to
man-ual evaluation ones. From the regressionsummary
type we only use summaries under theR2andRSU4
trained models.
In total we evaluated five different summary types
(three from wordLimit and two from regression).
[image:8.612.78.292.218.330.2]Criterion wordLimit regression
R1 R2 RSU4 R2 RSU4
clarity 4.03 3.92 3.99 3.00 2.92 coherence 3.31 3.06 2.99 2.12 1.88
focus 3.79 3.56 3.54 2.44 2.29
[image:9.612.77.298.53.132.2]grammaticality 4.21 4.13 4.13 3.93 3.87 redundancy 4.19 4.33 4.41 4.47 4.44
Table 7: Manual evaluation results for thewordLimit(R1,
R2, RSU4) andregression(R2, RSU4) summary types.
The numbers in the columns are the average scores.
summaries (30 from each summary type) in a ran-dom way and was asked to assess them according to the DUC and TAC manual assessment scheme. The results are shown in Table 7.11
From Table 7 we can see that overall the
wordLimit type summaries perform better than the
regressionones. For each metric inregression sum-mary types (R-2 and R-SU4) we compute the sig-nificance of the difference with the same metrics inwordLimitsummary types.12 The results for the
clarity, coherence and focus criteria in wordLimit
summaries are significantly better than inregression
ones (p<0.001) irrespective of the training metric. These results concur with the automatic evaluation results as described in section 6.1. However, this
is not the case for the grammaticality and
redun-dancy criteria. Although in regression type
sum-maries the scores for the grammaticality criterion
are lower than those in wordLimit summaries the
difference is not significant. Furthermore, we can
see that the redundancyscores for regression
sum-maries are slightly higher than those for wordLimit
summaries.
One reason for these differences might be the
way we trained feature weights for wordLimit and
regression summaries. As mentioned above,
fea-ture weights for wordLimit summaries are trained
using summaries with a specific word limit
con-straint, whereas the weights for theregression
sum-maries are learned using single sentences. Maxi-mizing the ROUGE metrics using “final or output
11
We computed the agreement between the users using intra class correlation with Cronbach’s Alpha where the correlation coefficient ranges between 0 and 1. Numbers close to 1 indicate high correlation and numbers close to 0 indicate low correlation. For the clarity criterion the assessors’ correlation coefficient is 0.547, for coherence 0.687, for focus 0.688, for grammaticality 0.232 and for redundancy 0.453.
12We compute significance test for the manual evaluation
re-sults usingχsquare.
like summaries” will lead to a higher content agree-ment between the training and the model summaries whereas this is not guaranteed with single sentences. With single sentences we have only a guarantee for high content overlap between single training and model sentences. However, when these sentences are combined into summaries it is not guaranteed that these summaries will also have high content overlap with the entire model ones. Therefore we believe if there is a high content agreement between the training and model summaries this could lead to more readable summaries. However, as we can see from Table 7 this hypothesis does not hold for all
criteria. In case of theredundancycriterion we have
compared to wordLimit summary type high scores
in regression summaries although wordLimit
sum-maries are significantly better thanregression ones
when it concerns the ROUGE scores. Thus it is likely that by aggressively optimising the ROUGE metric the model learns to game the metric, which does not penalise redundancy in the summaries. As such it may no longer possible to extrapolate trends from earlier correlation studies against human judgements (Lin, 2004).
To minimize redundancy in summaries it is nec-essary to also take into consideration global features addressing the linguistic aspects of the summaries. Furthermore, instead of ROUGE recall scores which do not take the repetition of information into consid-eration, ROUGE precision scores could be used as a metric in order to minimize the redundant content in the summaries.
7 Conclusion
In this paper we have proposed an A* search ap-proach for generating a summary from a ranked list of sentences and learning feature weights for a fea-ture based extractive multi-document summariza-tion system. We developed an algorithm to learn optimize an arbitrary metric and showed that our approach significantly outperforms state of the art techniques. Furthermore, we highlighted the impor-tance of uniformity in training and testing and ar-gued that if the goal is to generate high scoring sum-maries under a length limit in testing, then the same constraint should also be used in training.
mea-suring lexical diversity in the summaries to reduce the redundancy in them. We will investigate vari-ous ways of incorporating these global features into our A* search. However this will incur an additional computational cost over a purely local feature model and therefore may necessitate using an approximate beam search. We also plan to investigate using other metrics in training in order to reduce redundant in-formation in the summaries. Finally, we have made our summarizer publicly available as open-source software.13
References
A. Aker and R. Gaizauskas. 2009. Summary Gener-ation for Toponym-Referenced Images using Object
Type Language Models. International Conference
on Recent Advances in Natural Language Processing (RANLP) September 14-16, 2009, Borovets, Bulgaria.
A. Aker and R. Gaizauskas. 2010a. Generating
im-age descriptions using dependency relational patterns.
Proc. of the ACL 2010, Upsala, Sweden.
A. Aker and R. Gaizauskas. 2010b. Model Summaries
for Location-related Images. In Proc. of the
LREC-2010 Conference.
R. Brandow, K. Mitze, and L.F. Rau. 1995. Automatic condensation of electronic publications by sentence
selection* 1. Information Processing & Management,
31(5):675–685.
J.M. Conroy, J.D. Schlesinger, and J.G. Stewart. 2005. CLASSY query-based multi-document
summariza-tion. Proc. of the 2005 Document Understanding
Workshop, Boston.
H.T. Dang. 2005. Overview of DUC 2005. DUC 05
Workshop at HLT/EMNLP.
H. Edmundson, P. 1969. New Methods in Automatic
Extracting. Journal of the Association for Computing
Machinery, 16:264–285.
M.A. Hearst. 1997. TextTiling: segmenting text into
multi-paragraph subtopic passages. Computational
linguistics, 23(1):33–64.
C-Y. Lin. 2004. Rouge: A package for automatic
evalua-tion of summaries. Text Summarization Branches Out:
Proc. of the ACL-04 Workshop, pages 74–81.
I. Mani. 2001. Automatic Summarization. John
Ben-jamins Publishing Company.
F.J. Och. 2003. Minimum error rate training in statistical
machine translation. Proc. of the 41st Annual Meeting
on Association for Computational Linguistics-Volume
1, page 167.
13Available from http://www.dcs.shef.ac.uk/
˜tcohn/a-star
Y. Ouyang, W. Li, S. Li, and Q. Lu. 2010. Applying regression models to query-focused multi-document
summarization. Information Processing &
Manage-ment.
D.R. Radev, S. Blair-Goldensohn, and Z. Zhang. 2001. Experiments in single and multi-document
summa-rization using MEAD.Document Understanding
Con-ference.
K. Riedhammer, D. Gillick, B. Favre, and D. Hakkani-T ”ur. 2008. Packing the meeting summarization
knap-sack. Proc. Interspeech, Brisbane, Australia.
S.J. Russell, P. Norvig, J.F. Canny, J. Malik, and D.D.
Edwards. 1995. Artificial intelligence: a modern
ap-proach. Prentice hall Englewood Cliffs, NJ.
H. Saggion. 2005. Topic-based Summarization at
DUC 2005. Document Understanding Conference
(DUC05).
G. Salton and C. Buckley. 1988. Term-weighting
ap-proaches in automatic text retrieval. Information