The interaction between
metabolism and the plasma
membrane potential, and
intracellular pH
Mahmoud Farout, MSc
Thesis submitted for the double degree of
Doctor of Philosophy
undertaken at
Department of Physics Lancaster University
Lancaster, UK
Department of Physics An-Najah Nat. University
Nablus, Palestine
Acknowledgements
I would like to thank my supervisor Professor Aneta Stefanovska for her help and unwavering support throughout my PhD. Without her help, support and time I would not have completed this thesis.
In addition, thanks go to Professor Lars Olsen who provided me with part of the data, and discussed with me part of the analysed results. Thanks also go to Dr Shakil Patel who provided me with the other part of the data analysed in this thesis. I would also like to thank Professor Peter McClintock and Professor Isobel Hook.
I would like to thank Dr Lawrence Sheppard who provided me with Matlab code of harmonics finder and discussed with me the results obtained from my study. Thanks go to Dr Gemma Lancaster for her support in the Matlab. Thanks also go to Dr Julian, Dr Will, Dr Phil, and Rosemary who helped me in proofreading of this thesis.
To my fellow, Aleksandra Pidde, for her time in discussing the results of a part of this work. Many thanks to Dr Yeheven Suprunenko for his help and interesting discussion. I would like also to thank my officemates and friends at Lancaster University; Dr Maxime, Miroslav, Yunus, Federico, Bastian, Hala, Sultan, Joe, Dr Valentina, Dr Boˇstjan and Dr Carlo.
Thanks go to my family who were patients within the period that I spent at Lancaster University. Specially, my wife Lara, my daughters Shushu and Ishraq, and my sons Shams and Habib.
Declaration
Ethics Declaration
The data analysed within this work were collected in accordance with the appro-priate permissions from their respective institutions or committees, as detailed below.
The resting membrane potential data from jurkat T cells used in chapter 5 was recorded by S. Patel as a part of his PhD study at Lancaster University. The data is available via DOI: https://doi.org/10.17635/lancaster/researchdata/249
The glycolytic oscillations data from population of suspensions of yeast cells were measured in Denmark by Professor Lars Olsen, and we received the data from him personally. The data is available via DOI:
List of publications
The following manuscripts are currently under preparation:
A. Pidde, M. Farout, and A. Stefanovska, Fluctuations in the membrane potential in Jurkat cells. In preparation (Work from chapter 5, section 5.1).
M. Farout, L. Olsen and A. Stefanovska, Interaction of metabolism, mitochondrial membrane potential and intracellular pH. In preparation (Work from chapter 5, section 5.2).
Parts of the work have also been presented at the following scientific meetings and workshops:
M. Farout, A. Pidde, S. Patel, J. Owen-Lynch, S. Roberts, and A. Stefanovska. Fluctuations in the resting membrane potential of jurkat T lymphocytes Sixth Palestinian Conference on Modern Trends in Mathematics and Physics PCMTMP-VI, 5-8 August 2018 Palestine, Oral presentation.
Abstract
Hodgkin and Huxley won a Nobel Prize for their passive model of the squid axon. Their model describes the voltage across a cell plasma membrane, based on mea-surements in the squid axon. The model explains the generation of action po-tential. It was published over 60 years ago, however, their model still represents the paradigm in neurobiology [1]. Hodgkin and Huxley used the voltage-clamping method to do their measurements of currents across the membrane of the axon. All measured currents are caused by the diffusion of ions due to their electro-chemical gradients. Due to the voltage-clamping method that they used, there was no need to include active transport in their model, therefore, metabolism was ignored in their study. In reality, metabolism is required to produce ATP, which is required to operate the ATPases that regenerates the electrochemical gradient of the cations Na+ and K+ and results in maintenance of the plasma membrane
analysed using time series analysis methods that allow for time-localised analyses of the underlying dynamics [7, 8, 9]. We will present results of analysis of in-teraction between cellular functional processes and argue that the metabolism is driving them. The results suggest that the mitochondrial F0F1-ATPase might be
Glossary, abbreviations, and notations
Glossary and abbreviations
ACA N-(p-amylcinnamoyl) anthranilic acid; TRPM2 cation channels inhibitor.
ADP adenosine diphosphate. It is required with phosphate to synthesize ATP.
Aerobic respiration a process require energy, therefore it produces energy more than Anaerobic respiration.
AMP adenosine monophosphate is simply the adenosine molecule bonded to only one phosphate group.
Anaerobic respiration a process that does not use oxygen, therefore produces less energy.
Antiporter a protein that is moving two types of ions or molecules in opposite direction using the energy of one of them to move the other one against it electrochemical gradient.
Apoptosis a programmed cell death, abnormally avoided by cancer cells.
ATP adenosine triphosphate, energy currency of the cell. ATP is used as an energy source for many cellular processes such as protein synthesis, mainte-nance of the membrane potential and cell volume regulation.
AVD apoptotic volume decrease.
CFTR cystic fibrosis transmembrane conductance regulator.
Cl−-mini small conductance of Cl− channel.
Cl−-maxi big conductance of Cl− channel.
Cl−swelling a chloride channel which is activated by cell swelling and membrane
Crabtree effect a phenomenon of aerobic fermentation in a high external glucose concentration.
Cotransporter a protein that moves two or more ions or molecules in the same direction utilizing the energy of one or two of them to move the remaining against its electrochemical gradient.
CRAC calcium release-activated channel.
Cytosol the liquid enclosed by the cell membrane which contains the cellular organelles.
Depolarization a process in which the membrane potential becomes less nega-tive.
DiOC2(3) carbocyanine dye which is used to evaluate the mitochondrial
mem-brane potential.
ER Endoplasmic reticulum.
F0F1-ATPase a protein located in the inner membrane of the mitochondria that
synthesize ATP from the proton gradient across that membrane.
FFT fast Fourier transform. An algorithm used to transform a signal from the time domain to the frequency spectrum.
FRET fluorescence resonance energy transfer.
Hyperchloremia an increase in chloride concentration in the blood.
GHK Goldman-Hodgkin-Katz.
HK the altered bath solution with elevated K+used in the jurkat cells experiment.
Hyperglycemia high blood sugar.
Hyperkalaemia an increase in K+ concentration in blood.
Hyperosmotic stress an increase in the number of osmolytes in the medium relative to the cytosol.
Hyperpolarization a process in which the membrane potential becomes more negative.
Hypoglycemia a decrease in glucose level in blood.
Hypokalemia a decrease in potassium concentration in blood.
Hyponatremia a decrease in sodium concentration in blood.
Hypoosmotic stress a decrease in the number of osmolytes in the medium rel-ative to the cytosol.
Hypoxia deprivation of oxygen in the tissues.
in vivo studies on intact living organisms.
Jurkat T cell an immortalized cells which is used as a model in biological studies.
KCa calcium-activated potassium channels.
Kv voltage-gated potassium channels.
Lactate the end product of the fermentation in mammalian cells.
LCl the bath solution with lowered Cl− used in the jurkat cell experiment.
LNa the bath solution with lowered Na+ used in the jurkat cell experiment.
MMP the mitochondrial membrane potential, which is usually more negative inside the matrix of the mitochondria with respect to the cytosol.
NAD+ nicotinamide adenine dinucleotide.
NADH reduced form of nicotinamide adenine dinucleotide (NAD).
NKCC Na+, K+, 2Cl− cotransporter.
Pasteur effect an inhibiting effect of oxygen on the fermentation process.
PFK Phosphofructokinase. It is used in glycolysis to convert fructose-6-phosphate to fructose-1,6-biphosphate.
PKTHPP 1-1-[6-(biphenyl-4-ylcarbonyl)-5,6,7,8-tetrahydropyrido[4,3-d]-pyrimidin-4-yl]piperidin-4-ylpropan-1-one; an inhibitor of leak K+ (TASK) channels.
Plasma membrane a phospholipid bilayer encloses the cell, separating it from its surroundings and contain the pathways through which energy and matter pass into or out of the cell.
pH a logarithmic scale used to specify the acidity or basicity of an aqueous solu-tion.
PMCA plasma membrane calcium pump.
PMP the plasma membrane potential, which represent the voltage difference be-tween the cytosol and the cell surrounding. It is usually negative inside the cell with respect to outside.
Proliferation a process in which the cell number increases as a result of cell growth and division.
Pump or ATPase a protein that hydrolyze ATP to move ions against their electro-chemical gradients.
Pyruvate an end product of breakdown of glucose which can be converted in the cytosol to lactate or transported to the mitochondria and converted to acetyl-CoA to be used in the Krebs cycle.
RVD regulatory volume decrease. A mechanism used by the cell to regulate its volume when it is exposed to hypoosmotic stress.
RVI regulatory volume increase. A mechanism used by the cell to regulate its volume when it is exposed to hyperosmotic stress.
Std standard deviation.
Symport a protein that uses the energy from an ion (molecule) to move another against its electrochemical gradient in the same direction of the first ion.
TAWP time-averaged wavelet power.
TFR time-Frequency Representation.
TRAM-34 1-[(2-chlorophenyl)diphenylmethyl]-1H-pyrazole.
Turgor pressure the pressure exerted on cell membranes or walls by water pass-ing into the cell by osmosis.
UV ultra violet spectrum.
VGSCs voltage-gated sodium channels.
Warburg effect a phenomenon in cancer cells which favor anaerobic glycolysis to produce ATP over the efficient respiratory process.
WFT widowed Fourier transform. Time-frequency representation.
WT wavelet transform. Time-frequency representation.
2DG 2-deoxy-D-glucose, differ from glucose by the removal of an oxygen atom from the hydroxyl group at the 2 position.
Notations
I electrical current
F Faraday constant (96,485 C/mol)
V electrical voltage
C electrical capacitance
G the conductance
Q electric charge
R gas constant (8.314 J. K−1 mol−1)
Contents
1 Introduction 1
1.1 Outline of the thesis . . . 3
2 Biophysical review 4 2.1 Introduction . . . 4
2.2 The biology of yeast Saccharomyces cerevisiae . . . 5
2.2.1 Description and significance . . . 6
2.2.2 Cell Structure . . . 6
Cell envelope . . . 7
The cytoplasm and cytoskeleton . . . 9
The nucleus . . . 10
Vacuoles . . . 10
Mitochondria . . . 10
2.2.3 Translocation of the nutrients into the yeast cell . . . 11
Transport of water . . . 12
2.3 Metabolism . . . 13
2.3.1 Glycolysis . . . 14
2.3.2 Respiration . . . 16
2.4 Ion homoeostases . . . 19
2.4.1 Monovalent cations transport . . . 20
Proton efflux . . . 20
Proton uptake . . . 23
Potassium uptake . . . 25
Potassium efflux . . . 26
2.4.2 Divalent Cations Transport . . . 27
2.4.3 Intracellular transport . . . 29
Transport across the vacuolar membrane . . . 29
Endoplasmic and Golgi apparatus transport system . . . 29
Transport across the mitochondrial membrane . . . 30
2.4.4 How can cells maintain electroneutrality? . . . 30
2.4.5 What are the sources of transport energization? . . . 31
2.5 Membrane potential . . . 33
2.5.1 Introduction . . . 33
2.5.2 Establishment of the membrane potential . . . 35
2.5.3 Membrane composition and ion transporters . . . 39
Ion channels . . . 39
Transporters . . . 40
2.5.4 Resting membrane potential . . . 41
2.5.5 Deviation of MP . . . 43
2.5.6 Cell categorization . . . 45
2.5.7 Membrane model . . . 46
2.5.8 Fluctuations in resting membrane potentials . . . 49
2.5.9 Ion transport in jurkat cells . . . 50
K+ ion channels . . . 54
Na+ ion channels . . . . 55
Cl− ion channels . . . 57
Ca2+ ion channels . . . 59
Other ion channels . . . 60
Plasma membrane potential in apoptosis . . . 61
Plasma membrane potential in cancer . . . 62
2.6 Intracellular pH . . . 62
2.6.1 The effect of pH on glycolysis . . . 64
2.6.2 The effect of pH on cell growth . . . 64
2.6.3 The effect of pH on the plasma membrane potential . . . 65
2.6.4 Regulation of cytosolic pH . . . 66
Buffer capacity . . . 66
Transport system . . . 67
2.7 Mitochondrial membrane potential . . . 70
2.8 Glycolytic oscillations . . . 70
2.8.1 Glycolytic oscillations in intact cells . . . 71
2.9 Summary . . . 73
3 Measurements methods 74 3.1 Whole-cell patch-clamp . . . 74
3.1.1 Measurement protocol and the solutions used . . . 77
3.1.2 Preparation of Jurkat T cells . . . 80
3.2 Fluorescence spectroscopy . . . 80
3.2.1 Introduction . . . 80
3.2.2 Measurements of NADH fluorescence . . . 81
3.2.3 Measurements of ATP . . . 81
Luciferin-luciferase . . . 82
Magnesium-sensitive fluorescent indicator . . . 82
F¨orster resonance energy transfer . . . 83
Aptamer-based biosensors . . . 83
3.2.4 Measurements of MMP . . . 85
3.2.5 Measurements of cytosolic pH . . . 85
3.2.6 Preparation of yeast cells . . . 86
3.3 Summary . . . 86
4 Analysis of dynamical systems 88 4.1 Introduction . . . 89
4.2 Inverse approach to dynamical systems . . . 90
4.2.1 Time-domain . . . 91
4.2.2 Frequency-domain . . . 92
4.2.3 Time-frequency analysis . . . 94
Continuous wavelet transform . . . 94
Wavelet types . . . 96
Mode-extraction . . . 97
Harmonics detection . . . 98
4.2.4 Interactions . . . 99
Wavelet phase coherence . . . 99
4.3 Statistical tests . . . 101
4.3.1 Wilcoxon signed-rank and sum-rank tests . . . 101
4.3.2 Surrogates . . . 102
4.4 Implementation of analysis using simulated examples . . . 104
4.4.1 Time-representation . . . 104
4.4.2 Frequency-representations . . . 106
4.4.3 Time-frequency representations . . . 107
4.4.4 Harmonic detection . . . 109
4.4.5 Interactions: phase coupling . . . 111
5 Analysis and results 113 5.1 Membrane potential . . . 113
5.1.1 Fluctuations in resting membrane potential . . . 114
5.1.2 Hypotheses . . . 115
5.1.3 Experimental Protocol . . . 115
5.1.4 Cells categorisation criteria . . . 116
5.1.5 Analysis and results . . . 116
Pre-processing . . . 116
Statistics . . . 117
Analysis: time-domain representation . . . 117
Analysis of cells categorizations . . . 118
5.1.6 Time-averaged wavelet power analysis . . . 124
5.1.7 Discussion . . . 127
Cohort 1: K+-dominant . . . 129
5.1.8 Summary . . . 132
5.2 Coherence Between NADH and (MMP or pH) . . . 134
5.2.1 Introduction . . . 134
5.2.2 Hypotheses . . . 135
5.2.3 Experimental Protocol . . . 135
5.2.4 Analysis . . . 136
Preprocessing . . . 136
Statistics . . . 136
Analysis . . . 137
5.2.5 Discussion . . . 150
5.2.6 Summary . . . 155
6 Model .. 157
6.1 The model . . . 157
6.2 Discussion . . . 160
6.3 Summary . . . 163
Interaction between metabolism, intracellular pH and the
mitochondrial membrane potential . . . 167
7.1 Original contributions . . . 168
7.2 Future Directions . . . 170
8 Appendices 171 8.1 Appendix A: Derivation of Goldman-Hodgkin-Katz equation . . . . 171
8.2 Appendix B: Fluctuations in membrane potentials . . . 173
8.2.1 Cohort 2: Cl−-dominant . . . 173
8.2.2 Cohort 3: Na+-dominant . . . 177
8.2.3 Discussion of cohort2 and cohort 3 . . . 180
Cl−-dominant) . . . 180
Na+-dominant . . . 184
8.2.4 Time-averaged wavelet power of cohorts 2 And 3) . . . 187
List of Figures
2.1 The structure of a budding yeast cell. . . 6
2.2 mechanisms of nutrients uptake in yeasts. . . 12
2.3 A) Glycolysis....B) Fermentationin. . . 15
2.4 The role of the electrochemical proton gradient . . . 21
2.5 The major plasma membrane and . . . 31
2.6 pH may serve a signaling function . . . 32
2.7 A non-permeable membrane separating . . . 36
2.8 A non-selective permeable membrane separating . . . 37
2.9 A K+ selective membrane separating . . . . 38
2.10 Membrane transport proteins . . . 40
2.11 The electrical equivalent circuit . . . 48
2.12 A model of most transporters expressed in jurkat . . . 53
2.13 A Model of collaboration between vacuolar and plasma . . . 69
3.1 A picture of the patch clamping rig . . . 75
3.2 Whole-cell patch-clamp equivalent . . . 75
4.1 Three simulated examples represented in . . . 105
4.2 The Fourier transform of example 2 . . . 107
4.3 The time-frequency representation of example 2 . . . 108
4.4 The time-frequency representation of example 3 . . . 109
4.5 The time-frequency representation (continuous . . . 110
4.6 Example 1, the mutual information M(φ1, φ2) relative to . . . 110
4.7 x(t), the mutual information M(φ1, φ2) relative to . . . 111
4.8 Wavelet phase coherence between the time series x(t) and y(t) . . . 112
5.1 Significance between each two cases in K-dominant . . . 120
5.2 Recordings of the resting membrane potential (Group G1) . . . 121
5.3 Recordings of the resting membrane potential (group G2) . . . 122
5.4 Recordings of the resting membrane potential (group G3) . . . 123
5.5 Recordings of the resting membrane potential(group G4) . . . 123
5.6 Time-averaged wavelet power (cohort1) . . . 125
5.7 Time-averaged wavelet power . . . 126
5.8 Time-averaged wavelet power . . . 128
5.9 NADH and MMP control . . . 139
5.10 NADH and ATP control . . . 141
5.11 NADH and pH control . . . 142
5.12 The effect of 100µM of azide . . . 144
5.14 The effect of 400µM of azide . . . 146
5.15 The effect of iodoacetate on NADH and MMP . . . 147
5.16 The effect of iodoacetate on pH . . . 148
5.17 The effect of omeprazole on MMP . . . 149
5.18 The effect of omeprazole on pH . . . 150
6.1 Metabolic process in yeast ... . . . 160
6.2 The model of the oscillatory processes ... . . . 161
6.3 A comparison between the time series of the original NADH ... . . 161
6.4 A comparison between the time series of the original MMP ... . . . 162
6.5 A comparison between the time series of the original pH ... . . . . 162
8.1 Significance between each two cases in Cl-dominant . . . 175
8.2 Recordings of the resting membrane potential (group GCl1) . . . . 175
8.3 Recordings of the resting membrane potential (group GCl2) . . . . 176
8.4 Recordings of the resting membrane potential (group GCl3) . . . . 177
8.5 Recordings of the resting membrane potential (group GCl4) . . . . 178
8.6 Significance between each two cases in Na-dominant . . . 179
8.7 Recordings of the resting membrane potential (group GNa1) . . . . 180
8.8 Recordings of the resting membrane potential (group GNa2) . . . . 181
8.9 Recordings of the resting membrane potential (group GNa3) . . . . 181
8.10 Relationship between the amplitude of the resting . . . 183
8.11 Time-averaged wavelet power (cohort2) . . . 189
8.12 Time-averaged wavelet power . . . 190
8.13 Time-averaged wavelet power . . . 191
8.14 Time-averaged wavelet power (cohort3) . . . 192
8.15 Time-averaged wavelet power . . . 193
8.16 Time-averaged wavelet power resting membrane (cohort3) . . . 194
8.17 The effect of azide on ATP . . . 196
8.18 The effect of 250 nM of FCCP . . . 197
8.19 The effect of 500 nM of FCCP . . . 198
8.20 The effect of 1µM of FCCP . . . 199
List of Tables
2.1 Ion channels in jurkat T cell . . . 58
3.1 Intracellular solution used in experiments with jurkat T cell . . . . 78
3.2 Intracellular solution used in experiments with jurkat T cell . . . . 79
3.3 Extracellular solution used in experiments with jurkat T cell . . . . 79
3.4 Extracellular solution used in experiments with jurkat T cell . . . . 79
4.1 Parameters of example (3); (.)i: represents Ai, f1i orf2i . . . 106
5.1 Measured resting membrane potential . . . 119
5.2 Resting membrane potential and standard deviation . . . 120
5.3 The mean of time averaged wavelet power (cohort1) . . . 127
5.4 Driving force and the amplitude (cohort1) . . . 129
8.1 Resting membrane potential and standard deviation in Cl− . . . 174
8.2 Resting membrane potential and standard deviation in Na+ . . . . 179
8.3 Driving force and the amplitude (cohort2) . . . 182
8.4 Driving force and the amplitude (cohort3) . . . 185
8.5 The mean of time averaged wavelet power (cohort2) . . . 188
Chapter 1
Introduction
organism is changing direction of swimming exploiting these fluctuations. They also reported that the amplitude of the fluctuations is magnified when intracel-lular Ca2+ increased significantly. These results suggest that Ca2+ may activate Ca2+-gated K+ channels and, as a result, the membrane conductance may increase
and may cause an increase in the amplitude of membrane potential fluctuations [15]. Majima [16] studied the fluctuations in the resting potential of Paramecium. Majima reported that the amplitude of the fluctuation was between 0.5 and 5.0 mV and the amplitude of fluctuations is proportional to the driving force of K+. Moolenaar et al. [14] reported that the magnification in the amplitude of mem-brane potential fluctuation is the result of an increase in the motive force (driving force) of K+. In another work by Oosawa et al. [17], it was indicated that the
amplitude of fluctuation in the resting potential is proportional to the circulating current. Therefore, there are pieces of evidence that the fluctuations in resting potential are not an artefact of the method but represent an intrinsic mechanism.
The main questions that the present study would like to answer are:
How the energy state of the cell is involved in the membrane potential main-tenance?
How the energy state affects the dynamics of the membrane potential in standard and altered conditions?
1.1
Outline of the thesis
Chapter 2 introduces the physiological background of the work. It starts with the biology of yeastSaccharomyces cerevisiae, then metabolism is discussed, after that ion homoeostasis is introduced. Then, the plasma membrane potential (PMP), pH, cell volume, and the mitochondrial membrane potential (MMP) are discussed. In addition, glycolytic oscillations in yeast cells are also discussed.
Chapter 3 introduces the methods used to measure the dynamics in the plasma membrane potential in jurkat T cells and the methods used to measure the fluo-rescence of the oscillations in NADH, ATP, pH and the mitochondrial membrane potential.
Chapter 4 shows the methods used to analyse the data measured from jurkat T cells and the data measured from synchronized oscillatory yeast cells.
Chapter 5 presents the analysis of the data and the results obtained.
Chapter 6 shows a model of the interaction between glycolysis and both cy-tosolic pH and the mitochondrial membrane potential.
Chapter 7 summarises the work presented in this thesis and discusses possible directions for future research.
Chapter 2
Biophysical review
2.1
Introduction
This chapter presents a biophysical review about the biology of yeast cells including cell structure, metabolism, ion homoeostasis, plasma membrane potential, cytoso-lic pH, cell volume, mitochondrial membrane potential and glycolytic oscillations. The structure of this chapter will be as follow; section 2.2 is about the biology of yeast Saccharomyces cerevisiae. Section 2.3 discusses cell metabolism. In section 2.4, ion homoeostasis is discussed. Section 2.5 is about the plasma membrane potential. Section 2.6 is about the intracellular pH and its regulation. Section 2.7 is about the mitochondrial membrane potential. The glycolytic oscillations are discussed in section 2.8. Finally, the chapter is summarized in section 2.9.
2.2
The biology of yeast
Saccharomyces
cerevisiae
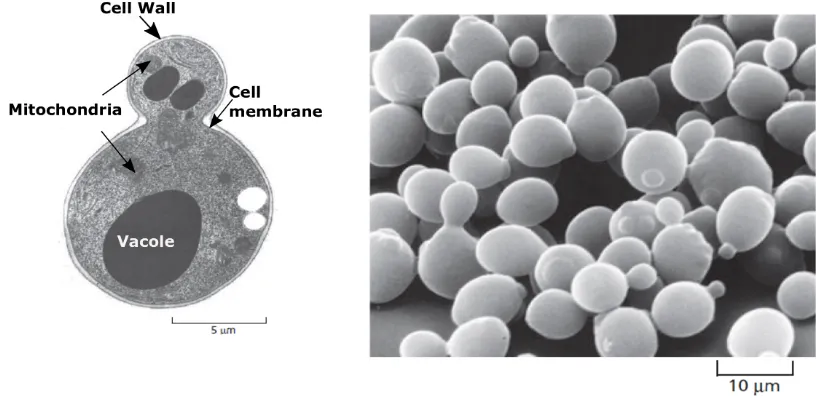
and rapidly reproducible cells such as E. coli or Saccharomyces cerevisiae yeast (budding yeast) [18], see figure 2.1, (B). Yeasts have been known and used for thousands of years in the fermentation process, like alcoholic beverages produc-tion [19]. S. cerevisiae is considered by scientists to be a “model organism”because it is both a unicellular and eukaryotic organism at the same time. It can be cul-tured in an economical manner and generated rapidly (less than 2h under optimal conditions) which make the biological material adequate.
Saccharomyces cerevisiae has become a unicellular model organism in several studies; in ageing [20], mitochondrial biology [21], human medicine such as in brain function, cancer and heart disease [22], osmotic stress [23, 24, 25, 26, 27], cell wall damage [28], numerous applications in the health food industry [19], and glycolytic oscillations and measurements of glycolytic intermediates [29, 30, 31, 32, 4, 33, 5, 34].
The budding or brewster’s yeastS. cerevisiae are commonly employed as mod-els in biomedical and physiological research. Because they are harmless, manipu-lated easily and their genetic systems are able to be traced in the laboratory using fabulous molecular tools [35, 36]. Karathia et. al. (2011) proposed a method to select a model organism and applied it on S. cerevisiae and showed that it is a good model for animals in general andHomo sapiens in particular [37].
2.2.1
Description and significance
environ-Figure 2.1: A) The structure of a budding yeast cell.B) The yeastSaccharomyces cerevisiaeis a model eukaryote. A few yeast cells are seen in the process of dividing, which they do by budding. From [18]
ments [38].
2.2.2
Cell Structure
Saccharomyces cerevisiaeis a unicellular microorganism. It is different from human cells by possessing a rigid wall, so it is relatively immobile and different from plant cells by not possessing chloroplast [18, 39].
However, yeasts, in fact, have the same subcellular structure as multicellular organisms’ cells. Many scientists used it as a model for diverse fundamental and applied fields of life science, biotechnology, and medicine [40]. S. cerevisiae consist of approximately 30% of dry materials, 8% nitrogen, 50% of proteins, 40% of carbohydrates, 5% of lipids, 6% of minerals and vitamins amount depend on the growth condition and the type of the yeast [19].
[image:26.595.112.521.70.271.2]15-17%, nucleus occupied 10.5%, vacuole occupied 5.8% and mitochondria occupied 1.7% in unbudded cells in its G1 phase.
The shape of yeast, as revealed by Leeuwenhoek in 1680, is small spherical or oval bodies [42]. Its mean diameter is ∼ 3.2 µm (major axis ∼ 3.6 µm and the minor axis ∼ 3 µm), its mean volume is ∼ 17 µm3 and the wall thickness is
70-200 nm depending on growth conditions [43? , 41].
In the following, the most related parts of the structure are discussed; cell envelope, the cytoplasm and cytoskeleton, the nucleus, vacuoles, and the mito-chondria.
Cell envelope
In S. cerevisiae, 15% of the cell volume is occupied by the cell envelope which plays a central role in governing the permeability and osmotic properties of the cell. This envelope compromises the plasma membrane, which is surrounding the yeast cytosol, the periplasmic space and cell wall [45].
The plasma membrane in all cells is a very important structure which prevents mixing of the intracellular cytoplasm with the aqueous milieu. It represents the main barrier for passages of hydrophilic molecules. In S. cerevisiae, the plasma membrane is about 7.5 nm thick. It can be depicted by a lipid bilayer interspersed with different functional proteins. These proteins comprise those implicated in solute transport, signal transduction, cell wall biosynthesis, and cytoskeletal an-choring [46].
Signal transduction is another physiological function of the plasma membrane. It operates in response to external stimuli as heat shock, osmotic shift, toxicity, etc. In addition, endocytosis and exocytosis occur through the plasma membrane [47]. At any temperature, the fluidity of the plasma membrane increases with increasing unsaturated alkyl chain content. The length of these chains controls the bilayer thickness. When a cell is exposed to osmotic stress, the membrane lipid composition is altered to make the cell stronger. This suggests that the plasma membrane structure is dynamic to play a role in cell osmoregulation [48]. The periplasm is an outer region of 35-45 Ao that lies external to the plasma membrane and internal to the cell wall, see figure 2.1, (A). It involves the proteins which are secreted through the plasma membrane and are unable to pass the cell wall. These encompass the invertase and phosphatase which are responsible for catalysing substrates that cannot cross the plasma membrane [49]. In contrast to animal cells, yeasts possess cell walls which form a structural feature of all yeasts, see figure 2.1, (A) [40]. The cell wall of yeasts represents a thick (100-200 nm) structure, which forms 15-25% of the total dry mass of the cell. The dominant constituents of the cell wall are glucan (β-1,3 and β-1,6 ) and mannans which account for 80-90% [39, 50, 51, 52].
Glucan forms a strong 3D network which is responsible for the mechanical properties of the wall and provides the attachment sites for mannans which form the outer layer of the wall. Mannans forms a filter for large molecules and makes the permeability of the cell wall to be limited, thus shielding the plasma membrane from any perturbing compound or foreign enzymes. In addition, a third component of the cell wall known as chitin is present in small amounts (1-2%) which is essential in budding and for cell survival [53, 54, 39, 55, 56].
first line of defense against infections [40].
The cytoplasm and cytoskeleton
The yeast cytoplasm, as in all other cellular organisms, is an aqueous acidic fluid which forms the site for many activities happening in the cell. It represents the space for the intracellular low, intermediate molecules, glycogen, dissolved pro-teins, and other macromolecules. In addition, it contains all cell compartments; nucleus, mitochondria, etc. [47].
Compartmentalization inside the cell is an important property of all eukaryotic cells, banning improper meeting of certain compounds within the cytoplasm and facilitating reactions in an efficient order [44]. Each compartment possesses its own membrane to facilitate interactions of the cytoplasm with these compartments to increase the integrity of the cell.
The cytoskeleton network is important in providing an organized structure to the yeast cytoplasm. It comprises microtubules and microfilaments which is common in all eukaryotic cells [46]. The main compartments in cells are discussed in the text that follows.
The nucleus
Vacuoles
A vacuole is one of the membrane-determined compartments in the yeast cyto-plasm. In addition, it serves in cytoplasm’s pH homoeostasis, osmoregulation, protein degradation, and it plays a central role in the storage of small ions, amino acids and phosphates [44].
Mitochondria
Another double membrane-determined compartment in yeasts is the mitochon-drion which is found in higher eukaryotes. Mitochondria comprise an outer brane which contains enzymes implicated in lipid metabolism. Another mem-brane, which is the inner memmem-brane, contains cytochromes of the respiratory chain, NADH and succinate dehydrogenases and H+-ATPase. The intra-mitochondrion
space, known as the matrix, contains enzymes of fatty acids oxidation and the cit-ric acid cycle, together with the machinery of protein synthesis and mitochondrial DNA [46].
Mitochondria number, size and shape in all cells are not fixed. They change according to several factors such as yeast species or strains, growth conditions and even within cell cycle [57].
Figure 2.2: mechanisms of nutrients uptake in yeasts.
2.2.3
Translocation of the nutrients into the yeast cell
Solutes movement faces several barriers; the envelope of the cell which forms three layers; the cell wall, the periplasm and the plasma membrane, and the intracellular organellar membranes [47]. The cell wall cannot be considered as a freely porous structure despite unselectively properties. In addition, it may become weakened and lead to stretching when exposed to stresses. This may increase the permeabil-ity of the cell envelope [46].
A more selective barrier in yeasts is the plasma membrane. This barrier iso-lates the cell from the external environment. Therefore, it dictates nutrients that enter and metabolites that leave the cell [47]. Recognition of how these barriers regulate transport mechanism is very important in yeast physiology. Such mecha-nism controls the rates at which yeast cell can metabolize, grow, divide and adapt to external stresses [46].
There are three main types of processes that enable translocation of substrates across lipid bilayers:
Facilitated diffusion This mechanism is faster than free diffusion. In addition, it is mediated by a carrier protein that undergoes conformational alterations to allow the passage of molecules, see figure 2.2(B). This mechanism is driven by the concentrations gradients and maybe an extra electric gradient in the case of ionic solutes [58, 47].
Active transport This is an energy-dependent chemiosmotic mechanism. It is re-sponsible for the uptake of most required nutrients into yeasts. It moves nutrients against concentration gradients exploiting the membrane potential and the gener-ated transmembrane hydrogen electrochemical gradient by the plasma membrane H-ATPase. The hydrogen (proton) gradient motive force enables uptake of nutri-ents with proton influx as in symport mechanism, or against proton efflux, as in antiport mechanism [47], see figure 2.2, (C).
Transport of water
As in all other organisms, in yeasts, water is essential as a solvent to facilitate the movement of solutes within the cell. In addition, water is important for the intracellular activity of the enzymes. The movement of the water both in and out of the yeast cell is limited by passage through both the plasma membrane and the cell wall through selective pathways known as aquaporins [59]. The force driving water influx in fungal cells is the turgor potential [60], which is created due to a difference between the osmotic potential of the cell and its water potential. InS. cerevisiae, the osmotic potential is generated by the accumulation of solutes from the external medium. When the water potential of the yeast cell is altered from a relatively steady-state condition, yeasts have to adopt this change by sometimes a very rapid response. These quick adjustments have to be by changing to a new osmotic potential by regulating their turgor potential or their cell volume [60].
potential of the growth medium decreases and cellular water will be lost, and the cell will be shrunk. But, when the converse situation happens by rising water potential, the cell will swell, and its volume will increase. In both cases, the cell will respond dramatically using unknown mechanisms to regulate its volume which is necessary for optimal metabolism and growth [46].
In the next sections, metabolism, ion homoeostasis, membrane potential, pH and cell volume will be discussed to understand a possible interaction between these processes through the transport system that derive the energy required to operate from metabolism to regulate the other processes.
2.3
Metabolism
The production of the principal energy currency of the cell (ATP) can be achieved through two main cellular metabolic pathways: glycolysis, and oxidative phosphorylation (OXPHOS). The regulatory mechanism of cellular ATP level in-volves the mutual interactions between these pathways according to demand and supply [4]. In healthy cells, glycolysis, Krebs cycle and OXPHOS are required for ATP production where the later produces more than 90% of the produced energy [67]. In contrast, in metabolically altered cells, glycolysis may dominate the cel-lular energy production even in the presence of oxygen [68]. This phenomenon is known as Warburg effect [69, 70] and favoured in cancer cells [64, 71] and some fermentable yeasts as S. cerevisiae [72, 73]. The chemical reactions of glycolysis occur in the cytoplasm where OXPHOS and Krebs cycle occurs in the matrix of the mitochondria. These processes are considered as the powerhouse of the cell. The rate of ATP production depends on the type of the cell and the conditions of the cell. In physiological conditions, cells produce the higher rate of ATP us-ing glycolysis and respiration. On the other hand, in metabolically altered cells respiration may decrease or is completely disabled, and thus, the rate of ATP production is reduced per glucose consumed. As an example, yeast cells and en-dothelial favour glycolysis which produces 2 ATP/1 glucose over respiration which produces 36 ATP/1 glucose when oxygen is absent, or the cell is in low energy requirements [74, 75].
2.3.1
Glycolysis
Figure 2.3: A) Glycolysis. Adapted from [46]. B) Fermentation in mammalian (left) and in yeast cells (right). Adapted from [76]
reaction [46].
Glucose−→2P yruvate+ 2AT P + 2N ADH+H+. (2.1)
The enzymes that are considered as a key of regulation in glycolysis are phos-phofructokinase and pyruvate kinase. The former activity is influenced by several effectors, including pH [77], ATP [78], AMP [79], and concentrations of intracel-lular ions such as K+, ammonium and inorganic phosphate [80]. It was reported
cannot by itself slow down the glycolysis. Sols and Salas (1966) proposed that the effect of pH on the PFK activity may be due to ATP inhibitory effect which is pH-dependent [82].
2.3.2
Respiration
Respiration is the process that involves chemical reactions that utilize nutrient molecules in living cells to produce energy. Respiration is composed of two types; aerobic and anaerobic. Aerobic respiration is the process that requires oxygen to break down nutrients and release energy. The chemical reaction that represents aerobic respiration is summarized by the equation,
Glucose+oxygen−→water+carbondioxide. (2.2)
These reactions occur in all cells all the time where most of these reactions hap-pen in the mitochondrial matrix. In the presence of oxygen, after the conversion of glucose to pyruvates, ATP and NADH, NAD+ is regenerated by the transfer
of NADH electrons to the respiratory chain proteins. The subsequent respira-tory process reduces the oxygen to water and generates a proton gradient along the inner membrane of the mitochondria. This proton gradient forms a motive force to drive the mitochondrial membrane-enzyme complex, ATP-synthase [83]. Additional ATP molecules, as well as redox equivalents, are produced by the dis-similation of pyruvates, produced by glycolysis, to carbon dioxide and water via the pyruvate dehydrogenase and the tricarboxylic acid cycle. In total, 36 ATP molecules are produced when a one glucose molecule is dissimilated completely [84].
by fructose-1,6-bisphosphate [85]. However, since phosphofructokinase does not catalyze the first irreversible step in the utilization of glucose, and so, some mech-anism should exist to regulate the rate of glucose transport, phosphorylation, or both. As reported by Thevelein (1995) glucose influx into glycolysis is controlled by trehalose-6-phosphate, which may be connected to the mechanism of sensing glucose by cells [86]. Therefore, glycolysis rate can be controlled at the level of the linear reaction pathway starting from extracellular glucose to intracellular pyruvate. In addition, this process may be controlled by the hydrolysis of ATP produced by the process itself, by the maintenance of ion balance, or regulation of pH or cell volume [87]. Another factor that may regulate glycolysis is the re-oxidation of NADH, which is formed by glycolysis, either by respiration or by fermentation [88].
The other respiration type is anaerobic, in which glucose is dissimilated with-out oxygen to produce ATP. This process is known as fermentation in which ethanol is produced by yeast cells and lactic acid by mammalian cells and is out-lined in figure 2.3(B). The switch from aerobic respiration to fermentation is usu-ally controlled by the depletion of oxygen. In this process NADH molecules, which are produced by glycolysis are re-oxidized and pyruvate is converted into ethanol and CO2 by the enzymes pyruvate decarboxylase and alcohol dehydrogenase in the cytoplasm. As a result, 2ATP and 2NAD+ are produced from one glucose
molecule. This process produces the NAD+ required by glycolysis to continue, and this may result in a coupling between glycolysis and fermentation through the oxidation-reduction of NADH molecules [89].
saturation in respiratory routes and an overflow of pyruvate flux. In contrast, Pas-teur effect is a high affinity of respiratory routs for pyruvate, acetaldehyde and/or NADH in the presence of oxygen, therefore alcoholic fermentation is suppressed [88].
The energetically favourable process is respiration, in which dissimilation of carbohydrates requires glycolysis coupling to the Krebs cycle. This route pro-duces approximately 10 times the ATP produced by the fermentation route [84]. Despite the variation in adaptation mechanisms for metabolic needs of each cell, the biochemistry of most metabolic routes is conserved from microorganisms to human. Oxygen depletion switches the metabolic state of the cell from respiration to fermentation. However,S. cerevisiae yeasts switch between metabolic states in response to external glucose level [90, 91]. When the concentration of the external glucose exceeds 0.83 mM, the yeast S. cerevisiae switches the metabolic state to a mixed respire-fermentative state resulting in the production of ethanol [92]. At low external glucose concentration, when oxygen is available,S. cerevisiae inhibits fermentation completely and switches to respiration.
Since yeast cells are usually living in a medium with fluctuating nutrient levels, they require active and rapid mechanisms for adaptation of their metabolism. These mechanisms may ensure sufficient energy supply from various carbon sources to ensure the balance between production and demand to avoid death due to catastrophic loss of energy [93, 86]. Despite respiration being highly energetically favourable, at high growth rate, S. cerevisiae switches to fermentation which can produce ATP at a high rate per mass of enzymes [94]. The enzyme F0F1-ATPase
may play the coordinator role in metabolic trade-off in yeast cells [83].
with glucose and due to the alteration in metabolic state, glycolytic oscillations are initiated which may represent a mechanism of metabolic coordination [95]. All these metabolic adaptive mechanisms are developed by yeast cells to ensure that they can support their functional processes with the energy required (e.g. balance of ions across the plasma membrane, regulation of pH and cell volume, protein synthesis, and growth).
Metabolism is the main source of the energy required by the cell to survive, to proliferate and to function properly through the regulatory processes. These pro-cesses are the ion homoeostasis, which is required in maintenance of the membrane potential, and intracellular pH regulations.
2.4
Ion homoeostases
One of the most important processes for the survival of all organisms is the ho-moeostasis of ions. High intracellular K+and low intracellular Na+ are substantial
for different functional processes (e.g. enzyme activation ‘PFK’, membrane poten-tial, cell volume and internal pH regulation, and protein synthesis [96, 97, 98, 99]. Therefore, yeast cells spend a high percentage of its energy to accumulate K+ and to extrude toxic cations such as Na+ and Li+ [100] to get a high ratio of K+/Na+.
Many physiological processes can be affected by the movement of the ions across the plasma membrane and may also affect the transport process itself. These processes include the cell volume, membrane potential, and pH [100]. The influx of Na+ may be accompanied by a movement of water into the cell and an in-crease of cell volume and this may be followed by an efflux of K+ which results in a membrane hyperpolarization. Another scenario may be an extrusion of Na+
accompanied by an influx of H+ and K+, which result in an acidification of the
ion homoeostasis, it is recommended to understand the relation of these processes to the process of ions transport across the plasma membrane. As a starting point, the transport of cations and anions is discussed to answer the following questions: i. How is electroneutrality maintained by the cell?
ii. What are the mechanisms used by the cell to translocate ions to maintain ion homoeostasis and electroneutrality?
iii. What are the sources of transport energization?
iv. What intracellular processes are coupled to let the cell function properly?
2.4.1
Monovalent cations transport
Nutrients such as amino acids are taken up by symport meaning the translo-cation of the component moving against its concentration gradient is thermody-namically coupled to movement of a component along its concentration gradient. In the case of amino acids, amino acid movement is coupled to H+ uptake or to K+. Therefore, the uptake and efflux of these components are discussed in this section. The uptake of these ions is important in the generation of the plasma membrane and pH regulation in yeast cells [101, 47].
Proton efflux
In all living cells, electrochemical gradients of ions across membranes are present as universal features. Different methods of energizations are involved in generating these electrochemical gradients and the most widely used is ATP hydrolysis to pump H+, Na+, K+ or Ca2+. These gradients have very crucial physiological roles: to drive nutrients and ions transport (see fig 2.4), to regulate turgor pressure and cell volume, and to regulate the activity of sensitive cytosolic enzyme, which may be affected by the change in intracellular ion concentrations (i.e. PFK) [102].
Figure 2.4: The role of the electrochemical proton gradient generated by the primary active transport of the H+-ATPase in driving secondary active transport
processes; S: neutral solute (e.g. neutral amino acids), A-: anionic solute (e.g. Cl−) and C+: cationic solute (e.g. K+). From [102].
of the medium observed by fermentable yeast cells [102]. Addition of glucose to the medium results in medium acidification, which suggests an activation of the proton pump by glucose. The addition of arsenate or H+-ATPase inhibitors to the medium reduces the acidity because both reduce the proton efflux, but arsenate mechanism is completely different from ATPase inhibitors; arsenate reduces the level of ATP which results in a reduction of the ATPase activity [103].
The H+-ATPase has a very high capacity with a maximum flux ranging from
30 picomole/cm2/sec in yeast [103] to 200 picomole/cm2/sec in Neurospora [104]. With stoichiometry of 1proton/ 1ATP [105], the maximum activity may consume 40-60% of the total ATP produced [102]. The activity of this pump is controlled by two factors:
The intracellular/extracellular H+ ratio (or pH in and out of the cell with
the membrane potential).
Glucose concentration, which activates the pump when added to the yeast cells [102].
Therefore, when glucose is added to a medium containing K+, a high activity
membrane depolarization when the extracellular concentration of K+ is elevated [103]. As mentioned before the proton pump is a major ATP consumer in yeast cells. This was observed by the decrease in ATP level after activation of the pump by the addition of glucose [5], raising medium pH [106], adding potassium [107] or addition of uncouplers diethylstilbestrol and dicyclohexylcarbodiimide which in-hibit the plasma membrane ATPase with interference with the energy metabolism of the cell [103].
The H+-ATPase plays a substantial role in the survival of the cell by the pro-duction of the proton gradient and membrane potential which drive three electrical types of nutrient uptake [47]. The first type is the uptake of sugars and neutral amino acids via protons, which is driven by both the membrane potential and pH gradient. The second type is the uptake of anions (Cl−, phosphate, sulphate and anionic amino acids) via protons, which may be driven by pH gradient or with membrane potential dependent on the stoichiometry of the cotransporter. The third type is the uptake of cations (K+, Na+, Ca2+, Mg2+ and cationic amino acids), which is driven by the membrane potential and affected by pH gradient as will be discussed later in this section [102]. The uptake of nutrients coupled to protons is activated by the acidity of the medium and inhibited by the acidity of the cytosol in energy-deprived yeast cells.
In addition to nutrient uptake, the proton gradient is involved in the extrusion of undesirable or toxic substances; Na+ and Ca2+effluxes are affected by exchange with H+ [47].
may result in in-establishment of proton gradient and would mainly affect proton coupled transport. Therefore, due to the complexity of the cell’s cytosolic contents the interaction of omeprazole with cell growth is not easily linked with one of these processes.
In conclusion, the activity of pma1 is a prerequisite for the growth of yeast cells. Since the proton gradient generated by the activity of pma1 is involved in nutrient uptake, turgor pressure [109], pH [110] and ionic distribution, all are necessary for cell growth. A transient cytosolic alkalinization was observed at the initiation of the cell cycle in yeast cells [111], which supports the inhibitory effect of omeprazole onS. cerevisiae growth [108]. The maintenance of electroneutrality during proton extrusion can be achieved by an influx of K+or an efflux of succinate
[112]. But, since the biosynthesis of succinate from glucose is very slow and the proton extrusion is very rapid, the exchange with K+ is the more efficient option.
This exchange has been observed [113]. If the K+ is absent, then the electrical balance is absent. Therefore, the proton pump will generate an electrical potential which will inhibit further activity of the pump. In the presence of K+, the potential created by the pump will drive the influx of K+, which will discharge potential,
and the activity of the pump will continue; this indicates that K+ plays a role in
the regulation of the pump’s activity [102].
Proton uptake
The proton gradient, generated by the H+-ATPase, is the major source of energy
cytosol [114]. Therefore, the increase in the Nha1 activity results in counterbalance of K+ uptake and restores the cytosolic pH [115, 116]. Two protons are taken into the cell when one Na+ or K+ is extruded, which suggests that this antiporter is electrogenic [117]. Therefore, Nha1 may contribute to the maintenance of the plasma membrane potential, pH regulation and cell volume regulation in saline or osmotic stresses [118, 119].
Phosphate uptake is coupled to protons through the cotransporter Pho84 which is involved in pH regulation. When pH of the medium becomes lower the activity of the Pho84 cotransporter increases and therefore, the cytosolic pH de-creases which may reduce the rate of further phosphate uptake [120, 121]. Cock-burn et. al. (1975) have reported that the uptake of one phosphate is accompanied by the uptake of three protons and an extrusion of two K+ in a non-metabolising
cell [122]. But, in metabolising cells, the stoichiometry is different; with the uptake of one phosphate, it is found that the cell uptakes two protons and extrudes one K+[123]. This cotransporter may result in membrane depolarization and therefore stimulation of H+ pump in metabolising cells.
To sum up, the uptake of protons and other nutrients is coupled to the activity of the proton pump (see Fig. 2.4). Potassium uptake and efflux form part of these activities, since the increase in extracellular K+ stimulates the activity of the
proton pump and the efflux of K+ is involved in nutrients uptake driven by the proton gradient. In the next two subsections, K+ uptake and influx are discussed.
Potassium uptake
coordinated. While fungal cells have different putative K+ uptake transporters which belong to four families, two transporters (TRK and HAK) and two ATPases (ACU and PAT),S. cerevisiae only have TRK transporters [124, 125].
TRK transporters are strictly regulated to maintain the proper intracellular concentrations of K+ in yeast cells (around 200-300 mM) [126, 101, 127, 128, 98].
TRKs are similar to ion channels in their function but they still have the possibility to function as symport [129]. In addition to K+ uptake, TRKs might mediate the transport of Cl−across the plasma membrane of yeast cells [130, 131, 132, 128, 127]. The activity of TRK uniporters is driven by the membrane potential, which is generated by the activity of the plasma membrane H+-ATPase (PMA1) [100].
The high affinity of K+ uptake and the high velocity was attributed to the TRKs.
In trk1,2 mutants, a low-affinity K+ uptake was observed and attributed to the
non-specific channel Ncs1, which is blocked by Ca2+ [133, 134, 135].
The uptake of K+ may be affected by the extracellular concentration of K+, intracellular pH, membrane potential and the surface potential [121]. In addi-tion, an increase in the extracellular Na+ may enhance K+ efflux and inhibit the
uptake of K+. Potassium starvation of yeast cells results in a reduction of K+
concentration to around 100 mM [128]. Acidification of the cytoplasm results in an acceleration of the H+ pump and K+ uptake [136, 137, 138]. The membrane
achieved, which result in cation uptake to maintain electroneutrality. Through this mechanism, the cell prefers TRK system over a symport due to a decrease in the anion dissociation constant.
The K+gradient observed usually with the hyperpolarised membrane potential
can be explained by the existence of the TRKs uniports. But, under certain conditions of low external pH with very low potassium, the membrane potential is less hyperpolarised. Therefore, the uniport could not explain the K+ gradient, and a symporter mediating H+ with K+influxes was proposed, and this was supported by the existence of a K+/H+ symport in Neurospora crassa [139].
To maintain a tightly regulated amount of internal K+ which is required by
the cell to function properly, efflux of K+ is required and is discussed in the next
section.
Potassium efflux
In a yeast cell with diameter of for example 5µm, and with the accepted value for the biological membrane capacity of about 1µf/cm2, when 1 million of monovalent
cations enter the cell a membrane potential of about 100 mV is generated. If this charge translocation is not compensated by a movement of another charge (anions or cations), the velocity of uptake of that cation will decrease and the change in the number of osmolytes inside the cell will cause water influx and an increase in cell volume. Therefore, when the cell uptakes cations, an influx of anions or an efflux of cations is necessary to compensate the change in charge and turgor pressure.
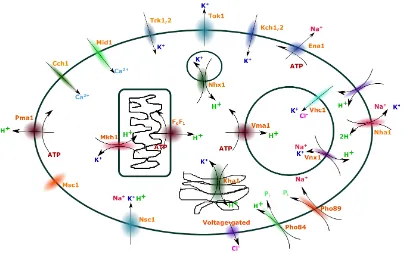
At least three different types of transporters are involved in the K+ efflux. The only specific K+ efflux channel is Tok1, which is present in the plasma membrane
to K+efflux were identified as Na+efflux systems. These are Ena1 and Nha1 which represent an Na+ pump and an Na+/H+antiporter respectively, but both can also mediate the efflux of K+ [144, 145, 146]. The lack of these three transporters causes membrane potential depolarization and the overexpression of Nha1 and Tok1 result in membrane hyperpolarization [147, 118, 119].
In mammalian cells, there are many types of K+ ion channels that participate
in K+ efflux dependent on the physiological conditions. As an example, in jurkat T cells, the voltage-gated K+ channel is activated under physiological conditions (for more detail, see section 2.5.9). But the number of activated ion channels is very small and increasing with membrane depolarization. Another example, also in jurkat T cells, the Ca2+-gated K+ channels which are inactive under physiological
conditions (˜50 nM Ca2+). But, these channels are activated when the intracellular
concentration of Ca2+ is elevated over 200-300 nM and saturated when cytosolic
Ca2+ concentration reaches 1µM (for more details see section 2.5.9).
2.4.2
Divalent Cations Transport
For optimal growth, yeast cells require divalent cations (e.g. Mg2+, Ca2+, Zn2+, Fe2+ and Cu2+). Ca2+ may stimulate metabolism and it is one of the main signal
transduction in most cells. The transport system of most divalent cations involves phosphate absorption by yeast cells [121]. Divalent cations uptake appears to be pH dependent. The uptake of Ni2+ by S. cerevisiae increases with increasing
Ca2+ uptake is stimulated by K+ efflux induced by DI09 [148]. This may be attributed to the negative potential generated by the diffusion of K+, or to the change in surface potential caused by efflux of K+, or to the requirement in charge compensation by the cell to maintain electroneutrality. In contrast, at low FCCP concentration, the cytosol pH increases and the Ca2+ uptake increases, which is
not well understood [148, 4].
Ca2+ is essential in growth of S. cerevisiae, therefore, its regulation is cru-cial. Ca2+ is abundant in yeasts, but the cytosolic Ca2+ concentration is low (50-200 nM) to serve it’s signalling function [149]. To maintain this low concen-tration, exchangers and pumps are required to sequester the surplus of Ca2+ in
intracellular compartments [149]. Cytosolic Ca2+ may increase transiently in some
specific conditions, such as hypertonic shock [150]. Ca2+ signals are generated by
the entrance of Ca2+ through the plasma membrane transporters [151] and/or
re-lease from intracellular storage [152]. Vacuole represents the main Ca2+ store in yeast cells [153].
To maintain electroneutrality, cells extrude monovalent cations when divalent cations are translocated into the cell. In most cases, K+ efflux accompanied the
maintenance of electroneutrality.
2.4.3
Intracellular transport
Other systems that are involved in Na+ detoxification and maintenance of K+ ho-moeostasis are present at the organellar level (vacuolar, mitochondrial and endo-somal and Golgi apparatus). Organellar pH and volume regulations are attributed to the alkali metal cation transport across the membranes of these organelles. Four systems of antiporters that exchange protons with K+ and/or Na+ were described
in the internal compartments ofS. cerevisiae: the endosomal Nhx1 and the Golgi apparatus Kha1 transporters which belong to Na+/H+exchangers [154, 155], Mkh1
H+, and the vacuolar cation/H+. exchanger (Vnx1). The vacuolar proton pump generates the proton gradients across the endosomal, Golgi apparatus and vacuo-lar membranes, and so the activity of their cation/H+ antiporters are functionally interconnected to that pump [156].
Transport across the vacuolar membrane
Rapid Na+ detoxification and intracellular K+ storage is attributed to the vacuole
cation sequestration. The vacuolar cation/H+ antiporter (Vnx1) sequence
corre-sponds to a member of Ca2+/H+ exchange family [157]. Despite that, Vnx1 has
been shown to mediate Na+ and K+ for protons, but not Ca2+. This exchanger
plays different functional roles that are related to the vacuole. These roles include vacuolar volume and pH regulation. In addition, it is expected to be involved in cytosolic pH regulation and ion homoeostasis [100].
Endoplasmic and Golgi apparatus transport system
Yeast cells have three Na+/H+antiporters (Nha1, Nhx1 and Kha1), all are involved in pH regulation and Na+ detoxification under high salt stress. Kha1 is localized to the Golgi body membrane and has the highest similarity to the cation/H+
antiporter of the bacteria [158, 155]. This antiporter is crucial for growth at high extracellular pH. Kha1 mutants show growth deficiency at high medium pH, but this can be suppressed by the addition of KCl which suggest that K+ may be a
major substrate of this exchanger [147].
The first intracellular antiporter discovered in yeast cells was Nhx1, an endoso-mal antiporter exchanging Na+and/or K+with protons [159, 160]. This exchanger
is involved in Na+ detoxification and surplus K+ sequestration. The deletion of
functionally close but in different organelles.
Transport across the mitochondrial membrane
An exchange of K+ and H+ was predicted by Mitchell (1961) [162], and then was confirmed by direct measurements of H+ and K+ fluxes in isolated mitochondria from yeast and other organisms. Mkh1, is an exchange of K+ and H+ localized in the inner membrane of the mitochondria. This exchanger is involved in pH regulation and maintenance of cells membrane potentials [100].
2.4.4
How can cells maintain electroneutrality?
After the previous discussion of the ion transport in S. cerevisiae, it is possible to answer this question. As mentioned in the previous sections, the movement of one of the ions is not separated from the movement of other ions. Therefore, the movement of an ion is coupled to the movement of, at least, another ion to maintain the electroneutrality of the process. As an example, movement of phosphate is accompanied by H+movement through a symport. Another example
is the extrusion of H+using the pump is accompanied by the uptake of K+. The cell
employs the transport system (see figure 2.5) that discriminates between different cations, extrudes toxic and surplus cations and sequesters a part of these cations in internal organelles to provide the cell with sufficient K+/Na+ ratio. This ratio is essential in maintaining cell electroneutrality, preserving membrane potential, regulating cell pH, and keeping higher intracellular turgor pressure.
2.4.5
What are the sources of transport energization?
Figure 2.5: The major plasma membrane and intracellular ion transporters in
S. cerevisiae. This system is responsible for most cellular activities such as pH regulation, ion homoeostasis, etc. The intracellular granules are shown; the vacuole is the larger sphere, the smaller sphere is the nucleus and the other two granules are the mitochondrion and the endoplasmic reticulum.
out of the cell. The extrusion of H+ generates a proton gradient and a potential
across the plasma membrane that form other sources of energy that might be used by the transport system to uptake or extrude nutrients, ions and undesirable sub-stances. The uptake of K+ through trks transporters is driven by a hyperpolarised membrane potential where the electrical force dominates the diffusion force and results in an uptake of potassium across the plasma membrane. On the other hand, the efflux of K+ is driven by the diffusional force produced by the K+ gradient
that is created by K+ homoeostasis system.
While the extrusion of H+ is driven by the hydrolysis of ATP, the uptake of H+ is a diffusion-dependent process. In contrast, the uptake of Na+ is driven by diffusion and the extrusion of toxic Na+ is driven by the energy produced by the
hydrolysis of ATP. The uptake of anions like phosphate and Cl− is driven by the H+ gradient through symports in the plasma membrane.
intracel-Figure 2.6: pH may serve as a signaling function. A) In glucose-starved cells, cytosolic pH is low (pH 6.0) due to a decrease in Pma1 activity. B) In the presence of glucose, the activities of Pma1 and Vma1 increase, and so, the cytosolic pH increases to 7 and the vacuolar pH decreases to 5.6. Both the vacuole and the endoplasmic reticulum have proton pumps which are responsible of protons sequestration to regulate cytosolic pH.
lular pH value. Therefore, the energy state of the cell may affect the cytosolic pH value. As reported by Cyert et al (2013), in the presence of glucose, the ATPases in the plasma and vacuolar membranes are active, and so, cytosolic pH is 7.0-7.2 and vacuolar pH is 5.6. On the other hand, in glucose-starved cells these pumps are inactive due to the limitation in ATP production, and so, cytosolic pH drops to 6.0 and vacuolar pH increases to 5.9 [163], see fig 2.6.
Ion homoeostasis is one of the processes that are strictly regulated in healthy cells to maintain the cell membrane potential. How is cell homoeostasis involved in the maintenance of the membrane potential in an altered cells? To answer this question, ion homoeostasis is discussed in apoptosis and cancer cells.
2.5
Membrane potential
2.5.1
Introduction
All cells, in a unicellular organism (e.g. yeast) and multicellular organisms (i.e. animals and plants), manifest a voltage difference between the intracellular solu-tion and the surrounding medium. This voltage difference is termed membrane potential since it is a potential difference between two solutions separated by the plasma membrane of the cell. The membrane potential is a measure of the po-tential inside the cell relative to the outside ( Vout= 0) and it is usually negative
under physiological conditions which means that the cytoplasm is negative relative to the extracellular solution. When a cell is stimulated, the membrane potential is changed significantly, but when it is at rest (no stimulation) the membrane potential does not significantly changed and this potential is termed the resting membrane potential [164, 165, 166]. However, as we will see below, even unper-turbed it continuously fluctuates/oscillates over time.
repolarization refers to the process in which the membrane returns to its normal resting potential [166].
Living cells are continuously regulating their intracellular concentrations of permeable ions to avoid osmotic stress and changes in cell volume, which affect many cellular functional processes. Consequently, the membrane potential fluctu-ates around a resting value. While the resting potential was studied extensively in most cells, the fluctuations are mainly ignored and are usually considered as noise in membranes [14, 1]. However, if the opening and closing were only random, a resting membrane potential fluctuations with large amplitude would not be gen-erated. Some feedback regulation to amplify the fluctuation seems to be involved in the generation process [15]. In addition, it was proved that they are not an artefact of the method but represent an intrinsic mechanism, when the fluctuation in membrane potential was absent during ionomycin-induced hyper-polarization [171]. These fluctuations may convey information that may help in determining the dynamical behaviour of these cells.
Since ion channels are known to control many physiological processes as heart-beat generation, conduction of nerve impulses, initiation of muscle contraction and hormone secretion, the dysfunction of ion channels is connected with clinical signs in 80% of diseases [172, 173, 174]. The study of electrical properties of the mem-brane and proteins spanning it becomes very important. One of these properties is the resting membrane potential dynamics.
fluctua-tions in resting potential and finally, ion channels in jurkat cell are presented in subsection 2.5.9.
2.5.2
Establishment of the membrane potential
To understand how the membrane potential is established, a hypothetical example is assumed which is composed of two conducting solutions separated by a mem-brane. A sensitive device was added to measure the membrane potential between the two solutions. Suppose that the membrane permeability can be changed and in the first case, the membrane is impermeable to all ions. Assume that the left solution composed of 150 mM KCl and 10 mM NaCl is close to the intracellular cytoplasm and the right solution composed of 150 mM NaCl and 10 mM KCl mimics the extracellular medium of most mammalian cells (Figure 2.7). The val-ues we used are to avoid osmotic forces since the number of solutes used on both sides are equals. In this case, we have electro-neutrality on both sides, and so, the membrane potential will be zero, because the membrane does not allow ions to move in order to create charge separation.
In real cells, the concentration of chloride in extracellular solution is high relative to intracellular. In addition, large proteins carry a high portion while chloride carry a low portion of the intracellular negative charge.
Imagine now that the membrane is permeable to all ions without selectivity (Figure 2.8). In this case, K+will move from left to right and Na+ will move in the opposite direction, both are moving in the directions of their chemical gradient. Chloride in both sides has the same concentration so it is in equilibrium, and will not move. The movement of K+ and Na+ will continue until equilibrium is
established. At equilibrium, the concentration of each ion will be equals on both sides and the system will get neutrality again on both sides, which means that the membrane potential will be zero again due to membrane non-selectivity.
![Figure 2.3: A) Glycolysis. Adapted from [46]. B) Fermentation in mammalian(left) and in yeast cells (right)](https://thumb-us.123doks.com/thumbv2/123dok_us/9302988.430471/35.595.105.521.70.331/figure-glycolysis-adapted-fermentation-mammalian-yeast-cells-right.webp)
![Table 5.2: Resting membrane potential and standard deviation in Kjurkat T cells (Cohort 1), HK: high [K+-dominant+]o, see solutions used in methodology](https://thumb-us.123doks.com/thumbv2/123dok_us/9302988.430471/140.595.218.394.72.299/resting-membrane-potential-standard-deviation-kjurkat-solutions-methodology.webp)