Computational Framework for Heart Disease Prediction
using Deep Belief Neural Network with Fuzzy Logic
S. Saranya
Research Scholar, Department of Computer Science,Arignar Anna Government Arts College, Villupuram, Tamil Nadu, India
R. Manavalan, PhD
Assistant Professor in Computer Science, o/o Head, Department of Computer Applications & Information Technology, Arignar Anna Government
Arts College, Villupuram, Tamil Nadu, India
ABSTRACT
Cardiovascular Disease (CVD) is the main problems of morbidity and mortality in the current lifestyle. The prediction of heart disease is the most complicated task in the field of medical sciences. Data mining techniques have been widely applied in bioinformatics to analyze biomedical data. Today, the field of medicine has come a long way to treat patients with various types of diseases. Heart disease is one of the most threatening diseases that cannot be seen with the naked eye. Poor and incorrect clinical decisions result in the death of a patient who cannot be authorized. Today the health sector contains a large amount of health data, which contain hidden information. Advanced data extraction techniques and computer-generated information are used for predicting heart disease at an earlier stage. In this paper, classification techniques such as Deep Belief Network (DBN) and Fuzzy Deep Belief Network (FDBN) are proposed and analyzed on the cardiovascular disease dataset. The performance of these techniques is evaluated using evaluation parameter such as accuracy and error rate. From the experimental results, it is proved that the accuracy of the Fuzzy Deep Belief network is superior to the Deep Belief network. Further the analysis of the experiment also showed that the FDBN system is one of the best classification models in efficiently predicting cardiovascular diseases with the lowest error rate and maximum accuracy.
Keywords
Heart Disease Prediction System, Deep Belief Network, Fuzzy Deep Belief Network classification algorithm.
1.
INTRODUCTION
Data Mining is an essential process where intelligent methods are required to extract valuable data patterns from huge data set. Heart Diseases remain the biggest cause of deaths for the last two decades. Recently computer technology and machine learning techniques are used to develop software to assist doctors in making decision of heart disease at the early stage. The diagnosis of heart disease is highly depends on clinical and pathological data. Heart disease prediction system can assist medical professionals in predicting heart disease status based on the clinical data of the patients. In biomedical field, data mining plays an essential role for prediction of diseases and staging the same.
In biomedical diagnosis, the information provided by the patients may include redundant and interrelated symptoms and signs especially when the patients suffer from more than one type of disease of the same category. The health care industries are facing many challenges and issues based on the patient’s severity which is to be reduced and detect it earlier in a more effective way. The World Health Organization
(WHO) has estimated that 12 million deaths occur worldwide, every year death rate is increased due to the Heart diseases. In 2008, 17.3 million people died due to Heart Disease. Over 80% of deaths in world are caused only the reason of Heart disease. In 2016, Cardiovascular disease (CVDs) take the lives of 17.9 million people every year, 31% of all global deaths. WHO estimated by 2030, almost 23.6 million people will die due to Heart disease [1]. Data Mining techniques is most efficient techniques used for predicting the heart diseases. The mining of valuable information for diagnosis is not an easy task, since the complexity and toughness of information in medical domain is too high.
Several risk factors for heart disease include i) family history of heart disease, ii). smoking, iii) cholesterol, iv) high blood pressure, v) obesity, vi) diabetes, vii) stress and viii) lack of physical exercise. Heart disease is a broad term that includes all types of diseases affecting different components of the heart.
Some types of heart diseases are i) Coronary Heart Disease, ii) Angina Pectoris, iii) Congestive Heart Failure, iv) Cardiomyopathy, v) Congenital Heart Disease, vi) Arrhythmias and vii) Myocarditis.
1.1
Symptoms of a Heart Attack
The signs and symptoms of Coronary Heart Disease (CHD) may differ between women and men. Some women who have CHD without any signs or symptoms. This is called silent CHD. Silent CHD may not be diagnosed until a woman has signs and symptoms of a heart attack, heart failure, or an Arrhythmia (irregular heartbeat). Symptoms of a heart attack are given below:
Discomfort, pressure, heaviness, or pain in the chest, arm, or below the breastbone.
Discomfort radiating to the back, jaw, throat, or arm. Fullness, indigestion, or choking feeling (may feel like
heartburn).
Sweating, nausea, vomiting, or dizziness.
Extreme weakness, anxiety, or shortness of breath. Rapid or irregular heartbeats.
2.
MATERIAL AND METHODS
The ability to extract useful hidden knowledge in the large amount of data and to act on the same is a challenging task, since growth of the data size is enormously increasing day by day. The need to understand large, complex, enriched information in data sets has now increased in all the varied fields of technology, business, medical and science. The process of developing a novel Computer Based Information System (CBIS) for discovering potentially useful knowledge from data is necessary to increase the life time of the patient. The various data mining techniques introduced so for to heart disease predictions are reviewed extensively here under:
In 2010, Anbarasi et al. [2] proposed enhanced prediction model for Heart Disease through the hybridization of genetic algorithm with Decision Tree for feature subset selection, Genetic with Naive Bayes and Genetic with classification via clustering. The enhanced prediction of heart disease is carried out using genetic algorithm based feature subset selection method with 10 attributes. The prediction accuracy is increased while incorporating classification via clustering with feature subset selection algorithms. Classification techniques such as Naïve Bayes, Decision Tree and Classification by clustering were used for prediction.
Kumari et al. [3] applied data mining techniques such as SVM, ANN, Decision Tree, RIPPER classifier to predict the risk of heart diseases, in 2011. The performance of these algorithms is analyzed using statistical analysis factors such as Accuracy and Error Rate. Accuracy of RIPPER, Decision Tree, ANN and SVM are 81.08%, 79.05%, 80.06% and 84.12% respectively whereas error rates of RIPPER, Decision Tree, ANN and SVM are 2.756, 0.2755, 0.2248 and 0.1588 respectively. The analysis clearly showed that out of these four classification models, SVM predicted cardiovascular disease with least error rate and highest accuracy.
Sundar, et al. [4] discussed the performance analysis of classification techniques Naive Bayes and Weighted Association Classifier (WAC) for heart disease prediction based on evaluation using classification matrix, which revels the frequency of correct and incorrect prediction. Accuracy of WAC and Naive Bayes are 84% and 78% respectively. The accuracy of WAC is 6% higher than Naive Bayes.
In 2012, Dangare et al. [1] used 13 medical related input attributes medical terms such as sex, blood pressure, and cholesterol etc for prediction. To get more appropriate results, additionally added two more important attributes with above attributes i.e. obesity and smoking for heart disease. Multilayer Perceptron Neural Network (MLPNN), Back propagation algorithm is introduced for heart disease. The prediction method yielded the accuracy of 99.25% for 13 attributes and nearly 100% for 15 attributes.
In 2012, Peter et al. [5] introduced the algorithm such as Naive Bayes, Multilayer, J48 and KNN and conducted experimentation on dataset of health care domain. The Correlation based Feature Selection and filter subset evaluation methods are adapted to reduce more number of irrelevant and redundant attributes thereby increases the performance of classifiers. The accuracy of these algorithms are 85.18%, 78.88%, 88.18% and 85.55% respectively and provide the evidence of significant improvement in the results.
In 2012, Shouman et al. [6] proposed the model called as K-Nearest Neighbour for the prediction of heart disease. In this model, the value of K is ranged between one and thirteen.
KNN yielded the accuracy between 94% and 97.4% for different values of K. When K = 7, the method achieved the maximum accuracy and specificity are 97.4% and 99% respectively.
In 2012, Nidhi et al. [7] introduced the algorithms Naïve Bayes, Decision Tree and Neural Network and the same was analyzed. The analysis results showed that the neural network produced at maximum accuracy for 15 attributes i.e. nearly 100%. On the other hand, Decision Tree has also performed well for the same number of attributes and yielded 99.62% of accuracy. Moreover, Genetic Algorithm and Feature Subset Selection methods are used to reduce the number of attributes to six and given as input to classification models. One of the classification model Decision Tree produced almost same accuracy.
In 2012, Pethalakshmi et al. [8] introduced the algorithm such as Fuzzy Decision tree, Fuzzy Naive Bayes, Fuzzy Neural Network, Fuzzy k-means to predict the heart disease. The accuracy of these algorithms were 90.06%, 89.62%, 91.09% and 99.49% respectively. Fuzzy k-means yielded the best result which was at least 8.4% more than others.
In 2013, Abishek [9] proposed J48 and Naive Bayes to predict the Heart disease and adopted Weka tool to implement the above techniques. Accuracy of these algorithms is 95.56% and 92.42% respectively. The accuracy of j48 was 3.14% higher than Naive Bayes algorithm.
In 2013, Chitra et al. [10] implemented the algorithm such as Artificial Neural Network (ANN), K-Means Clustering and Fuzzy C Means Clustering to predict the heart disease. The accuracy of these algorithms were 85%, 88% and 92% respectively. Fuzzy C Means Clustering yielded the best result which is at least 4% more than others.
In 2013, Patel et al. [11] applied the algorithm such as Decision Tree and Naive Bayes to predict the heart disease. The accuracy of these algorithms were 99.2%, 96.5% and 88.3% respectively. Decision Tree yielded the best result which is at least 2.7% more than others.
In 2013, Vikas [12] applied CART Classification to predict the heart disease. Accuracy of the algorithm is 84.49% and the time consumed by the algorithm is 0.23s.
In 2014, Waghulde et al. [13] proposed the models called as Neural Network and Genetic Algorithm for the prediction of heart disease. The accuracy of the system is 98% respectively.
In 2014, Niranjana Devi et al. performed a research work, Evolutionary-Fuzzy Expert System for the Diagnosis of Coronary Artery Disease. In this, a fuzzy expert system with Genetic Algorithm is proposed to diagnose CAD disease condition. Genetic Algorithm is used to optimize the membership function parameters. The proposed system is validated over CAD dataset and achieved an accuracy of 88.79%.
Rupali et al. [15] proposed the Classification based algorithms Naive Bayes and Laplace smoothing are introduced to predict the heart disease in 2014. The accuracy of these algorithms were 78% and 86% respectively. Classification using Laplace Smoothing yielded the best result than others.
In 2015, D’Souza [17] applied three techniques such as Artificial Neural Network, K Means Clustering and Apriori Algorithm to classify whether the patients have the heart disease or not and their performance are analysed. The results showed that Artificial Neural Networks outperform well compare to others.
In 2015, Adbar et al. [18] proposed methods C5.0, Neural Network, SVM, and KNN to predict the risk of heart diseases. Accuracy of c5.0, Neural Network, SVM, and KNN are 93.02%, 89.4%, 86.05% and 80.23% respectively. C5.0 performed well when compared to others. Further, it was also noted that the accuracy of C5.0 is at least 3.62% higher than others.
In 2016, Patel et al. [19] applied methods J48 and LMT algorithm to predict the heart diseases. Performances of these algorithms are analyzed in terms of accuracy and time complexity. The accuracy of J48 and LMT are 56.76% and 55.77% respectively whereas time consumption these algorithms are 0.04s and 0.39s respectively.
In 2016, Rajalakshmi et al. [20] proposed Weighted Association Classifier (WAC) and K-Means Clustering to predict the heart disease. Accuracy of these algorithms is 93.89% and 92.84% respectively. Combination of these algorithms produced maximum accuracy of 94.54%.
In 2016, Suganya et al. [21] proposed CART classifier to predict the heart disease. Minimum distance CART classifier is used to classify the data among various groups. The accuracy of the CART classifier algorithm is 83%.
In 2018, Wadhawan [22] applied combination of K-Means and Apriori Algorithm for heart diseases prediction. The method incurred the accuracy of 74%. The Apriori technique found strong rules for prediction. The proposed method yielded results as good as a neural network.
2.1
Issues in Prediction of Heart Disease
Using Computational Method
From this literature survey, the following issues are identified in heart disease prediction using computational models in health care industry data.
Prediction accuracy is low with reduced number of attributes.
It take more time for predict. More false classification.
The choice of the kernel and other parameter selections.
The limit on ability to categorize correctly. Poor clinical decisions lead to mortality.
The noise and missing vales make a hurdle to design classification model.
The irrelevant or redundant attributes Removal is difficult task.
Accuracy and Speed of the model only for some extents.
The time to construct the model (training time) is high.
Lack of handling noise and missing values
Interpretability i.e. Level of understanding and insight provided by the model.3.
PROPOSED METHOD
3.1
Computational Model for Heart
Disease Prediction
[image:3.595.95.485.487.581.2]The proposed model for Heart Disease Prediction System is developed using Deep Learning approach with fuzzy logic. The Figure 1 is presenting the overall work flow of the proposed system.
Figure 1. Computational Model for Heart Disease Prediction
3.1.1
Deep Belief Network
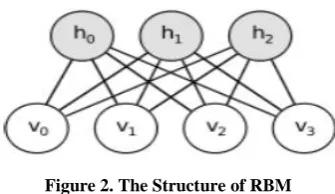
A DBN is a deep learning technique that learns by composing multiple RBM layers. The RBM, which is based on the Hopfield network, uses the energy function and obtains unit values in a probabilistic way (using a Boltzmann distribution). The RBM consists of a visible unit layer and a hidden unit layer.
Figure 2. The Structure of RBM
[image:3.595.344.512.621.718.2]trained via the RBM by giving a new input as a value of hidden layer 1. As such, learning is sequential up to the last layer.
A supervised learning-based classification technique using the DBN is the back propagation algorithm, which is configured in the uppermost layer in the DBN. A classification prediction model using the neural network backpropagation-DBN was implemented for heart disease prediction.
Initially, the DBN built a learning model using a training set. Eight input variables were used (age, sex, chest_pain_type, Trestbps, chol, Fbs, Thalach, Ca) and 1 output data. The DBN consisted of two steps. The first phase was the construction of the RBM network work using unsupervised learning. The RBM parameters such as epoch, batchsize and momentum are set as 1, 10 and 0.5 respectively. In the second phase, the RBM network learned the neural network backward propagation algorithm of supervised learning.
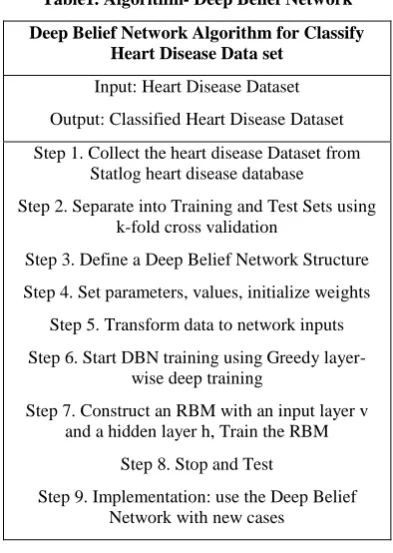
Table1. Algorithm- Deep Belief Network
Deep Belief Network Algorithm for Classify Heart Disease Data set
Input: Heart Disease Dataset
Output: Classified Heart Disease Dataset
Step 1. Collect the heart disease Dataset from Statlog heart disease database
Step 2. Separate into Training and Test Sets using k-fold cross validation
Step 3. Define a Deep Belief Network Structure
Step 4. Set parameters, values, initialize weights
Step 5. Transform data to network inputs
Step 6. Start DBN training using Greedy layer-wise deep training
Step 7. Construct an RBM with an input layer v and a hidden layer h, Train the RBM
Step 8. Stop and Test
Step 9. Implementation: use the Deep Belief Network with new cases
3.1.2
Fuzzy Set
The fuzzy sets are derived from the concept of set theory. Fuzzy sets can be considered an extension of the classic sets. In a classic set (or light set), the set elements are called elements or members of the set. An element x belonging to a set A is defined as X ∈ A, an element that is not a member A is referred to as x ∉ A. A function feature function or membership is defined as an element in the universe U has a crisp value of 1 or 0. For every x ∈ U.
1 for x∈ A
A
(X) =
0
for x ∈A (1) This also can be expressed as ∈For fuzzy sets, membership function takes values in the interval [0, 1]. The interval between 0 and 1 is called membership level or degree of membership.
A fuzzy set A is defined as:
∈ ∈ (2)
where is a membership function belongs to the interval [0, 1].
3.1.2.1
Membership Functions
Membership function describes the composition of the basic elements of the series x in the fuzzy set X, so can assume a large class of functions. Reasonable functions are often linear functions for parts, such as triangular or trapezoidal functions.
Triangular Membership Function: Let a, b, c x be the coordinates of the three vertices of in a fuzzy set A (a: Lower limit c: upper limit, whose degree of belonging is zero, b: center where the degree of belonging is 1).
0 if x ≤ a
A(X) =
[image:4.595.68.265.272.549.2]
0 if x ≥ c (3)
Figure 3. Triangular Membership Function
Table 2. Algorithm- Fuzzy Deep Belief Network
Deep Belief Network Algorithm for Classify Heart Disease Dataset
Input: Heart Disease Dataset
Output: Classified Heart Disease Dataset
Step 1. Collect the heart disease Dataset from Statlog heart disease database
Step 2. Fuzzy Membership function is applied to remove the uncertainty in the data
k-fold cross validation
Step 4. Define a Deep Belief Network Structure
Step 5. Set parameters, values, initialize weights
Step 6. Transform data to network inputs
Step 7. Start DBN training using Greedy layer-wise deep training
Step 8. Construct an RBM with an input layer v and a hidden layer h, Train the
Step 9. Stop and Test
Step 10. Implementation: use the Deep Belief Network with new cases
4.
EXPERIMENTAL RESULT AND
ANALYSIS
4.1
Data Source
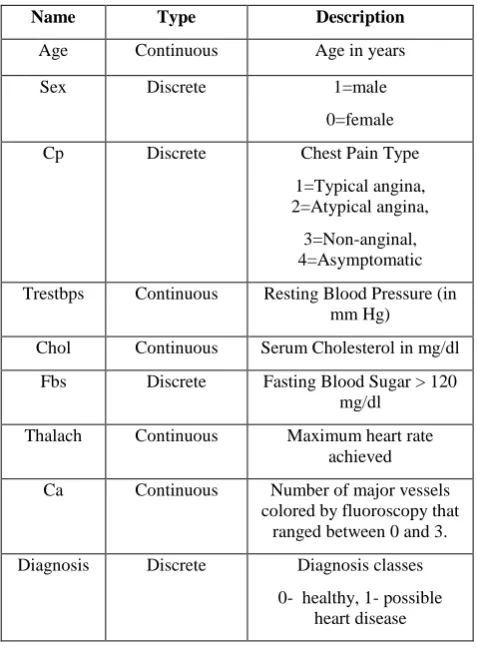
A total (factors) were obtained from UCI/heart-statlog.arff. The dataset consists of 13 attributes and 270 records. However, only 9 attributes are used for this research.
[image:5.595.48.287.391.716.2]The attribute “Diagnosis” was identified as the predictable attribute with value “1” for patients with heart disease and value “0” for patient with no heart disease. The key attribute and their type with description is shown in table 3.
Table 3. Selected Attribute for Heart Disease Prediction
Name Type Description
Age Continuous Age in years
Sex Discrete 1=male
0=female
Cp Discrete Chest Pain Type
1=Typical angina, 2=Atypical angina,
3=Non-anginal, 4=Asymptomatic
Trestbps Continuous Resting Blood Pressure (in mm Hg)
Chol Continuous Serum Cholesterol in mg/dl
Fbs Discrete Fasting Blood Sugar > 120 mg/dl
Thalach Continuous Maximum heart rate achieved
Ca Continuous Number of major vessels colored by fluoroscopy that
ranged between 0 and 3.
Diagnosis Discrete Diagnosis classes
0- healthy, 1- possible heart disease
4.2
Cross-Validation
Cross-Validation is one of the statistical methods used for evaluating the performance of learning algorithms by dividing input data into two segments: one used to train a model and the other used to validate the model. In typical cross-validation, the training and validation sets must cross-over in successive rounds such that each data point has a chance of being validated against. The basic form of the cross-validation is k-fold cross-validation.
In k-fold cross-validation the data is first partitioned into k equally (or nearly equally) sized segments or folds. Subsequently, k iterations of training and validation are performed such that each iteration a different fold of the data is held-out for validation while the remaining k-1 folds are used for learning. In data mining and machine learning 10-fold cross-validation (k= 10) is the most common for the evaluation of classification algorithms.
Cross-validation is used to evaluate or compare learning algorithms as follows: in each iteration, one or more learning algorithms use k-1 folds of data to learn one or more models, and subsequently, the learned models are asked to make predictions about the data in the validation fold. The performance of each learning algorithm on each fold can be tracked using some pre-determined performance metric like accuracy.
4.3
Evaluation of Classification Algorithm:
Accuracy: The accuracy of a test is the ability to differentiate the patient and healthy cases correctly. To estimate the accuracy of a test, the proportion of true positive and true negative is compared for all evaluated cases. Mathematically, this can be stated as:
The Misclassification Rate can be stated as
True Positive (TP) = the number of cases correctly identified as patient
False Positive (FP) = the number of cases incorrectly identified as patient
True Negative (TN) = the number of cases correctly identified as healthy
False Negative (FN) = the number of cases incorrectly identified as healthy
4.4
Result and Discussion
This section presents the experimental results and analysis done for this study. The research work, two classification models such as DBN and Fuzzy DBN were evaluated. Using 10 fold validation to access the performance of them. The proposed algorithms are implemented using MATLAB.
Table 4. Accuracy of 10-fold validation
FOLD
METHOD
Deep Belief Network
Fuzzy Deep Belief Network
1 0.6667 0.963
2 0.8148 0.8889
3 0.7407 0.8519
4 0.7407 0.8889
5 0.7037 0.9259
6 0.7037 0.9259
7 0.6667 0.8889
8 0.7778 0.963
9 0.7037 0.8519
10 0.6667 0.9259
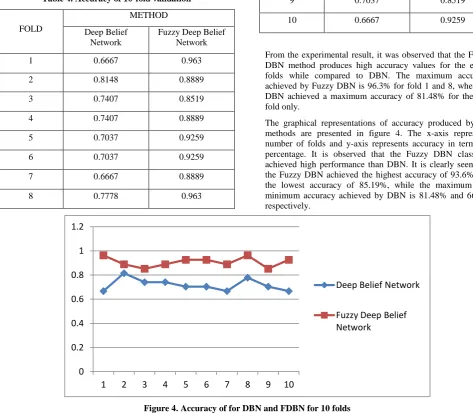
From the experimental result, it was observed that the Fuzzy DBN method produces high accuracy values for the entire folds while compared to DBN. The maximum accuracy achieved by Fuzzy DBN is 96.3% for fold 1 and 8, where as DBN achieved a maximum accuracy of 81.48% for the 2nd fold only.
The graphical representations of accuracy produced by the methods are presented in figure 4. The x-axis represents number of folds and y-axis represents accuracy in terms of percentage. It is observed that the Fuzzy DBN classifier achieved high performance than DBN. It is clearly seen that the Fuzzy DBN achieved the highest accuracy of 93.6% and the lowest accuracy of 85.19%, while the maximum and minimum accuracy achieved by DBN is 81.48% and 66.6% respectively.
Figure 4. Accuracy of for DBN and FDBN for 10 folds
[image:6.595.332.524.501.607.2]The error rate for Deep Belief Network and Fuzzy Deep Belief Network for the 10 folds are shown in table 5.
Table 5. Error Rate of 10-fold validation
FOLD
METHOD
Deep Belief Network
Fuzzy Deep Belief Network
1 0.3333 0.037
2 0.1852 0.1111
3 0.2593 0.1481
4 0.2593 0.1111
5 0.2963 0.0741
6 0.2963 0.0741
7 0.3333 0.1111
8 0.2222 0.037
9 0.2963 0.1481
10 0.3333 0.0741
Table 5 shows that Fuzzy DBN method produces low error values for all folds when compared to DBN. Fuzzy DBN heart disease prediction technique achieved lowest error value of 0.037 for Fold 1 and Fold 8.
The graphical representation of error value produced by the methods while evaluate the heart disease dataset using DBN and FDBN is presented in figure 5.
0 0.2 0.4 0.6 0.8 1 1.2
1 2 3 4 5 6 7 8 9 10
Deep Belief Network
[image:6.595.73.262.537.705.2]Figure 5. Error Rate Comparison for DBN and FDBN
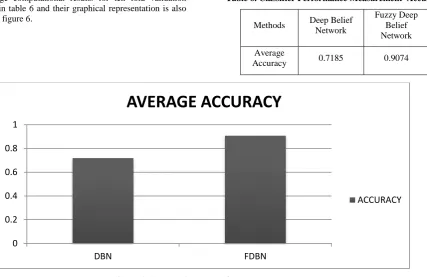
[image:7.595.93.521.242.519.2]The average computational results for ten fold validation presented in table 6 and their graphical representation is also exposed in figure 6.
Table 6. Classifier Performance Measurement Accuracy
Methods Deep Belief Network
Fuzzy Deep Belief Network
Average
Accuracy 0.7185 0.9074
Figure 6. Average Accuracy of DBN and FDBN
The proposed Fuzzy DBN Classifier is always producing better results than DBN. The Fuzzy DBN yields the average accuracy value of 0.9074 which is 18.89% higher than DBN.
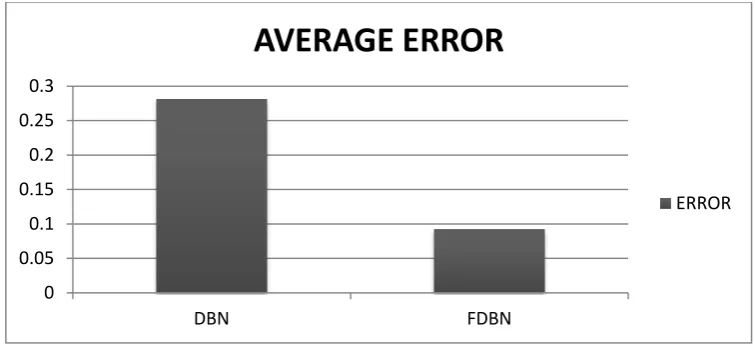
[image:7.595.329.526.546.617.2]The average error for ten fold validation of the both methods are presented in table 7 and their graphical representation is also exposed in figure 7.
Table 7. Classifier Performance Measurement - Error
Methods Deep Belief Network
Fuzzy Deep Belief Network
Average
Error 0.2814 0.0925
In Table 7, the average error value of FDBN is 0.0925 which is 0.19% lesser than the error value achieved by DBN. 0
0.05 0.1 0.15 0.2 0.25 0.3 0.35
1 2 3 4 5 6 7 8 9 10
DBN-ERR
FDBN-ERR
0 0.2 0.4 0.6 0.8 1
DBN FDBN
AVERAGE ACCURACY
Figure 7. Average Error Measure value of DBN and FDBN
5.
CONCLUSION
The main purpose of this paper is to provide an insight about early detection of heart disease using data mining techniques. The prediction of Heart disease is implemented through Deep Belief Network and Fuzzy Deep Belief Network. The proposed models can assist medical professionals in evaluating a patient’s heart disease based on the clinical data of the patient. The proposed research work is evaluated using 9 essential medical attributes such as Age, Sex, Chest Pain Type, Resting Blood Pressure, Serum Cholesterol, Fasting Blood Sugar, Maximum heart rate and the number of major vessels colored by fluoroscopy that ranged between 0 and 3. The performance of the DBN is compared over fuzzy DBN. Deep Belief Network and Fuzzy Deep Belief Networks were compared on the basis of Accuracy and Error-Rate. Fuzzy DBN achieved an accuracy of 90.74%, which is 18.89% higher than the Deep belief Network. The average error rate of Fuzzy DBN is 9.25%, which is 18.89% lower than the error rate achieved by DBN. The experimental result clearly proved that proposed model Fuzzy Deep Belief Network is superior to predict heart disease than Deep Belief Network.
6.
ACKNOWLEDGMENTS
This project work has been done by S. Saranya and Dr. R. Manavalan, who are Research Scholar (Arignar Anna Government Arts College, Villpuram) and Associate Professor and Head (Arignar Anna Government Arts College, Villpuram) respectively.
7.
REFERENCES
[1] Chaitrali S. Dangare and Sulabha S. Apte, “A Data Mining Approach for Prediction of Heart Disease using Neural Networks”, International Journal of Computer Engineering and Technology, Vol. 3, No. 3, pp. 23-29, 2012.
[2] M. Anbarasi, E. Anupriya and N. Iyengar, “Enhanced Prediction of Heart Disease with Feature Subset Selection using Genetic Algorithm”, International Journal of Engineering Science and Technology, Vol. 2, No. 10, pp. 5370-5376, 2010.
[3] Milan Kumari and S. Godara, “Comparative Study of Data Mining Classification Methods in Cardiovascular Disease Prediction”, International Journal of Computer Science and Technology, Vol. 2, No. 2, pp. 304-308, 2011.
[4] N. Aditya Sundar, P. Pushpa Latha, M. Rama Chandra, “Performance Analysis of Classification Data Mining Techniques over Heart Disease Data Base”, International Journal of Engineering Science and Advanced Technology, Vol. 2, No. 3, pp. 470-478, 2013.
[5] T. John Peter and K. Somasundaram, “Study and Development of Novel Feature Selection Framework for Heart Disease Prediction”, International Journal of Scientific and Research Publications, Vol. 2, No. 10, pp. 1- 7, 2012.
[6] Mai Shouman, Tim Turner and Rob Stocker “Applying K-Nearest Neighbour in Diagnosing Heart Disease Patients”, Proceedings of International Conference on Knowledge Discovery, pp. 23-29, 2012.
[7] Nidhi Bhatla and Kiran Jyoti, “An Analysis of Heart Disease Prediction using Different Data Mining Techniques”, International Journal of Engineering Research and Technology, Vol. 1, No. 8, pp. 1-4, 2012.
[8] A. Pethalakshmi and A. Anushya, “Effective Features Selection via Futuristic Genetic on Heart Data”, International Journal of Computational Intelligence and Informatics, Vol. 2, No. 1, pp. 23-27, 2012.
[9] Abhishek Taneja, “Heart Disease Prediction System using Data Mining Techniques”, Oriental Scientific Publishing, 2013.
[10] R. Chitra and V. Seenivasagam, “Heart Disease Prediction System using Supervised Learning Classifier”, Bonfring International Journal of Software Engineering and Soft Computing, Vol. 3, No. 1, pp. 1-7, 2013.
[11] Shamsher Bahadur Patel, Pramod Kumar Yadav and D.P. Shukla, “Predict the Diagnosis of Heart Disease Patients using Classification Mining Techniques”, IOSR Journal of Agriculture and Veterinary Science, Vol. 4, No. 2, pp. 61- 64, 2014.
[12] Vikas Chaurasia and Saurabh Pal, “Early Prediction of Heart Diseases using Data Mining Techniques”, Caribbean Journal of Science and Technology, Vol. 1, pp. 208-217, 2013.
[13] Nilakshi P. Waghulde and Nilima P. Patil, “Genetic Neural Approach for Heart Disease Prediction”, International Journal of Advanced Computer Research, Vol. 4, No. 3, pp. 331-338, 2014.
0 0.05 0.1 0.15 0.2 0.25 0.3
DBN FDBN
AVERAGE ERROR
[14]R. Chitra and V. Seenivasagam, “Review of Heart Disease Prediction System using Data Mining and Hybrid Intelligent Techniques”, ICTACT Journal on Soft Computing, Vol. 3, No. 4, pp. 605-609, 2013.
[15]Rupali R. Patil, “Heart Disease Prediction System using Naive Bayes and Jelinek-Mercer Smoothing”, International Journal of Advanced Research in Computer and Communication Engineering, Vol. 3, No. 5, pp. 515-523, 2014.
[16]B. Venkatalakshmi and M.V. Shivsankar, “Heart Disease Diagnosis using Predictive Data mining”, International Journal of Innovative Research in Science, Engineering and Technology, Vol. 3, No. 3, pp. 223-229, 2014.
[17]Andrea D. Souza, “Heart Disease Prediction using Data Mining Techniques”, International Journal of Research in Engineering and Science, Vol. 3, No. 3, pp. 74-77, 2015.
[18]Moloud Adbar et al., “Comparing Performance of Data Mining algorithms in Prediction Heart Diseases”, International Journal of Electrical and Computer Engineering, Vol. 5, No. 6, pp. 1569-1576, 2015.
[19]Jaymin Patel, Teja Upadhyay and Samir Patel, “Heart Disease Prediction using Machine Learning and Data Mining Techniques”, International Journal of Computer Science and Communication, Vol. 7, No. 1, pp. 129-137, 2016.
[20] K. Rajalakshmi and K. Nirmala, “Heart Disease Prediction with Map Reduce by using Weighted Association Classifier and K-Means”, Indian Journal of Science and Technology, Vol. 9, No. 19, pp. 231-237, 2016.
[21] S. Suganya and P. Tamil Selvi, “A Proficient Heart Disease Prediction Method using Fuzzy-Cart Algorithm”, International Journal of Scientific Engineering and Applied Science, Vol. 2, No. 1, pp. 1-6, 2016.
[22] Rishabh Wadhawan, “Prediction of Coronary Heart Disease using Apriori algorithm with Data Mining Classification”, International Journal of Research in Science and Technology, Vol. 3, No. 1, pp. 1-15, 2018.
[23] Herculano-Houzel, Suzana and Lent, Roberto. Isotropic Fractionator: A simple, rapid method for the Quantification of Total Cell and Neuron Numbers in the Brain. In: The Journal of Neuroscience. 9 March 2005, 25(10): 2518-2521. ISSN: 0270-6474, 2005.
[24] Guyon, Isabelle. A Scaling Law for the Validation Set Training Set Size Ratio. In: AT&T Bell Laboraties, 1997.