Predicting B.L.E.P.T. Performance of Unit Earners using
Supervised Classification Algorithms
Michael Sam A. Castro
San Carlos College
Perez-Riverside St.
San Carlos City, Pangasinan
Mark Herol R. De Guzman
San Carlos College
Brgy. Lucban
San Carlos City, Pangasinan
Chrizel Marie P. Malong
San Carlos College
Brgy. Banaban
Bayambang, Pangasinan
Roldan B. Eden
Malasique, Pangasinan, Philippines
Romulo L. Olalia Jr.
Bautista, Pangasinan, Philippines
ABSTRACT
Data Mining is the extraction of knowledge using solid data available in workplaces. This is also applied in the educational system to predict the academic performance of students. In this paper a prediction of unit earners performance in the Board Licensure Examination for Professional Teachers is conducted to know the chances of non- education graduates who wanted to pursue teaching. The researchers find out the performance of unit earners who passed the BLEPT for the past five years (2012-2016) with a total of 10 examination batches but not to include re-takers. The predictors included are the general weighted average in their undergraduate program and all grades earned in their professional courses. The data mining algorithms used came from the supervised classification algorithm category and the researcher included at least 3 classification algorithms to work on. The algorithm which has the probability accuracy will be recommended in the study.
Keywords
Data Mining, Unit Earners, BLEPT
1.
INTRODUCTION
Data is anything that has qualitative or quantitative variables. Pieces of data are individual pieces of information. Data is collected and analyzed to become information suitable for making decisions. Information can contribute huge on the body of knowledge. The process of extracting knowledge hidden in large volumes of raw data to discover patterns and relationships is called data mining. It is a very promising tool to attain objectives and find out patterns that can benefit the society [1]. In every institution, it is important to meet the standards of Higher Education Institution (HEI) to consider the quality of education it offers and to measure its success. One of these standards is the performance of graduates in the licensure examination. The result of the Board Licensure Examination for Professional Teachers (BLEPT) has a big contribution to the school performance that is manifested through the outcomes of graduates who are fully prepared, well-trained and well-equipped. The board exam is not only limited to those who took BS in Education (Elementary and Secondary) as their undergraduate program during their tertiary education but also those who took other programs and finished the required units (at least 18) of professional education courses.
According to the amended Article III of CMO No. 52, series of 2007, Section 8 of Republic Act No. 7836 (LET Law),
graduate of non-education degrees shall take 18 units of professional education courses to qualify for the Licensure Examination for Teachers [2]. However, unit earners do not have assurance or at the very least have a greater chance to pass the board exam.
An institution like San Carlos College, offers programs in Bachelor of Elementary Education (BEEd) and Bachelor of Secondary Education (BSEd). It also offers earning unit courses for graduates of other programs who want to pursue teaching. Earning unit courses are offered every first and second semester of the academic year.
With regard to this situation, the researchers will focus on predicting BLEPT performance of unit earners in San Carlos College using supervised classification algorithms that could help the examinees identify their chance to pass the licensure exam based on their performance. One of the most useful data mining techniques is classification. It is a predictive data mining technique that makes prediction about values of data using known results found from different data. Predictive models have the specific aim of allowing us to predict the unknown values of interest from given known values of other variables. According to Bhardwaj et. al. (2011), classification is referring to as supervised learning because classes are determined before examining the data [3]. The researchers used at least three supervised classification algorithms to have a more logical structure for solving the situation. These algorithms were evaluated and interpreted. The algorithm that had the highest probability accuracy was recommended in the study.
1.1 Project Framework
The framework is the visual presentation of variables used as a guide and the basis of the researchers in conducting the study. The Conceptual Paradigm adapts the input, process and output paradigm that provided the general structure and guide for the direction of the study. Input-process-output model can be revised and be rebuilt by receiving ideas, impressions and constructive (or not so constructive) criticism by users and other stakeholders, in which it can be modified whenever
Fig.1 Conceptual Paradigm (IPO)
2.
REVIEW OF RELATED
LITERATURE
According to Al-Radaideh et. al. (2006), student performance in university courses is of great concern to the higher education management where several factors may affect performance. They attempted to use data mining processes, particularly classification, to help in enhancing the quality of the higher educational system by evaluating student data to study the main attributes that may affect the student performance in courses [4].
Pandey and Pal conducted a study on student performance by selecting 600 students from different colleges of Dr. R. M. L. Awadh University, Faizabad, India using Bayes Classification on category, language and background qualification. It was used to find out whether new students will perform better or not [5].
Another relevant study was undertaken by Baradwajand Pal. They used decision tree method to predict the students’ performance at the end of a semester. Attendance, class test, seminar and assignment marks were used as variables [6].
Tarun et. al. identified the attributes that are significant to the response attributes which generated prediction models using the PART and JRip classifier of WEKA and it determines how likely is a reviewee to pass the BLEPT [7].
A study conducted by Filipino researchers found that academic performance in terms of Specialization, General Education and Professional Education serves as the strong predictor of Board Examination Performance [8] [9] [10] [11].
While in the study of Dionisio A. Visco predictors considered in the study were student-related and faculty-related factors that were analyzed in LET performance of teacher education graduates of HEIs in Abra from 2007-2011 [12]. On his other research, he used the same set of predictors and used PRC LET results to employ documentary analysis and correlation research design to improve LET performance syllabi and review materials [13].
3.
PROJECT DESIGN AND
METHODOLOGY
The researchers selected from the different Data Mining Process Model that is suitable in the progress of the study. This provided a step-by-step process that served as a guide in the analysis of data of the study. The researchers chose to use the Predictive Model because it has a phase from data selection to the interpretation/evaluation and the representation of the result which is significant to the study.
Predictive modeling is the process of automatically creating a classification model from a set of examples, called the training set, which belongs to a set of classes. High-quality predictive model is a time consuming activity because of the tuning process in finding optimum model parameters and often required to redevelop, reuse the models in the future.
The researchers used Microsoft Excel to encode data inputs or the dataset for the study. Thus, data file type was converted to CSV file format. Moreover, the researchers used a data mining tool to deal with the prediction process. Waikato Environment Knowledge Analysis or mostly called as WEKA data mining is one of the most recommended data mining tools from various data mining studies. Most of the data mining studies used WEKA as their data mining tool with the reason that it’s precisely sophisticated and the analysis of data result is easy to understand. Therefore, the researchers used WEKA as their data mining tool in performing the analysis of data, its visualization, and the results. Another tool used by the researchers was Notepad++, in which the attributes of the two datasets (training and testing) was compared and made it similar.
4.
PRESENTATION AND ANALYSIS OF
DATA
The offered professional unit subjects in San Carlos College and its corresponding cluster. The complete clusters and subjects as basis for the selection is released by the Commission on Higher Education as mandated in Eighteen (18) Units of Professional Education Courses under P.D. 1006 (1977), R.A. 7836 (1994) as amended by R.A. 9293 (2004) to qualify for the Licensure Examination for Teachers [2].
Table 1. Earning Units Subjects
SUBJECT
NO. DESCRIPTION UNITS CLUSTER
Prof Ed 2 Facilitating Learning 3 Cluster 1
Prof Ed 5 Teaching Profession 3 Cluster 3
Prof Ed 6A Principles of Teaching 1 3 Cluster 2
Prof Ed 7A Assessment of Studies 1 3 Cluster 4
ECED 16 Guidance & Counseling in ECED
3 Principles of Techniques of Guidance
SPED 3 Intro to SPED 3 Special Education
4.1
Data Mining Process Models
There are different standard process models for data mining. These process models guide and carry the data mining tasks and its application. Each has its sequential steps that help in implementing the data mining tasks on big or huge amount of data. There are three popular data mining process models. These are Knowledge Discovery Databases (KDD), Cross-Industry Standard Process for Data Mining (CRISP-DM), and Sample, Explore, Modify, Model, Assess (SEMMA).
[image:2.595.315.542.426.623.2]1. Easy to manage
The researchers set this criterion for choosing the appropriate model in order to handle the procedure of the prediction. The phases of the model must be easy to understand and detailed accordingly.
2. Flexible or iterative
The researchers included this criterion because the process model to be used should be flexible to any changes and for additional inputs in the data, in the sense that model can iterate.
3. Reduced time and costs
The process of the proposed study must be finished within the certain deadline. That’s why this criterion was set in selecting the appropriate model.
4. User- Friendly
The result of the process should be interactive in which the representation can be easily interpreted into human language and the result be understandable to the user.
The researchers’ rated the three models from 1 to 3. 1 is equivalent to “poor”; 2 is equivalent to “good”; and 3 is equivalent to “excellent”. Among the Data Mining Process Models, SEMMA is least to be considered with a total average of 2 which is equivalent to good. CRISP-DM model is second to the least model to be considered with an average of 2.5 which is equivalent to good. The KDD model, ranked first because it supported all the criteria with an average of 2.75 which is higher than CRISP- DM and SEMMA and is equivalent to excellent.
[image:3.595.316.542.298.509.2]4.1.1 Knowledge Discovery Databases (KDD
)
This model is an iterative and interactive model. It has a total of nine steps. It refers to finding knowledge in data and emphasizes the high level of specific data mining method. Most researchers and data mining experts follow the KDD process model because it is more complete and accurate [14].Fig. 2 KDD Process Model
The KDD or Knowledge Discovery Databases is the process of extracting the hidden knowledge according from databases. KDD requires relevant prior knowledge and brief understanding of application domain and goals. KDD process model is iterative and interactive in nature. There are nine different steps or stages of this model and these are given below.
1. Domain Understanding and KDD Goals
This is the first stage of KDD process in which goals are defined from customer’s view and used to develop an understanding about application domain and its prior knowledge [14]. This step includes learning the relevant prior knowledge and the goals of the researchers of the discovered knowledge.
In this phase the researchers aimed to predict the probability or chances of non-education graduates or the unit earners to
pass in Board Licensure Examination for Professional Teachers (BLEPT) using solid data which can be used as predictors to predict their strong points to pass.
2. Selection & Addition
This is the second stage of KDD process which focuses on creating target data set and subset of data samples or variables. It is an important stage because knowledge discovery is performed on all these [14].In this step, the data relevant to the analysis is selected on and retrieved from the data collection.
There are 194 unit earners retrieved by the researchers from the records gathered from the Office of the Registrar. Among these, there are 130 left who are not re-takers.
3. Preprocessing: Data Cleaning
[image:3.595.64.269.472.584.2]This is the third stage of KDD process which focuses on target data cleaning and pre-processing to complete without any noise and inconsistencies. In this stage strategies are developed for handling such type of noise and inconsistent data [14].
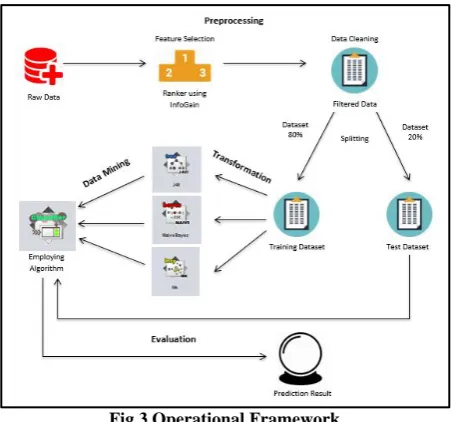
Fig.3 Operational Framework
The researchers used Ranker search method using InfoGain as attribute evaluator in WEKA. InfoGain is the most suggested method because it is easy to understand. It measures the number of bits of information obtained for prediction of class by knowing the presence or absence of a term in a document. As a result, Undergrad Program, GCECED, FACLRG, TCHPRF, ASSESS, and PRNTG1 are the useful attributes in the dataset. While ITSPED was removed as attributes in the dataset.
Fig. 4 Grade Inconsistency
Instead of removing the grades percentage value, the researchers converted those into numerical value adapting San Carlos College grading numerical. It is because most of the instances with percentage value have a result of failed which can help the classifiers in learning the dataset. Also, there are few failed result compared to the number of passed result which can affect the algorithm to train failed results.
Table 2. San Carlos College Grading System
GRADING SYSTEM
Description Numerical Equivalent Percentage Equivalent
Excellent 1.00 98 – 100
Very Good 1.25 95 – 97
1.50 92 – 94
Good 1.75 89 – 91
2.00 86 – 88
Satisfactory 2.25 83 – 85
2.50 80 – 82
Fair 2.75 77 – 79
Passed 3.00 75 –76
Failed 5.00 74 and below
*No Grade NG –
Dropped DRP –
Subsequently, the preprocessed dataset will be divided into two, training and testing dataset. The splitting proportion to be used is 80/20. The 80% is for training and the 20 % for test dataset [15].
The splitting of dataset were done manually to avoid ramdom selection of data for training and testing. The 80% of the dataset is 104 records. It was selected from the beginning of the record until the needed number of the records was reach. While the 20% is the remaining records in the dataset with 26 records.
4. Transformation
This is the fourth stage of KDD process which focuses on transformation of data from one form to another so that data mining algorithms can be implemented easily. For this purpose, different data reduction and transformation methods are implemented on target data [14].
The researchers saved the data file after data preprocessing
and splitting whole dataset into training and test, the data was transformed from CSV (Comma Separated Values) file to ARFF (Attribute Relation File Format) file in order for the data mining tool to recognize it. Although WEKA can read CSV format but this will lead to the incompatibility of the training and test data sets in performing the prediction.
5. Data Mining: Choosing the suitable Data Mining Task.
This is the fifth stage of KDD process in which appropriate data mining task is chosen based on particular goals that are defined in first stage. The examples of data mining method or tasks are classification, clustering, regression and summarization, etc. [14].
Classification techniques is widely used in performance prediction which is useful to determine students’ performance and deals with the accuracy, confusion metrics and the execution time taken [14].
6. Data Mining: Choosing the suitable Data Mining Algorithm
This is the sixth step of KDD process in which one or more appropriate data mining algorithms are selected for searching different patterns from data. There are number of algorithms present today for data mining but appropriate algorithms are selected based on matching the overall criteria for data mining [14].
Three most frequently used classification data mining algorithms was used in the study. These are decision tree (C4.5), Naïve Bayes and k Nearest Neighbour algorithms to predict students’ performance.
7. Data Mining: Employing Data Mining Algorithm
This is the seventh step of KDD process in which selected algorithms are implemented. This is the crucial step in which clever techniques are applied to extract patterns that are potentially useful. In this phase, the researchers used the three classification data mining algorithms [14].
8. Evaluation and Interpretation
This is the eighth step of KDD process that focuses on interpretation and evaluation of mining patterns. This step may involve in extracted patterns visualization [14]
.The C4.5/J48 has 89% classification accuracy. Then its pruned tree indicates the result in GCECED, grades with less than or equal to 2.25 (<=2.25) has 88 passed instances, and grades which is greater than 2.25 (>2.25) will relay to FACLRG. In FACLRG, grades with less than or equal to 2 (<=2) has only 2 passed and greater than 2 (>2) has 14 instances failed. So, GCECED with less than or equal to 2.25 (<=2.25) has the highest percentage to pass the BLEPT although there is also a chance in FACLRG.
[image:4.595.48.287.437.564.2]Then k Nearest Neighbour or IBk has 86% classification accuracy.
8.2.Accuracy Measure and Error Rate for Supervised Classifier Algorithms Used
[image:5.595.311.548.164.441.2]The following tables show the accuracy error of classification techniques. They are the True Positive rate, F Measure, Receiver Operating Characteristics (ROC) Area and Kappa Statistics. The TP Rate is the ratio of play cases predicted correctly cases to the total of positive cases. It is a probability corrected measure of agreement between the classifications and the true classes. It is calculated by taking the agreement expected by chance away from the observed agreement and dividing by the maximum possible agreement. F Measure is a way of combining recall and precision scores into a single measure of performance. Recall is the ratio of relevant documents found in the search result to the total of all relevant documents. Precision is the proportion of relevant documents in the results returned. ROC Area is a traditional to plot this same information in a normalized form with 1-false negative rate plotted against the false positive rate.
Table 3.Accuracy Measure for Supervised Classifier Algorithms Used A lg o ri th m s Co rre ct ly Cl as si fi ed In st an ce s (% ) v al u e In co rrec tl y Cl as si fi ed In st an ce s (% ) v al u e T P Rate Preci si o n F Meas u re RO C A rea K ap p a Sta ti st ic s
J48 89.42 10.58 89.4 89.1 88.6 77.9 62.52
Naïve
Bayes 84.62 15.38 84.6 84.1 84.3 90.2 50.51
IBk 86.54 13.46 86.5 88.5 83.7 94.8 44.39
Fig. 5 Accuracy Measure for Supervised Classifier Algorithms Used
From the analysis of Accuracy Measures of Supervised Classification Algorithms used, J48 performs well when compared to all accuracy measures namely TP rate, Precision, F Measure, and Kappa Statistics, while Naïve Bayes and Ibk
outperformed than J48.
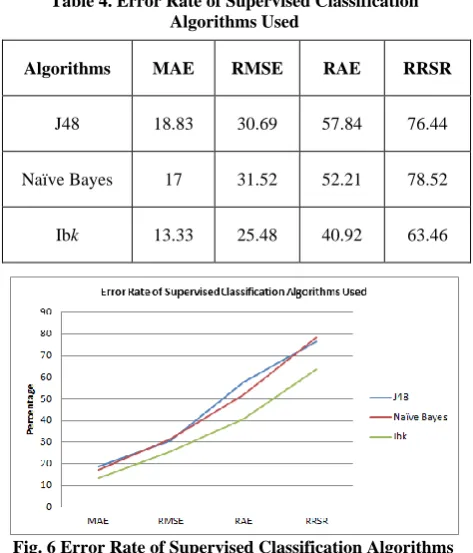
Next is the comparison of Error Rate between the three classifiers. They are the Mean Absolute Error (M.A.E), Root Mean Square Error (R.M.S.E), Relative Absolute Error (R.A.E) and Root Relative Squared Error (R.R.S.R). The mean absolute error (MAE) is defined as the quantity used to measure how close predictions or forecasts are to the eventual outcomes. The root mean square error (RMSE) is defined as frequently used measure of the differences between values predicted by a model or an estimator and the values actually
observed. It is a good measure of accuracy, to compare the forecasting errors within a dataset as it is scale-dependent. Relative error is a measure of the uncertainty of measurement compared to the size of the measurement. The root relative squared error is defined as a relative to what it would have been if a simple predictor had been used. More specifically, this predictor is just the average of the actual values.
Table 4. Error Rate of Supervised Classification Algorithms Used
Fig. 6 Error Rate of Supervised Classification Algorithms Used
From the graph, it was observed that Naïve Bayes attained highest error rate while J48 is the second and IBk is the lowest. Therefore, the IBk classification algorithm performs well because it contains least error rate when compared to other algorithms used in the study.
Based on the accuracy measurement and error rate result, J48 performs best among the three algorithms used. As a result, J48 is the recommended classification algorithm for the study.
9. Discovered Knowledge
This is the last and final step of KDD process in which the discovered knowledge is used for different purposes. The discovered knowledge can also be used by interested parties or can be integrated with another system for further action [14].
9.1. Application of Chosen Algorithm to Test Data
The identified most recommended algorithm which is J48 is applied to re-evaluate the predicted result on test dataset. This process is done to assure that the prediction on the training data is correct.
Cross Validation with 10 folds was selected as the testing procedure to assess the result in training dataset.
The testing of prediction on test dataset is illustrated. It is 96% accurate and 1 instances were predicted incorrectly classified. On the figure, the prediction on test dataset is illustrated in plain text.
Algorithms MAE RMSE RAE RRSR
J48 18.83 30.69 57.84 76.44
Naïve Bayes 17 31.52 52.21 78.52
[image:5.595.50.288.307.601.2]Since Data Mining algorithms and tools require certain level of technicalities, the researchers requested the defense panel member to attest the result of the study as true and free from bias.
This will support the interpretation as valid and genuine and further elevate the trust of the client in the area where confusions were observed and technicalities cannot be understood.
5.
SUMMARY, CONCLUSION,
RECOMMENDATION
The researchers concluded that the gathered data is enough for the study but it should be carefully handled. In this case, all the predictors’ essential for the prediction must be complete and free from outliers. The selected three (3) supervised classification algorithms are the commonly used algorithms employed in this kind of study based from the past researches gathered. WEKA as the data mining tool used in the study has all the needed algorithms and preprocessing tools. Among the three (3) Data Mining Process Models being identified, the researchers have chosen Knowledge Discovery Databases (KDD) model because it met all the criteria chosen by the researchers. The researchers concluded that KDD model focused on the user satisfaction in which the detailed step by step process for the study is emphasized and easy to follow. The researchers identified GCECED as the topmost significant attribute which gives a high performance of unit earners to pass the BLEPT. The attestation of data mining experts validates the result in which the result is correct. It is concluded that this should be accomplished especially for beginners to assess that the prediction result is not bias.
More demographic and academic attributes or predictors can be included to explore other possibilities which affect the result of the BLEPT like if the unit earner attends a review center, the major subject assigned by PRC, if the unit earner has enrolled additional subject in relation to his/her major, and the time element of taking the licensure exam after finishing the last professional subject.
The researchers recommend C4.5/ J48 algorithm for the study. It has higher accuracy and has a lower error rate compared to other deployed algorithms. It is also recommended to explore on using more and other classification algorithms. WEKA is effective and efficient data mining tool in the study. The chosen process model, KDD, is highly recommended as the suitable model for data mining projects. The future unit earners are recommended to exert more efforts in studying the Guidance and Counseling in ECED subject because it turned-out that this subject or predictor has the highest factor in passing the BLEPT. The school can also use the result to strengthen the instructions for this identified predictor. The evaluation of data mining experts is recommended to undertake especially for beginners to attest that the prediction result is not prejudice. Prediction of performance is also being recommended to be applied on other professional examinations like in engineering, medical programs, business programs and the like.
6.
ACKNOWLEDGEMENT
This study would not be possible without the help and support of the following persons. Our deepest gratitude to my parents who in every situation are with us and willing to support our entire endeavor without questions or reservations. To our classmates who in some way gave advice and encouragement not only during the conduct of the study but also throughout
the years of our college. To our adviser, Roldan B. Eden, who unquestionably supported us and provided us with insights on technical and general concerns. To the panel, Regine B. Tabigne, Jenniea A. Olalia and Romulo L. Olalia, Jr. for their advises and recommendations for the success of our study We are offering all our praises and thanksgiving to our Almighty God for giving us life and knowledge that we may continue be a good steward of his blessings.
7.
REFERENCES
[1] Data Mining Technology.
http://www.megaputer.com/site/data_mining.php
[2] www.ched.gov.ph (2009). CHED MEMORANDUM ORDER. http://www.ched.gov.ph/wp-content/uploads/2013/07/CMO-No.11-s2009.pdf
[3] Bhardwaj B.K., Pal S. (2011), Data Mining: A prediction for performance improvement using classification. International Journal of Computer Science and Information Security, Vol. 9, No. 4, April 2011 https://arxiv.org/ftp/arxiv/papers/1201/1201.3418.pdf
[4] Al-Radaideh, Q. A., Al-Shawakfa, E. W., Al-Najjar, M. I. (2006). Mining Student Data Using Decision Trees. https://repensarlafisica.files.wordpress.com/2015/10/mini ng-student-data-using-decision-trees.pdf
[5] Pandey, U.K. and Pal, S. (2011).Data Mining: A prediction of performer or underperformer using classification. (IJCSIT) International Journal of Computer Science and Information Technology, Vol.
2(2),
pp.686-690.http://citeseerx.ist.psu.edu/viewdoc/download?doi=1 0.1.1.206.2659&rep=rep1&type=pdf
[6] Bharadwaj, B. and Pal, S. (2011). Mining educational data to analyze students’ performance. International Journal of Advanced Computer Science and Applications, vol. 2, no. 6, https://arxiv.org/ftp/arxiv/papers/1201/1201.3417.pdf
[7] Tarun, I. M. , Gerardo, B. D. , Tanguilig III, B. T. (2014). Generating Licensure Examination Performance Models Using PART and JRip Classifiers: A Data Mining Application in Education. http://www.ijcce.org/papers/320-CS2004.pdf
[8] Pascua, J. and Navalta, J. (2011). Determinants of L.E.T. Performance of the Teacher Education Graduates in a State University. JPAIR Multidisciplinary Journal.
Volume 6,
http://www.eisrjc.com/documents/Determinants_of_LET _Performance_1325756724.pdf
[9] Pachejo, S. and Allaga, W. (2013). Academic Predictors of the Licensure Examination for Teachers’ Performance of the Rizal Technological University Teacher Education Graduates. International Journal of Educational Research and Technology. www.soeagra.Original Article com/ijert/ijert.htm
[10]Garcia, G. (2010). Academic Performance as Determinant to Pass the Licensure Examination for Teachers. International Journal of Educational Research and Technology. www.soeagra.Original Article com/ijert/ijert.htm
Examination for Teachers. International Journal of Educational Research and Technology. www.soeagra.Original Article com/ijert/ijert.htm
[12]Visco, D. A. (2015). Determinants of Performance in the Licensure Examination for Teachers (LET) of Abra State Institute of Sciences and Technology. International Journal of Management Research and Business Studies, Vol. 2, Issue 1. http://ijrmbs.com/vol2issue1/dionisio.pdf
[13]Visco, D. A. (2015). Predictors of Performance in the Licensure Examination For Teachers of the Graduates of Higher Education Institutions in Abra. International Journal of Management Research and Business Strategy, Vol. 4, No. 1, January 2015. https://www.ijmrbs.com/ijmrbsadmin/upload/IJMRBS_5 4d8591038ba7.pdf
[14]Umair Shafique, Haseeb Qaiser (2014). A Comparative Study of Data Mining Process Models (KDD,
CRISP-DM and
SEMMA).https://www.researchgate.net/publication/2687 70881_A_Comparative_Study_of_Data_Mining_Process _Models_KDD_CRISP-DM_and_SEMMA
[15]Amatriain X., Jaimes A., Oliver N. (2011). Chapter 2: Data Mining Methods for Recommender Systems. http://www.springer.com/cda/content/document/cda_dow nloaddocument/9780387858197-c1.pdf?SGWID=0-0-45-1007442-p173841681.