© 2017, IRJET | Impact Factor value: 5.181 | ISO 9001:2008 Certified Journal
| Page 498
OPTIMIZATION OF ECONOMIC LOAD DISPATCH PROBLEM BY GA AND
PSO - A COMPARISON
Loveleen Kaur
1, Aashish Ranjan
21
Professor, Department of Electrical Engineering, PEC University of Technology, Chandigarh, India
2
PG Student, Department of Electrical Engineering, PEC University of Technology, Chandigarh, India
---***---Abstract
– In this paper, a comparative study of the twovery popular methods, the Genetic Algorithm (GA) and the Particle Swarm Optimization (PSO), for determining the solution of an Economic Dispatch problem. The feasibility of both the methods is demonstrated for a six-generator system, a fifteen- generator system and a forty- generator system. The experimental results obtained from the above test systems show that the solution obtained by PSO for the given Economic Dispatch problem are better than that obtained by using the Genetic Algorithm technique.
Key Words: Economic Dispatch problem, System Constraints, Power Systems, Load demand.
1. INTRODUCTION
The most economical way to meet the load demand while meeting all the system constraints is known as Economic Dispatch (ED). Put differently, Economic Load Dispatch is a problem of determining the power output of each generating unit of the power system such that the total fuel cost is minimum while all the system constraints are like generation limits, valve point loading effects, etc. are taken care of. The problem of determining the outputs of the generating units at minimum cost is known as Optimal Power Flow (OPF) problem.
The production cost of any generator is unique and is a quadratic function of power generated by it. For a given power generated by the unit, a unique cost is incurred. The minimum cost incurred for all the units combined together becomes the optimization problem which is known as the ED problem.
Subham Sahoo et al. have given a comparative study of the three very popular methods for optimization, Cuckoo Search, GA and the PSO [1]. They have considered a three-unit and a six-three-unit test system for their experiment and have come up with the best possible outcomes.
J. S. Luo has proposed an approach to economic dispatch with the bus incremental cost as most crucial variable which offers a possibility of getting an insight of the ED mechanism [2]. To solve the ED problem, they have used the bus incremental cost as a key variable. They have also
taken into account the generation limits while solving the problem.
H.H. Happ gives a review on the progress of optimal dispatch (ED) problem [3]. They have considered both, single area as well as multi-area case and have come up with some theoretical results.
Genetic algorithm is an old but very important tool for solving the problem of economic load dispatch. Walters and Sheble propose to solve the ED problem with a GA based algorithm [4]. Similarly, Karzarlis et al. give a GA based solution to a problem of Unit commitment [5]. The GA algorithm uses the standard crossover and mutation operators to determine a solution in the proximity of the optimal solution. The test system of up to 100 units have been taken and results are reported. C.L. Chiang has come up with a new GA with multiplier updating [6]. This algorithm has been used to solve the ED problems with valve loading effects. He has taken a system with multiple fuels and compared the results of his method with the conventional GA method. A.A. Abou El Ela et al. propose three GA based procedures to minimize transmission line losses and to control overloading of the lines [7]. They carry out simulations to validate their proposed procedures.
PSO is comparatively recent tool for solving the optimization problems in the field of power system. Zwe-Lee Gaing gives a PSO for the optimization of the ED problem [8]. He has taken into account all the nonlinearities in the problem. He has taken three different test systems to validate his results.
© 2017, IRJET | Impact Factor value: 5.181 | ISO 9001:2008 Certified Journal
| Page 499
Valve point loading effect must be taken into considerationwhile solving the ED problem. Classical PSO converges prematurely towards the solution and hence the best solution is not obtained. So, new factors must be added in the classical PSO to get the solution like using time varying acceleration coefficients or using differential evolution [11, 12].
2. OVERVIEW OF PARTICLE SWARM OPTIMIZATION James Kennedy and Russ Eberhart, in 1995, came up with an optimization technique called Particle Swarm Optimization (PSO) [13, 14]. It is a very simple but powerful technique used for solving optimization problems. Its source of inspiration was the social behavior of a flock of bird. In PSO,
each single solution is a "bird" in the search space. We call it "particle". The fitness function, which is the function to be optimized, evaluates the fitness value of each individual (Particle). These particles also have velocities which influences the flying of these particles. The particles fly through the problem space by following the current optimum particles.
Initially, in PSO, the system starts with a group of population of random solutions. It then moves towards the optimal solution with certain velocity which is influenced by its own flying experience and the flying experience of the entire flock. The best solution obtained by a given particle is called particle best solution, represented by pbest and the best solution obtained so far in the entire group is called global best solution, and is denoted by gbest.
Let x denotes the position of a particle and v denotes its flight velocity. In a d- dimensional space, pbest denotes the previous best position of the particle and and gbest denotes the best position obtained by all particles so far. The updated position and velocity of each particle can be calculated using its current velocity and its distance from the gbest as:
Updated Velocity, vi(n+1) = w * vi(n) + C1 * (pbesti — xi(n)) + C2 * (gbest — xi(n))
Updated Position, xi(n + 1) = xi(n) + vi(n + 1)
i — particle index
n — discrete time index w — inertia weight factor vi — velocity of ith particle
xi — position of ith particle
pbesti — best known position known by the ith particle gbest — best known position known by the swarm
C1, C2— acceleration constant.
With the addition of w, known as inertia weight factor, the PSO is modified and the number of iterations are reduced. The acceleration constants C1 and C2 pull each particle towards the particle and global best positions. Lower values of C1 and C2 let the particles roam away from the target region while the higher values leads to their abrupt movement towards the target region. Typically, both C1 and C2 are given a value of 2.
3. OVERVIEW OF GENETIC ALGORITHM
Genetic Algorithm (GA) is a probabilistic search algorithm. It is based on the mechanics of natural selection. According to the concept of natural selection, given by Charles Darwin, fittest individuals dominate over the weaker ones while competing for limited resources. Prof. John Holland, his colleagues and students came up with the GA in 1975.
The GA is one of the most widely used methods for solving both constrained and unconstrained optimization problems [15, 16]. In genetic algorithm, initial population is randomly selected in the beginning. This population gets modified in the successive steps. The next generation is an offspring of the previous generation which is formed from the better genes of the latter. With every new generation, the population (solution) gets better and moves towards the optimal solution.
Basically, there are mainly three rules at each step for producing the future generation from the current population:
Selection rules: individuals are selected which act
as parents contributing to the population at the next generation.
Crossover rules: two parents combine to produce
the next generation.
Mutation rules: apply random changes to
individual parents to form children.
© 2017, IRJET | Impact Factor value: 5.181 | ISO 9001:2008 Certified Journal
| Page 500
the successive generations improves towards the optimalsolution and the poorer solutions die out vanish.
4. NUMERICAL EXAMPLES AND RESULTS
The Economic Dispatch (ED) problem is solved by the PSO and the GA method and the results obtained are discussed and compared. Two different systems, having six and fifteen generators, are taken as the test system. For simplicity, the ramp rate limits, losses, and the prohibited zones are not considered. Under the same evaluation function and individual definition, we perform 50 trials using the above methods and the quality of the solution is observed.
1) PSO Method:
Population size = 100
Generations = 200
Inertia weight factor: wmax = 0.9 and wmin = 0.4
Acceleration constants: C1 =2 and C2 =2.
2) GA Method:
Population size = 100
Generations = 200
Crossover rate, Pc =0.8
Mute rate, Pm = 0.01
Case Study
Example 1: Six-Unit system: The test taken into consideration system consists of six generators for a load demand of 1263 MW on the system. The characteristics of the six units are given in table 1. The power outputs of the six generators are represented by P1, P2, P3, P4, P5 and P6. These values are randomly generated. The best solution obtained by applying these methods is shown in table 2.
Table-1: Generating unit data
Unit Pimin Pimax αi ($) βi
($/MW) γi
($/MW2)
1 100 500 240 7.0 0.0070
2 50 200 200 10.0 0.0095
3 80 300 220 8.5 0.0090
4 50 150 200 11.0 0.0090
5 50 200 220 10.5 0.0080
6 50 120 190 12.0 0.0075
Table-2: Optimum solution of 6- unit system
Unit Power Output PSO GA
P1(MW) 447.9250 445.8835
P2(MW) 170.6501 170.3555
P3(MW) 264.7467 267.1309
P4(MW) 120.3847 120.6641
P5(MW) 170.8557 170.3184
P6(MW) 88.4368 88.6466
Total Power output (MW)
1263 1263
Total Generation
cost ($/hr)
15,276 15,276
Table-3: Comparison between both methods (50 trials)
Generation cost ($)
Max Min
PSO 15298 15276
GA 15277 15276
Example 2: Fifteen-Unit System: The system consists of fifteen generators and the total load demand on the system is 2630 MW. The characteristics of the fifteen generators are given in table 4. The results of the experiment are shown in Tables 5 and 6. These results are found to satisfy the system constraints.
Table-4: Generating unit data
Unit Pimin Pimax α($) i βi
($/MW)
γi ($/MW2)
1 150 455 671 10.1 0.000299
2 150 455 574 10.2 0.000183
3 20 130 374 8.8 0.001126
© 2017, IRJET | Impact Factor value: 5.181 | ISO 9001:2008 Certified Journal
| Page 501
5 150 470 461 10.4 0.000205
6 135 460 630 10.1 0.000301
7 135 465 548 9.8 0.000364
8 60 300 227 11.2 0.000338
9 25 162 173 11.2 0.000807
10 25 160 175 10.7 0.001203
11 20 80 186 10.2 0.003586
12 20 80 230 9.9 0.005513
13 25 85 225 13.1 0.000371
14 15 55 309 12.1 0.001929
[image:4.595.38.283.101.366.2]15 15 55 323 12.4 0.004447
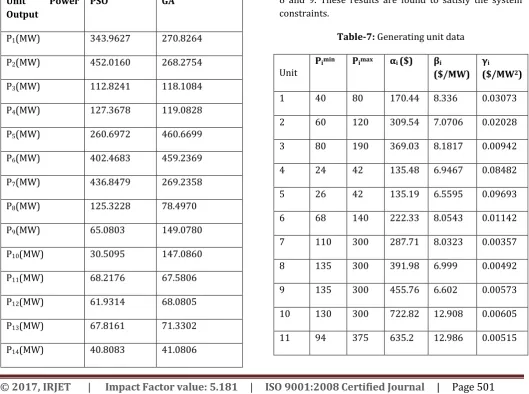
Table-5: Optimum solution of 15- unit system
Unit Power Output
PSO GA
P1(MW) 343.9627 270.8264
P2(MW) 452.0160 268.2754
P3(MW) 112.8241 118.1084
P4(MW) 127.3678 119.0828
P5(MW) 260.6972 460.6699
P6(MW) 402.4683 459.2369
P7(MW) 436.8479 269.2358
P8(MW) 125.3228 78.4970
P9(MW) 65.0803 149.0780
P10(MW) 30.5095 147.0860
P11(MW) 68.2176 67.5806
P12(MW) 61.9314 68.0805
P13(MW) 67.8161 71.3302
P14(MW) 40.8083 41.0806
P15(MW) 34.1232 41.8306
Total Power
output (MW)
2630 2630
Total Generation cost($/hr)
32,604 32,844
Table-6: Comparison between both methods (50 trials)
Generation cost ($)
Max Min
PSO 32803 32604
GA 33054 32844
[image:4.595.36.566.399.793.2]Example 3: Forty-Unit System: The system consists of forty generators for a load demand of 7550 MW on the system. The characteristics of the fifteen generators are given in table 7. The results of the experiment are shown in Tables 8 and 9. These results are found to satisfy the system constraints.
Table-7: Generating unit data
Unit Pimin Pimax αi ($) β($/MW) i γ($/MWi 2)
1 40 80 170.44 8.336 0.03073
2 60 120 309.54 7.0706 0.02028
3 80 190 369.03 8.1817 0.00942
4 24 42 135.48 6.9467 0.08482
5 26 42 135.19 6.5595 0.09693
6 68 140 222.33 8.0543 0.01142
7 110 300 287.71 8.0323 0.00357
8 135 300 391.98 6.999 0.00492
9 135 300 455.76 6.602 0.00573
10 130 300 722.82 12.908 0.00605
[image:4.595.253.558.454.765.2]© 2017, IRJET | Impact Factor value: 5.181 | ISO 9001:2008 Certified Journal
| Page 502
12 94 375 654.69 12.796 0.00569
13 125 500 913.4 12.501 0.00421
14 125 500 1760.4 8.8412 0.00752
15 125 500 1728.3 9.1575 0.00708
16 125 500 1728.3 9.1575 0.00708
17 125 500 1728.3 9.1575 0.00708
18 220 500 647.85 7.9691 0.00313
19 220 500 649.69 7.955 0.00313
20 242 550 647.83 7.9691 0.00313
21 242 550 647.83 7.9691 0.00313
22 254 550 785.96 6.6313 0.00298
23 254 550 785.96 6.6313 0.00298
24 254 550 794.53 6.6611 0.00284
25 254 550 794.53 6.6611 0.00284
26 254 550 801.32 7.1032 0.00277
27 254 550 801.32 7.1032 0.00277
28 10 150 1055.1 3.3353 0.52124
29 10 150 1055.1 3.3353 0.52124
30 10 150 1055.1 3.3353 0.52124
31 20 70 1207.8 13.052 0.25098
32 20 70 810.79 21.887 0.16766
33 20 70 1247.7 10.244 0.2635
34 20 70 1219.2 8.3707 0.30575
35 18 60 641.43 26.258 0.18362
36 18 60 1112.8 9.6956 0.32563
37 20 60 1044.4 7.1633 0.33722
38 25 60 832.24 16.339 0.23915
39 25 60 832.24 16.339 0.23915
40 25 60 1035.2 16.339 0.23915
Table-8: Optimum solution of 40- unit system
Unit Power Output PSO GA
P1(MW) 51.6495 69.899
P2(MW) 106.4366 115.095
P3(MW) 146.4114 184.555
P4(MW) 33.1208 37.332
P5(MW) 26.3967 36.099
P6(MW) 133.1878 137.12
P7(MW) 202.4194 248.282
P8(MW) 225.0944 245.118
P9(MW) 235.1695 246.857
P10(MW) 229.7413 249.619
P11(MW) 185.3917 321.446
P12(MW) 136.9803 254.599
P13(MW) 271.3692 244.791
P14(MW) 318.5009 252.566
P15(MW) 181.9445 255.925
P16(MW) 231.3118 249.32
P17(MW) 278.4898 250.376
P18(MW) 318.7897 281.582
P19(MW) 399.5334 388.831
P20(MW) 420.4946 411.776
P21(MW) 434.0356 312.837
P22(MW) 427.1164 319.096
P23(MW) 433.4655 314.376
© 2017, IRJET | Impact Factor value: 5.181 | ISO 9001:2008 Certified Journal
| Page 503
P25(MW) 423.9103 315.192
P26(MW) 411.3608 334.909
P27(MW) 447.4497 323.329
P28(MW) 28.8625 101.964
P29(MW) 21.0774 34.159
P30(MW) 32.5027 118.372
P31(MW) 43.2138 63.28
P32(MW) 45.0267 63.669
P33(MW) 35.4292 64.589
P34(MW) 22.5218 62.689
P35(MW) 20.8390 53.239
P36(MW) 38.5331 54.849
P37(MW) 27.0108 53.643
P38(MW) 43.3273 54.003
P39(MW) 46.9845 55.095
P40(MW) 43.1169 54.700
Total Power output (MW)
7550 7550
Total Generation
cost($/hr)
110820 129665
Table-9: Comparison between both methods (50 trials)
Generation cost ($)
Max Min
PSO 115730 110820
GA 148187 129665
Ⅴ. CONCLUSION
In this paper, Particle Swarm Optimization (PSO) and Genetic Algorithm (GA) have been successfully implemented to solve the Economic Dispatch problem with generator constraints. For simplicity, some of the
nonlinearities like valve point zones and ramp rate limits have not been considered. For the testing of the above two methods, a six, fifteen and a forty- generator system have been used. The results obtained show that PSO gives better solution than the GA.
REFERENCES
[1] S. Sahoo, K. M. Dash and A. K. Barisal, "Solution of economic load dispatch by evolutionary optimization algorithms — A comparative study," Proceedings of The 2014 International Conference on Control, Instrumentation, Energy and Communication (CIEC), Calcutta, 2014, pp. 259-263.
[2] J. S. Luo, E. F. Hill and T. H. Lee, "Power System Economic Dispatch Via Network Approach," in IEEE Transactions on Power Apparatus and Systems, vol. PAS-103, no. 6, pp. 1242-1248, June 1984.
[3] H. H. Happ, "Optimal power dispatch-A
comprehensive survey," in IEEE Transactions on Power Apparatus and Systems, vol. 96, no. 3, pp. 841-854, May 1977.
[4] D. C. Walters and G. B. Sheble, “Genetic algorithm solution of economic dispatch with valve point loading,” IEEE Trans. Power Syst., vol. 8, pp. 1325– 1332, Aug. 1993.
[5] S. A. Kazarlis, A. G. Bakirtzis and V. Petridis, "A genetic algorithm solution to the unit commitment problem," in IEEE Transactions on Power Systems, vol. 11, no. 1, pp. 83-92, Feb 1996.
[6] Chao-Lung Chiang, "Improved genetic algorithm
for power economic dispatch of units with valve-point effects and multiple fuels," in IEEE Transactions on Power Systems, vol. 20, no. 4, pp. 1690-1699, Nov. 2005.
[7] A. A. Abou EL Ela, A. Z. El-Din and S. R. Spea, "Optimal corrective actions for power systems using multiobjective genetic algorithms," 2007
42nd International Universities Power
Engineering Conference, Brighton, 2007, pp. 365-376.
[8] Zwe-Lee Gaing, "Particle swarm optimization to solving the economic dispatch considering the generator constraints," in IEEE Transactions on Power Systems, vol. 18, no. 3, pp. 1187-1195, Aug. 2003.
© 2017, IRJET | Impact Factor value: 5.181 | ISO 9001:2008 Certified Journal
| Page 504
on Control & Automation (ICCA), Taichung, 2014,pp. 604-606.
[10] C. Dhifaoui, T. Guesmi and H. Hadj Abdallah, "Application of multi-objective PSO algorithm for
Economic Dispatch (ED) through Unit
Commitment Problems (UCP)," 2014 15th International Conference on Sciences and Techniques of Automatic Control and Computer Engineering (STA), Hammamet, 2014, pp. 704-710.
[11] T. M. Subhani, C. S. Babu and A. S. Reddy, "Particle swarm optimization with time varying acceleration coefficents for economic dispatch
considering valve point loading
effects," Computing Communication & Networking Technologies (ICCCNT), 2012 Third International Conference on, Coimbatore, 2012, pp. 1-8.
[12] Taher Niknam, Hasan Doagou and Hamed Zeinoddini- Meymand,”A novel hybrid particle swarm optimization for economic dispatch with valve-point loading effects,” in Energy Conversion and Management 52(4):1800-1809 · April 2011
[13] J. Kennedy and R. Eberhart, “Particle swarm optimization,” Proc. IEEE Int. Conf. Neural Networks, vol. IV, pp. 1942–1948, 1995.
[14] Y. Shi and R. Eberhart, “A modified particle swarm optimizer,” Proc. IEEE Int. Conf. Evol. Comput., pp. 69–73, May 1998.
[15] D. J. King, C. S. Oezveren and Warsono, "A Genetic Algorithm Based Economic Dispatch (GAED) with
Environmental Constraint
Optimisation," Universities' Power Engineering Conference (UPEC), Proceedings of 2011 46th International, Soest, Germany, 2011, pp. 1-6.
[16] A. Derghal and N. Golea, "Genetic algorithm for solving large practical fuzzy economic load dispatch with prohibited operating zones," 2014 International Renewable and Sustainable Energy Conference (IRSEC), Ouarzazate, 2014, pp. 469-474.