Journal of Chemical and Pharmaceutical Research, 2014, 6(2): 512-519
Research Article
CODEN(USA) : JCPRC5
ISSN : 0975-7384
Analyzing the Temperature Field of Combined Plasma Arc Based on Image
Pre-processing and Spectral Diagnostics of Plasma Arc
Dong Xiaojuan
1, Wei Xiuting
2, Yin Zhanmin
3and Meng Jianbing
4School of Mechanical Engineering, Shandong University of Technology, Zibo, China
_____________________________________________________________________________________________
ABSTRACT
The beam form has a direct effect on the quality and efficiency of flexible forming using a combined plasma arc. But it is difficult to directly measure relative parameters of the combined plasma arc for its characteristics of high temperature and high energy density. In this paper, an image collection system was designed with a lens, a neutral filter, an interference filter and a CCD camera to overcome above problem. Furthermore, the acquired digital image of diagnostic face of combined plasma arc was implemented pre-processing such as removing noises, edge detection, histogram equalization, contrast enhancement, enhancing morphological features by using MATLAB. The results show that the digital image of combined plasma arc is successfully captured by means of the system, which will be helpful to further the diagnosis and analysis of parameters of combined plasma arc.
Key words: Combined plasma arc; Spectral diagnostics; Temperature field; Image pre-processing
_____________________________________________________________________________________________
INTRODUCTION
behavior of transferred arc and weld pool including arc temperature field and current density distribution with finite element method. Especially, Yin et al. [7] developed a two-dimensional mathematical model to research the behavior of the transferred argon plasma arc constricted by a torch. The model also took the plasma arc as laminar flow and included the torch region to consider the influence of cathode figure and the restricted role of the nozzle.
Up to now, many studies on the jet characteristics of transferred plasma arc and non-transferred plasma arc have been published, however, little attentions are given to a numerical simulation of the combined plasma arc. Furthermore, as an ideal heat source, combined plasma arc has been generally applied to precise welding and also involves complex physical phenomena. Therefore, it is necessary to make a numerical analysis on the combined plasma arc. Unfortunately, it is quite difficult to apply above methods to simulate the combined plasma arc, due to the coexistence of non-transferred arc and transfer arc and the more complicated coupling between electric, magnetic, heat flow and fluid flow phenomena in the combined plasma arc.
Otherwise, the emergence of computer-controlled photoelectric direct-reading diagnosis device (such as OMA, OSA) and special equipment not only improved the resolution of spectral diagnostics in time and space but also enhanced the capabilities of data processing and the accuracy of experimental measurement [8]. As a result, it will provide a favorable method for the spectrum diagnosis of combined plasma arc. In this paper, a neutral density filters (neutral attenuation films) and narrow-band interference filters were used to replace expensive spectrometer. In view of the CCD widely using in the field of image sensors and non-contact measurement, a new type of charge coupled device CCD is considered as a light detector being a part of this optical system, which made experimental equipment simple, practical and more suitable for field application. Moreover, the acquired digital image of diagnostic face of plasma arc was implemented pre-processing and analyzed with the Abel’s inversion. Finally, the relationship between spatial emission coefficient of arc column and temperature is obtained by calculating the particle density and partition function within plasma arc based on Saha’s equation. Consequently, the temperature distribution of combined plasma arc is obtained by using Off-axis Peak Intensity Method.
THE PRINCIPLE OF THE DIAGNOSIS ON COMBINED PLASMA ARC
The whole diagnosis of combined plasma arc can be usually divided into the contact type and the non-contact type. However, the temperature of combined plasma arc is so high that it is difficult to save the life of contact probe and to avoid the disturbance to the measured arc parameters (such as the type of Langmuir probe). Therefore, to obtain a high accuracy, the method of non-contact, especially for the spectrometry, is commonly used to measure the parameters of the combined plasma arc. The spectrometry is also named Optical Emission Spectroscopy (OES), which aim to analyze the spectrum emission from the transition of the group such as molecular, atoms and free quantity. In addition, spectroscopic diagnosis includes the absolute intensity method, the standard temperature method, and the relative intensity method, the method of relative spectrum and continuous spectrum, the spectrum profile method, the method of absorption spectrum and the method of spectrum reversal. In this paper, the absolute intensity method for the diagnosis of combined plasma arc is used, which makes full use of the relationship between the emission rate of plasma arc spectrum and arc temperature. As shown in Figure 1, the temperature of combined plasma arc can be obtained by measuring the emission rate of spectrum.
Fig. 1: Schematic of combined plasma arc and principle of spectral diagnosis on the plasma arc
0 0 1 exp 4 m m mn mn mn
N g E
hc A Z kT ε π λ ⋅ = −
(1)
where, Z0 is the particle partition function, which can be expressed as:
0 exp , 1, 2, 3
i i
i
E
Z g i
kT
=∑ − =
L (2)
Where h is the Planck's constant, Amn is the transition probability, λmn is the wavelength of spectral line, gm is m-level
statistical weight, N0 is the particle density, Z0 is particle partition function, Em is the excitation potential, and k is
Boltzmann constant. Particle density N0 can be obtained from the following balance equations of plasma.
3/ 2
2 0
2
2 exp
e i e i
Ar Ar
N N Z m k T E E
N Z h kT
π
+⋅ ⋅ ⋅ ⋅ − ∆
= −
(3)
In Eq. (1), Eq. (2), and Eq. (3), gm and Em can be obtained from Ref. [10], N0 and Z0 can be obtained from theoretical
calculation. Once the radiation coefficient εmn of some spectrum is obtained by diagnosing collected images and analyzing with Abel inversion, the corresponding temperature T can be determined by means of above equations.
THE IMAGE COLLECTION SYSTEM OF COMBINED PLASMA ARC
The principle of image collection is illuminated in Figure 2 and experimental parameters of combined plasma arc are shown in Table 1.
Tab.1: Experimental parameters of combined plasma arc
Voltage Current Work gas flow
U/V I/A q/(L· min-1)
40 30 6
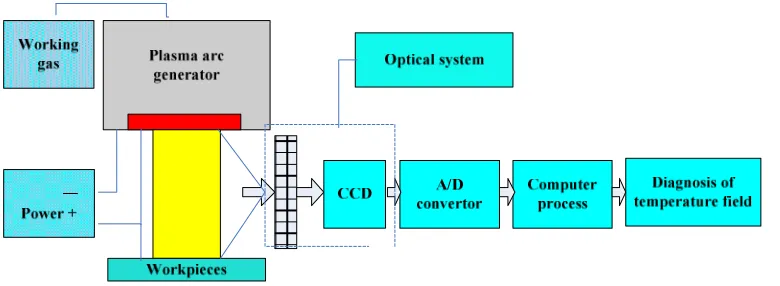
[image:3.595.116.506.523.666.2]As shown in Figure 2, single radiation image of combined plasma arc is obtained by using narrow-band interference filter, then this image is collected by CCD camera in which optical signal can be converted into electrical signal, and it is input into computer by A/D conversion interface, in succession, the gray image containing the information of spectrum intensity can be obtained. As a result, the diagnostic parameters are obtained by preprocessing, calibration and calculation of the gray image.
Fig. 2: Image collection system of combined plasma arc
wavelength lying 696.5nm upper and lower 6nm in the Ar emission spectrum, therefore, the characteristic line whose center wavelength lying 696.5nm is regarded as the analysis line for spectrum diagnosis of temperature of plasma arc. Accordingly, the interference filter whose center wavelength is 696.5nm and width of the band is 11nm is used in this paper.
DIGITAL IMAGE PROCESSING OF COMBINED PLASMA ARC
There exists a functional relationship between spectral intensity and state parameters of the thermodynamic system of plasma arc in spectroscopy. So it is necessary to preprocess the collected image in order to obtain better effect of the vision and measurement.
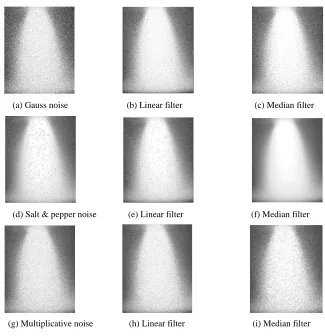
It is possible to appear all kinds of noises in the original collected image, which are mainly from the interference of background and the conversion of image signal through the area array CCD in the process of image collecting. So it is indispensable to filter to eliminate the interference for the collected image. In this paper, original images are separately added three different kinds of noises such as Gaussian noise, salt and pepper noise and multiplicative noise respectively. Afterwards, these images are treated with linear filter and median filter, respectively. As shown in Figure 3, median filter is more helpful than linear filter for the images which are introduced Gaussian noise and salt and pepper noise respectively. However, median filter is less effective for multiplicative noise.
(a) Gauss noise (b) Linear filter (c) Median filter
(d) Salt & pepper noise (e) Linear filter (f) Median filter
[image:4.595.145.470.299.635.2]
(g) Multiplicative noise (h) Linear filter (i) Median filter
Fig. 3: Comparison of image quality before and after filtering
(a)Sobel Operator (b) Prewitt Operator (c) Log Operator
Fig. 4: Comparison of three operator for extraction edge
ENHANCING THE CHARACTERISTIC OF COMBINED PLASMA ARC IMAGES
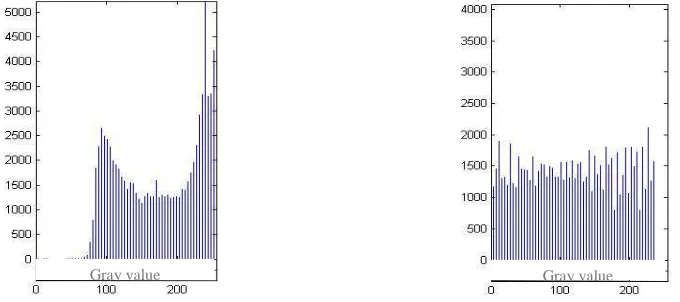
[image:5.595.89.535.56.191.2]Density histogram is an important statistical feature of images and can be considered as the approximation on gray density function of images. However, for the original images, when gray value is low, the frequency of gray density histogram is so larger that the details in the dark region of image cannot discerned clearly. In order to expand the gray region of collected images and to make the gray histogram tend to be uniform in larger dynamic range, histogram equalization is introduced after the de-noise processing. Figure 5 is the histograms of gray value after noise is removed from the digital image of plasma arc and obtained from histogram equalization. As shown in Figure 5, the region of gray value is expanded from [60, 255] to [0, 255] after histogram equalization. From Figure 6, it can be concluded that the details of the plasma arc image are more outstanding after histogram equalization.
[image:5.595.137.477.328.479.2]
Fig. 5: Comparison of the histograms before and after histogram equalization
[image:5.595.136.483.506.645.2]
Fig. 6: Comparison of the images before and after histogram equalization
It is also important part of the processing of combined plasma arc images, which adjust the gray of each image pixel and change the dynamic range of image gray. Furthermore, it can also make sectional treatment according to the features of the image after the histogram equalization. Consequently, as shown in the Figure 7, it is effective to improve the image quality for contrast enhancement and to overcome the defect of contrast insufficient before it is introduced in the processing of the plasma image.
Fig. 7: Comparison of the images before and after contrast enhancement
In order to emphasize the detail of the image, it is necessary to transform the gray image into the sensitive color
image on account of different sensitivity of people’s eyes about different color. Likewise, it is also important to deal with the image through the processing of binary and pseudo color for better understanding the morphological characteristics, as shown in Figure 8.
[image:6.595.116.491.312.454.2]
Fig. 8: Binarization and Pseudo-color processing
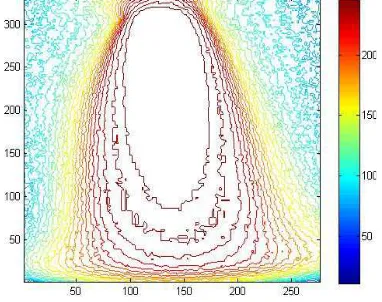
[image:6.595.211.402.582.733.2]As a result, Figure 9 is the image on isopleths of gray value after above processing of combined plasma arc digital image and smooth processing, where saturated brightness value is taken 255. It can be found that the gray values of arc column in its central area are close to the saturation value, which means the temperature of arc central area is higher. Moreover, there exists a transition region between both sides of the arc column and its own. It can be concluded that this designed system of image collection is reliable and the employed methods of image preprocessing such as removing noises, edge detection, histogram equalization, contrast enhancement, binarization and pseudo color are feasible. Furthermore, the image looks more vivid and can show more details through above preprocessing.
TEMPERATURE FIELD OF COMBINED PLASMA ARC
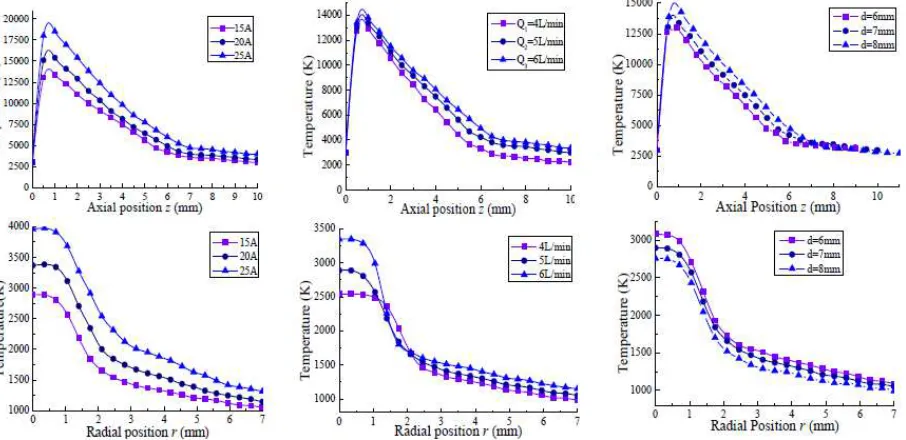
[image:7.595.86.539.188.408.2]The working current I, the distance D from the nozzle outlet to the workpiece anode and the argon gas flow rate Q are 15A, 20A, 25A, 6mm, 7mm, 8mm, 4L/min, 5L/min and 6L/min, respectively. Based on above image processing of combined plasma arc obtained by the image collection of spectral diagnostics, with the assumption of local thermodynamic equilibrium, the relationship between spatial emission coefficient of arc column and temperature is obtained by calculating the particle density and partition function with combined plasma arc based on Saha’s equation. The radial temperature field distribution of combined plasma arc is obtained by using Off-axis Peak Intensity Method. Furthermore, axial cross-section temperature field distribution of arc column is also obtained ,as shown in Figure 10.
Fig. 10: Temperature of combined plasma arc under different working currents, distances and gas flow rates
CONCLUSION
An image collection system of plasma arc is designed with an optical lens, a neutral density filter, a narrow band interference filter and CCD, which can successfully capture more vivid original image of combined plasma arc. It is obvious that median filter is better than linear filter for Gaussian noise and salt and pepper noise on the basis of processing and analysis of image added noises. Furthermore, it is effective to introduce extraction of edge feature, histogram equalization and contrast enhancement into the processing of combined plasma arc images. It is also feasible to obtain the image with good visual effect and more details through the processing of binarization and pseudo color, which can lay the foundation for the diagnosis of the shape and parameters of combined plasma arc. A spectral diagnostics system of combined plasma arc is designed with image collection parts and image processing, which can successfully capture more vivid original image of combined plasma arc and characteristics of combined plasma arc such as axial temperature and radial temperature are also obtained. An important finding of this work is that the effects of the process parameters on the temperature distributions, including the working current, the argon flow rate and the distance from the nozzle outlet to the working anode. It is found that the working current is significantly influential to the temperature, velocity and current density. Meanwhile, the temperature distributions of combined plasma arc are less sensitive to the distance from the nozzle outlet to the anode at a constant current. Consequentially, the results proved that the spectral diagnostics and analysis on the temperature distributions of combined plasma arc are reliable and effective.
Acknowledgments
The project was supported by the National Nature Science Foundation of China (Grant No. 51205237 and 51375284), also supported by Promotive research fund for excellent young and middle-aged scientists of Shandong Province (Grant No. BS2010ZZ009), respectively.
REFERENCES
[3]Bauchire J. M., Gonzalez J. J., Gleizes A.. Plasma Chemistry and Plasma Processing, vol. 17, pp.409-432, 1997. [4]Piak S., Huang P. C., Heberlein J., Pfender E.. Plasma Chemistry and Plasma Processing, vol. 13, pp. 379-397,
1993.
[5]Ushio M., Szekely J., Chang C. W.. Ironmaking and Steelmaking, Vol. 6, pp.279-286, 1981. [6]Lu F. G., Tang X. H., Yu H. L., Yao S.. Computational Materials Science, v.35, pp. 458-465, 2006. [7]Yin F. L., Hu S. S., Yu C. L.. Computational Materials Science, vol. 40, pp. 389-394, 2007. [8]Shang W. K., Dullni E., Fink H.. IEEE Transactions on Plasma Science, vol. 31, pp. 187-191, 2003. [9]Shea J. E., Gardner C. S.. Welding International, vol. 12, pp. 1122-1126, 1988.
[10]Czerwiecl T., Graves D. B.. Journal of Physics D –Applied Physics, vol. 37, pp.2827-2832, 2004.