HTTP Traffic Graph Clustering using Markov Clustering
Algorithm
Yessica Nataliani
Department of Information System Satya Wacana Christian UniversitySalatiga, Indonesia, 50711
Theophilus Wellem
Department of Information System Satya Wacana Christian UniversitySalatiga, Indonesia, 50711
ABSTRACT
Graph-based techniques and analysis have been used for IP network traffic analysis. The objective of this paper is to study the hosts’ interaction behavior and use graph clustering algorithm, the Markov clustering algorithm, to group (cluster) hosts which have interaction using the HTTP protocol. Using real network traces, the clustering results show that MCL algorithm successfully group the hosts to their corresponding clusters. Analyzing the clustering results, it is showed that communications between one source IP address to one destination IP address, one source IP address to several (different) destination IP addresses, and several (different) source IP addresses to one destination IP address, are grouped to their own clusters.
General Terms
Algorithms, Measurement
Keywords
Graph clustering, Traffic dispersion graph, Markov clustering, HTTP
1.
INTRODUCTION
Understanding hosts communication and interaction patterns are proven to be useful for traffic classification, anomaly detection and network security. In order to analyze, visualize, and understand hosts communication pattern, graph-based methods have been used in traffic monitoring. To use graph techniques for analyzing network traffic, a graph representation must be constructed from network traffic as proposed in [1, 2]. Traffic dispersion graph (TDG) [3] is a graph to represent various interactions of group of nodes (hosts in IP network). The important thing to consider when generating TDGs from network traffic is the edge definition. It is suggested that an edge between a pair of nodes can be based on the number of packets or bytes exchanged, port numbers, transport protocol used, etc. (the edge filtering process in [3]). Different definition of the edge can open other possibilities of using TDGs as a network monitoring tool. Algorithms can be designed to use TDGs properties and discover information or knowledge from it (e.g., algorithm for identifying anomalies, applications, etc.). Graph metrics should be defined to quantify TDGs properties.
Using graph techniques and analysis, the behavioral characteristics of a host (e.g., its communication pattern) can be studied from network traffic. For example, graph clustering algorithm can be used to cluster applications based on their port numbers, or graph matching algorithms for detecting anomalies [4]. Behavioral graph analysis and clustering on bipartite graph and one-mode projection graphs have also
been used for detecting Internet applications and anomalous traffic pattern [5].
The objective of this paper is to study the hosts’ interaction behavior based on their HTTP communication. Undirected graph is used to represent HTTP communication between hosts, then a graph clustering algorithm (Markov clustering algorithm (MCL)) is used to group the hosts according to similarity in their behaviors. The objective is to group (cluster) hosts which often interact using HTTP, regardless they are web servers or web clients.
The remainder of this paper is organized as follows. In next section, some of the works on application of graph-based methods for network traffic analysis and anomaly detection are presented. Section 3 provides background on graph and graph clustering, MCL, and traffic dispersion graph. Section 4 presents the implementation of MCL for clustering the network traffic. The experiment results and discussion are described in Section 5. Finally, Section 6 concludes this paper.
2.
RELATED WORK
The work in this paper is motivated by several previous works those using graph-based methods to analyze and classify network traffic. TDG is introduced by Iliofotou et al. [3] as a way of modeling traffic behavior and network-wide hosts’ communication interaction patterns. After generated TDGs from network traces, different graph metrics (scalar and non-scalar) such as Average degree, Max Degree Ratio (MDR), Directionality, Depth, Node Degree Distribution, and Giant Connected Component (GCC) are computed from these TDGs, to identify the nature of network applications. In [6], Iliofotou et al. proposed a traffic classification framework called Graption. It combines network-wide behavior and flow-level characteristics to classify P2P traffic. Graption framework first isolates flows and groups flows using flow-level features (this step includes clustering step to cluster similar flows together), then uses TDGs to classify each group of flows. Graph-based metrics are used to differentiate between applications.
detection method for detecting anomalies. In [9], Xu and Wang proposed a behavioral graph analysis for detecting applications and anomalies in network traffic. They used bipartite graph of source and destination IP addresses, and one-mode projection graphs to capture behavior of hosts engaging in the same applications. They also used clustering algorithms to group applications based on coefficient clustering and one-mode projection graph properties.
In [2], Jin et al. proposed a graph decomposition technique to decompose and extract host interaction pattern from bipartite traffic activity graphs (TAGs) based on orthogonal nonnegative matrix tri-factorization (tNMF). Bipartite TAGs are derived from network data (NetFlow records) and decomposed to characterize the network traffic behaviors. They also studied interaction pattern among traffic from different application classes to form a mixed TAG, and a variant of MCL algorithm is used to extract clusters from the mixed application TAG [10].
Different from the works mentioned above, this paper focus on HTTP communication between hosts and use the MCL algorithm to cluster the hosts which interacts using HTTP.
3.
BACKGROUND
This section provides background on graph, graph clustering, TDG, and Markov clustering algorithm (MCL).
3.1
Graph and Graph Clustering
A graph G is a pair of sets (V, E), where V is a finite nonempty set of objects called vertices (or nodes) and E is a 2-element subsets of V called edges (or links). V is the vertex set, V(G) = {v1, v2, …, vn}, where n = |V| is the number of
vertices, which often called the order of graph G. E is the edge set, E(G) = {e1, e2, …, em}, where m = |E| is number of edges,
which often called the size of graph G. The edge, e is written as 2-element set {u, v}.
The vertices u and v are referred to as neighbors of each other. In this case, the vertex u (or v) and the edge e = uv are said to be incident with each other. Two vertices u and v is said to be adjacent if there is an edge between vertex u and vertex v. A graph is called a directed graph (digraph) is a graph when the edges are ordered pairs. Otherwise, it is called undirected graph.
Clustering is unsupervised technique for grouping related unlabeled data (objects) such that, data with most-similar characteristics belong to the same cluster and data with most-dissimilar characteristics will be in other clusters. Therefore, a cluster is a collection of data which have high similarity between them and dissimilar to data belonging to other clusters [11]. Graph clustering is the task of grouping the graph's vertices into clusters taking into consideration of the graph's edge structure such that, there should be many edges within each cluster and relatively few between the clusters [12].
3.2
Markov Clustering Algorithm
Markov clustering algorithm (MCL) is an unsupervised graph clustering algorithm based on simulation of stochastic flow in graph, invented by van Dongen [13]. The idea of MCL is to simulate flow within a graph, which consists of two goals, to promote flow where the current is strong and to demote flow where the current is weak. Two important operations in this algorithm are expansion and inflation. Expansion is an operation that responsible for allowing flow to connect different regions of the graph, which coincides with normal matrix multiplication. Expansion parameter is represented by
e. Inflation is an operation that responsible for both strengthening and weakening of current. Inflation parameter is represented by r. Definition of inflation operator is given in [13] as follows.
Given a matrix , and a real nonnegative number r, the matrix resulting from rescaling each of the columns of M with power coefficient r is called , and is called the inflation operator with power coefficient r. Formally, the action of is defined by:
If the subscript is omitted, it is understood that the power coefficient equals 2.
The MCL algorithm is described in Algorithm 1. Algorithm 1 Markov Clustering Algorithm
Input: Undirected graph, expansion parameter e, and inflation parameter r.
1. Create the associated matrix, defined by:
where i and j = 1, 2, …, n (number of nodes).
2. Markov chain allows us to remain at the current state, beside move from current state to another states. Add self-loops to each node, defined by:
3. Normalize the matrix (make probability transition matrix),
4. Expand by taking the eth power of the matrix M. 5. Inflate the resulting matrix from Step 4 using parameter
r.
6. Repeat steps 4 and 5 until a steady state is reached. 7. Interpret resulting matrix from Step 6 to discover
clusters.
Output: Clustered graph.
3.3
Traffic Dispersion Graph
TDG is defined as a graph that represent various interactions of a group of nodes. For IP network traffic, a node in TDG corresponds to a host with a distinct IP address. The edge can be defined in based on, for example, packet exchange between two hosts. Thus, the edge represent connections between them. The edge connections can define in many ways, depend on what edge filter is used as discussed in [3]. Note that TDG is a graph that evolves in time and space and it has an implicit temporal relation, means that a static TDG has an associated time interval. Details of TDG can be found in [3] and [1].
4.
HTTP TRAFFIC GRAPH
CLUSTERING
is the host communication (traffic flows) based on source or destination port number 80.
[image:3.595.317.525.73.274.2]The network traffic trace used in the experiments is MAWI trace [14]. The trace duration is 15 minutes, with the number of flow (unique source IP address and destination IP address) is 408043 flows. CoralReef tool [15] from CAIDA is used for processing the trace and Graphviz [16] for graph visualization. For TDG generation, the flows are generated (and filtered using 80 as the source and destination TCP port number) for each time interval (10 seconds). Therefore, a total of 90 TDGs are generated. The TDGs for the first three intervals, visualized using Graphviz (sfdp), are shown in Figure 1, 2, and 3. Table 1 shows the HTTP traffic graph properties.
Fig 1: HTTP traffic graph for Interval 1 (10 seconds)
Fig 2: HTTP traffic graph for Interval 2 (10 seconds)
Fig 3: HTTP traffic graph for Interval 3 (10 seconds)
Table 1. HTTP traffic graph properties (First three intervals)
Int. # of src IP
# of dst IP
# of distinct IP (# of node)
# of flows (# of edge)
Int. 1 478 539 791 1413
Int. 2 435 536 771 1405
Int. 3 436 483 726 1324
In behavior-based clustering, the flows are grouped into clusters based on its behavioral aspect (similarity). Here, the goal is to cluster the hosts which often interact using HTTP, regardless it is a web server or web client. Therefore, hosts which often communicate using HTTP can be grouped into one cluster. This way, it can be determined (to some degree), for example, most popular web server or hosts who act as web client. The steps for clustering the HTTP TDGs using MCL: 1. Find the distinct IP addresses.
2. Construct an associated matrix, between all of distinct IP addresses. If there is an interaction/connection between an IP address to the other IP address, then set their association value to 1, otherwise it is 0. The association of an IP address to itself is 1. (Step 1 and 2 of Algorithm 1).
3. Cluster the distinct IP addresses with use expansion parameter e = 2 and inflation parameter r = 2. (Step 3 to 6 of Algorithm 1).
4. Remove all self-loop (an interaction of an IP address to itself).
5. The result is a list of interaction between IP address (Step 7 of Algorithm 1).
5.
RESULTS AND DISCUSSION
[image:3.595.55.283.230.741.2]IP address 'F'. As shown in Table 2, there are five interactions between them. It means there are two distinct IP addresses from those interactions (i.e., IP address 'A' and IP address 'F') that communicate frequently. If there are two or more communications with the same source IP address and destination IP address, MCL algorithm will cluster them into one group, as shown in Table 3. The second cluster is formed from interactions between source IP address 'B', 'C', and 'D' to destination IP address 'G'. These three interactions have four distinct IP addresses. Again, MCL algorithm will cluster them into a group, because the three source IP addresses have the same interaction with one destination IP address. The third cluster is for source IP address 'E' and destination IP address 'H'. If an interaction is from a source IP address and a destination IP address that do not match with other distinct IP addresses, then the IP addresses will be grouped into one cluster.
Table 2. Example of flows (5-tuple) before clustering
Source IP
Destination
IP Protocol
Source Port
Destination Port
A F 6 50338 80
A F 6 50385 80
A F 6 50376 80
B G 6 58030 80
C G 6 1516 80
A F 6 50370 80
C G 6 1283 80
D G 6 3290 80
A F 6 50353 80
E H 6 80 2018
Table 3. Clustering results from flows shown in Table 2
Source IP Destination IP Cluster number
A F 1
B G 2
C G 2
D G 2
E H 3
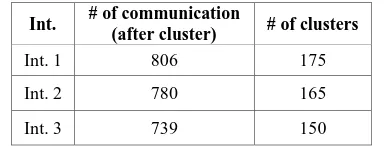
Table 4. HTTP traffic graph clustering results (First three intervals)
Int. # of communication
(after cluster) # of clusters
Int. 1 806 175
Int. 2 780 165
Int. 3 739 150
As mentioned above, the first three intervals from MAWI trace is used and filtered those hosts using 80 as the source or destination TCP port numbers. At interval 1, it has 1413 communications formed from 478 distinct source IP addresses
and 539 distinct destination IP addresses. From total of 1017 IP addresses, there are 791 distinct IP addresses. It means that interval 1 has a graph with 791 nodes and 1413 edges to cluster using the MCL algorithm. After clustering, the number of communications (edges) is decreased to 806. Therefore, there are some communications with the same source IP address and destination IP address that grouped into one cluster. There are also some communications from a source IP address to several destination IP addresses or from several source IP addresses to a destination IP address that grouped into one cluster. From the first interval, 175 clusters are formed.
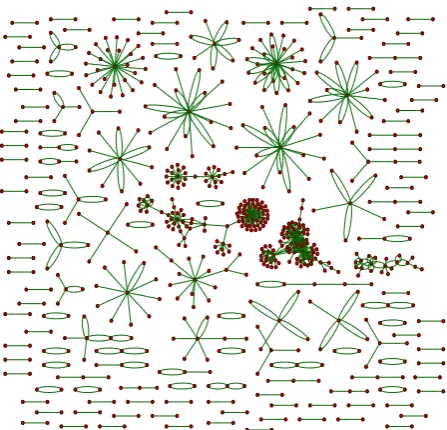
[image:4.595.317.538.248.468.2]In second and third intervals, there are 165 and 150 clusters, respectively. Table 4 shows the clustering result for each interval. The HTTP TDGs after clustering are shown in Figure 4, 5, and 6.
Fig 4: HTTP traffic graph for Interval 1 after clustering
[image:4.595.68.268.494.598.2] [image:4.595.71.265.636.709.2]Fig 6: HTTP traffic graph for Interval 3 after clustering
6.
CONCLUSION AND FUTURE WORK
This paper presented the application of MCL algorithm, which is a graph clustering algorithm, to group hosts according to similarity in their behaviors. TDG is used to represent HTTP communications between hosts. The experiment results showed that hosts which often communicate using HTTP is successfully grouped into one cluster. Using MCL algorithm, communications between one source IP address to one destination IP address, one source IP address to several (different) destination IP addresses, and several (different) source IP addresses to one destination IP address will make the distinct IP addresses from each case, grouped into one cluster.
For future work, the clusters resulted from MCL algorithm will be studied and analyzed in detail. Furthermore, an algorithm to detect anomalies in HTTP traffic graph (e.g., HTTP-based worms, or botnet interactions) using graph-based techniques will be developed.
7.
REFERENCES
[1] M. Iliofotou, “Exploring graph-based network traffic monitoring," in IEEE INFOCOM Workshops 2009, pp. 1-2, 2009.
[2] Y. Jin, E. Sharafuddin, and Z.-L. Zhang, “Unveiling core network-wide communication patterns through application traffic activity graph decomposition," in Proceedings of the Eleventh International Joint Conference on Measurement and Modeling of Computer Systems, SIGMETRICS '09, (New York, NY, USA), pp. 49-60, ACM, 2009.
[3] M. Iliofotou, P. Pappu, M. Faloutsos, M. Mitzenmacher, S. Singh, and G. Varghese, “Network monitoring using tra_c dispersion graphs (TDGs)," in Proceedings of the
7th ACM SIGCOMM Conference on Internet Measurement, IMC '07, (New York, NY, USA), pp. 315-320, ACM, 2007.
[4] D. Q. Le, T. Jeong, H. E. Roman, and J. W.-K. Hong, “Traffic dispersion graph based anomaly detection," in Proceedings of the Second Symposium on Information and Communication Technology, SoICT '11, (New York, NY, USA), pp. 36-41, ACM, 2011.
[5] K. Xu, F. Wang, and L. Gu, “Behavior analysis of internet traffic via bipartite graphs and one-mode projections," IEEE/ACM Transactions on Networking, vol. Early Access Online, pp. 1-12, 2013.
[6] M. Iliofotou, H.-c. Kim, M. Faloutsos, M. Mitzenmacher, P. Pappu, and G. Varghese, ‘Graption: A graph-based P2P traffic classification framework for the internet backbone," Comput. Netw., vol. 55, pp. 1909-1920, June 2011.
[7] D. Q. Le, T. Jeong, H. Roman, and J. Hong, “Communication patterns based detection of anomalous network traffic," in 2012 IEEE International Conference on Intelligence and Security Informatics (ISI), pp. 185-185, 2012.
[8] Z. Mingqiang, H. Hui, and W. Qian, “A graph-based clustering algorithm for anomaly intrusion detection," in 2012 7th International Conference on Computer Science Education (ICCSE), pp. 1311-1314, 2012.
[9] K. Xu and F. Wang, “Behavioral graph analysis of internet applications," in 2011 IEEE Global Telecommunications Conference (GLOBECOM 2011), pp. 1-5, Dec. 2011.
[10]Y. Jin, N. Du_eld, P. Ha_ner, S. Sen, and Z.-L. Zhang, “Can't see forest through the trees? understanding mixed traffic graphs from application class distribution," in Proceedings of 9th Workshop on Mining and Learning with Graphs MLG'11, pp. 1-8, 2011.
[11]Y. Dong and Y. Zhuang, “Fuzzy hierarchical clustering algorithm facing large databases," in Fifth World Congress on Intelligent Control and Automation, 2004. WCICA 2004, vol. 5, pp. 4282-4286, June 2004. [12]S. E. Schaeffer, “Graph clustering," Computer Science
Review, vol. 1, pp. 27-64, Aug. 2007.
[13]S. van Dongen, Graph Clustering by Flow Simulation. PhD thesis, University of Utrecht, May 2000.
[14]MAWI Working Group, “MAWI Working Group Traffic Archive." http://mawi.wide.ad.jp.
[15]CAIDA, “Coralreef software suite." http://www.caida.org/tools/measurement/coralreef/. [16]“Graphviz: Open source graph visualization software."