Optimization of Hata Model based on Measurements
Data using Least Square Method: A Case Study in
Dar-es-Salaam – Tanzania
Michael S. Mollel and Michael Kisangiri,
Ph.DDepartment of Electronics and TelecommunicationEngineering
, Nelson Mandela African Institution of
Science and Technology - Arusha, Tanzania
ABSTRACT
In this study, we present a measurement-based model for path loss prediction in three GSM service areas at 900 MHz .Modified Hata model for rural, suburban, and urban environments were derived in this study on the basis of experimental path loss measurements with the use of least square method. The models developed predicted with reasonable accuracy the path loss of radio networks investigated with a root mean square error of < 6 dB .The developed model can be useful in network planning and optimization for the environments taken as case study for the investigation, as well as any macro- and microcell environment, which is similar to the environment considered in this research.
Keywords
Path loss prediction, Hata model, Mean Root Mean Square Error, Linear Least Square Method
1.
INTRODUCTION
Radio propagation path loss model is an important tool that characterizes the quality of mobile communication, determines effective radio coverage, as well as network optimization. The path loss models also predict to a high level of accuracy the true signal strength reliability of the network and the quality of coverage [1-3]The accuracy of propagation path loss model helps to determine the optimum base station location and with appropriate propagation path loss model, the coverage area of a mobile communication system, the signal-to-noise ratio, as well as the carrier-to- interference ratio can be easily determined [4-6].
In early 21th century Tanzania witnessed a multitude of mobile phone users (Fig. 1), the more user means the cellular network must be large enough to accommodate the mobile user and hence more base station needed to solve this problem of capacity[7, 8]. To determine the optimum base station location to build the tower the accuracy of pathloss prediction model play a vital role in design to determine the coverage and to reduce the interference between the neighbors. Early eighties of the 20th century, a series investigation like the one discussed in this study have already been carried out and different propagation models as well as model performance established in those countries. Hence, this study may seem superficial to the developed world.
Nevertheless, in Tanzania where this study was carried out, the advent of modem radio mobile communication such as the Global System for Mobile communication (GSM) began its commercial operation in 2000 and yet there is any finding about suitability of theexisting models. This makes thisstudy new to our environment and will be of interest and of importance to the Tanzania community. This can be supported due to, the consumer’s satisfaction in some part of the country
is not yet there. A lot of complains such as poor quality of service, frequent call drops, echo during radio conversation, poor interconnectivity to and from other licensed networks, distortions and network congestions among other factors are disturbing issues that need to be solved. It is however, a known fact that the quality of radio coverage of any wireless network designed depends on the accuracy of the propagation model on which, the network was built. The accuracy of the model can be predicted from real-time measurement exhaustively taken from the service area, in which the network design will be deployed. Thus, the true signal strength reliability of a radio network depends on real-time measurement in the service area and the accuracy of the radio propagation model [9].
The generalization of these models, to any environment, is suitable for either particular areas (urban, suburbs and rural), or specific cell radius (macrocell, microcell, picocell) depending on the diversity of environment where mobile communications occur. In general, there is a relationship between these models and types of environments for which they are suitable.
Mobile cellular subscriptions in Tanzania[10]
2.
MATERIALS AND METHODS
The experimental data were taken in several areas in Dar es Salaam around Kigamboni, Mbagala and Posta city. The presence of leaves were noted in rural and urban due to existence of trees in these areas and for suburban few trees were noted and hence there not much of leaves, all of this factor account for signal attenuation and variation. The base antenna heights were in the range from 30 to 46 m with reference to ground level.
Through a drive test campaign the received power level were recorded, as the van moved through the environment, TEMS software which were installed in computer recorded averaging power, presence of fast fading due to multipath was averaged yielding estimates of local mean power of the signal at a distance.
Drive Testing is a method of measuring and assessing the coverage, capacity and Quality of Service (QoS) of a mobile radio network [11]. The data collected by drive test tool in form of Log files are assessed to evaluate the various RF parameters of the network. The technique consists of using a motor vehicle containing mobile radio network air interface measurement equipment that can detect and record a wide variety of the physical and virtual parameters of mobile cellular service in a given geographical area by measuring what a wireless network subscriber would experience in any specific area especially for this case a received power level. Drive test equipment typically collects data relating to the network itself, services running on the network such as voice or data services, radio frequency scanner information and GPS information to provide location logging[12]
3.
MODEL ADJUSTMENTS
The model makes use of four input parameters: the carrier frequency f in MHz, the BTS antenna height (hb
)
in m, theMS antenna height (hm
)
in m and the distance of separationbetween the BTS and the MS (d) in km. The basic form of allowable path loss by the Okumura Hata [13, 14] model for an urban area is given in Equation 1, for a valid frequency range from 150 to 1500MHz:
loss b m
b
P =69.55+26.16log(f)-13.82log(h )-a(h )
+(44.9-6.55log(h ))log(d) (1) where a(h )m is mobile station (MS) antenna height correction factor that depends on the type of environment.
For medium cities to small cities Hata [13, 14] is re-written as in Equation 1.
69 55 26 16 13 82 44 9 6 55
loss b
m b
P (urban) . . log f . log h
a( h ) . . log h log d
(2)
1 1 0 7 1 56 0 8
m m
a( h ) ( . log( f ) - . )h - ( . log( f ) - . ) (3) For Rural environment Hata [13, 14] is written as in equation 4
2
4 78 10 18 33 10 40 94
loss loss
P (rural) P ( urban ) . ( log ( f )) . log ( f ) .
(4)
For Suburban environment Hata [13, 14] is written as in equation 5
2
2 10 28 5 4
loss loss
P (suburban)P ( urban ) ( log ( f / )) . (5) Generally the Hata model can be written as equation 6
1 2 3
1 2
loss x x b m
x b x
P ( dB ) A A f (f) A f ( h ) a( h ) ( B B f (h ))log(d) k ( f )
(6)
where A1A3 , B1B2 are model adjustable parameters
for the Hata model, d is the link distance, f is the frequency in MHz, hb is the effective height of the transmitting antenna in
meters,hm is the effective height of the receiving antenna
in meters .
the proper adjustment of these parameters and the results are presented in Table (1).
For a given route f
,
hb and hm are the constant values,equation 6 can be modified and written as
loss h f h
P ( dB ) (a a ) (b bf)log(d) (7) where af and bf are values added in classical Hata model and are considered as the optimizer parameter to modified Hata model.Given a pathloss model equation is in a form
loss h f h
p ( dB ) A Blog( d ) (a a ) (b bf)log(d)gives the minimum error compared to the measured data.
where Aahaf
,
and BbhbfBy using least square algorithm start in equation 10 the value of A and B will be found
Let: 2 2 1 n mi i i
R(A,B) [ P P( d )]
(8)i i
P( d ) A Blog( d ) (9)
Where Pmi
is the measured path loss at position i in dB, n is the number of the measurement sample set. To fulfil the least square [15] condition that optimizes A and B, all the partial derivatives of the 2
R(A,B) function must equal to zero (Equation 8) that yields to other equation which are given as follows: 2 2 0 0 R(A,B) A R(A,B) B (10)
The value of A and B solved with use of simple simultaneous equation given as follow:
1 1 2 1 1 1 n n mi i i i n n n i i mi i i i i P
n log( d )
A B log( d ) [log( d )]
P log(d )
(11)From the matrix equation in equation 11 the solution for A and B are
1 1
n n
mi i
i P B i log( d )
A
n
(12)2 2
mi i mi i
i i
n P log(d ) P log(d )
B
n (log(d )) (log(d ))
(13)Knowing the value of A and B, the optimization value can be calculated as follow
f h
a A a (14)
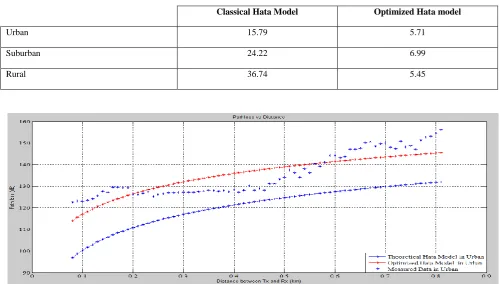
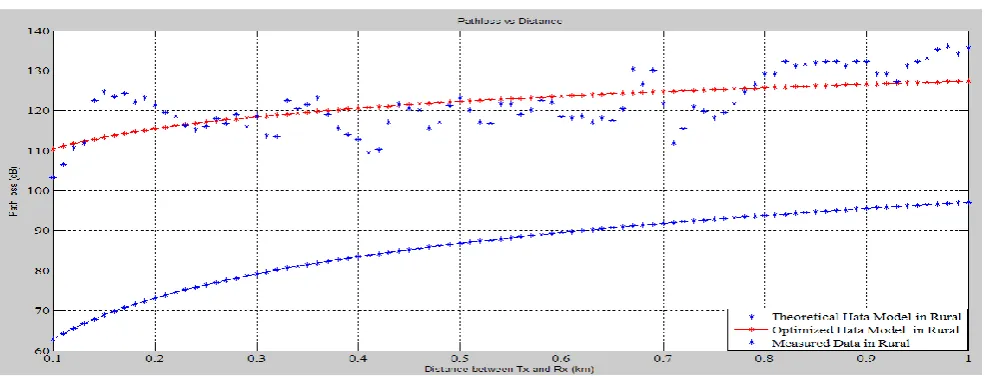
to the field measurements for these areas. The performance of the optimized Hata model is compared with the measured data, and that of the classical Hata model is compared with the measured data hence the values of root mean square error (RMSE) was obtained respectively from each test . The result is shown in Table (2) for RMSE for the classical Hata model and Optimized Hata model.
[image:3.595.44.555.169.394.2]The results in Table (2), show the RMSE of the adjusted model and classical Hata model. The optimized Hata models showed better agreement with the measured values, since its RMSE is withinthe acceptable value up to 6dB[16] . Figure (4)-(6) shows the comparison between the optimized Hata model and classical Hata model in the prediction of pathloss for three environments.
Table 1: Parameter of Hata model before and after adjusted
Parameter
Before adjustment After adjustment
Urban Suburban Rural Urban Suburban Rural
f
a
- - -
13.208 28.7738 30.253
f
b
- - -
-3.538 15.7292 17.234
1
A
69.55 69.55 69.55 82.758 98.3238 99.803
1
B
44.9 44.9 44.9 41.363 60.6292 27.666
2
A
26.16
3
A
-13.82
2
[image:3.595.48.550.423.707.2]B
-6.55
Table 2: Statistical RMSE of Optimized Hata and classical Hata model
Classical Hata Model Optimized Hata model
Urban 15.79 5.71
Suburban 24.22 6.99
Rural 36.74 5.45
Figure 2: Path loss comparison of Hata model before and after model adjustment for suburban area
Figure 3: Path loss comparison of Hata model before and after model adjustment for rural area
Optimized Hata model which will be suitable for pathloss prediction in Dar es Salaam and all areas which resemble to Dar es Salaam are developed in this paper, and the model equation is shown in the equation below.
For Dar es Salaam urban city the optimized Hata model is written:
loss b m
b
P (dB)=82.75+26.16log(f)-13.82log(h )-a(h )
+(41.9-6.55log(h ))log(d) (16)
a( h ) ( . log( f ) - . )h - ( .m 1 1 0 7 m 1 56log( f ) - . )0 8
For Dar es Salaam suburban environment the optimized Hata model is written:
2
98 32 26 16 60 62 6 55
13 82 2 5 4
28
loss b
b m
P . . log(f) ( . . log(h )log(d)
f - . log(h ) - a( h ) (log( )) .
(17)
For Dar es Salaam rural areas the optimized Hata model is written:
99 803 26 16 27 6658 6 55
loss b
P . . log(f) ( . . log(h ))log(d)
where a(h )m is mobile station(MS) antenna height correction
factor which is the same applicable for equation 16 ,17 and 18, f is the frequency in MHz,hm is the mobile antenna height ,d is
the distance between base station and mobile station ,and hb is
the base station height.
4.
CONCLUSION
From the measured data in Dar es Salaam Hata model was adjusted and the optimized Hata model shows the high
accuracy of pathloss prediction comparing to the classical Hata model.
The modified Hata model developed in this paper will be recommended as the accuracy path loss prediction formula specifically to Dar es Salaam and it’s environ also environment which related to Dar es Salaam-Tanzania and also we have shown that there is a need for network operator to prioritise the tuning of propagation model parameters at the deployment stage.
[image:4.595.56.549.291.479.2]telecommunication company, Anna Kisangiri, Gasper Clement, and much thank to Rogers Bajungu, for their technical support.
6.
REFERENCES
[1] Anderson, R., Coverage Prediction for Digital Mobile Systems part 1. MRT Engineering, Prism Business Media Inc, 2006.
[2] Emagbetere, J. and F. Edeko, Measurement validation of Hata-like Models for Radio propagation Path loss in Rural Environment at 1.8 GHz. Journal of Mobile Communication, 2009. 3(2): p. 17-21.
[3] Neskovic, A., N. Neskovic, and D. Paunovic. Improvements of ITU-R field strength prediction method for land mobile services. in Electrotechnical Conference, 2002. MELECON 2002. 11th Mediterranean. 2002. IEEE.
[4] Chebil, J., et al. Comparison of empirical propagation path loss models for mobile communications in the suburban area of Kuala Lumpur. in Mechatronics (ICOM), 2011 4th International Conference On. 2011. IEEE.
[5] Shoewu, O. and F. Edeko, Analysis of radio wave propagation in Lagos environs. American Journal of Scientific and Industrial Research, 2011. 2(3): p. 438-455.
[6] Michael Samwel Mollel, A.T.K., Dr. Michael Kisangiri, The effect of real ground on dual band Yagi-Uda antenna. International Journal of Engineering Research & Technology (IJERT), 2013. 2(10): p. 2482-2485.
[7] Busayo. Vodacom To Invest $124m For Tanzania Network Expansion - Ventures Africa. 2013 [cited 2013 25-oct]; Available from:
http://www.ventures- africa.com/2013/08/vodacom-to-invest-124m-for-tanzania-network-expansion/.
[8] Wakoba, S. Tigo Tanzania To Launch 209 New Network Sites In Three Months 2013 [cited 2013 25-oct]; Available from: http://techmoran.com/tigo-tanzania-to-launch-209-new-network-sites-in-three-months/.
[9] Kanagalu, R., Coverage Estimation for Mobile Cellular Networks from Signal Strength measure-ments. 1999, Ph. D Thesis, University of Texas at Dallas.
[10]Economics, T. Mobile cellular subscriptions in Tanzania. 2014 [cited 2014 July-23]; Available from: http://www.tradingeconomics.com/tanzania/mobile-cellular-subscriptions-wb-data.html.
[11]Amaldi, E., A. Capone, and F. Malucelli, Radio planning and coverage optimization of 3G cellular networks. Wireless Networks, 2008. 14(4): p. 435-447.
[12]Budhiraja, R. and J.S. Jadon, Study And Implementation Of Drive Test For Development Of GSM Network.
[13]Seybold, J.S., Introduction to RF propagation. 2005: John Wiley & Sons.
[14]Deme, A., et al., Hata-Okumura Model Computer Analysis for Path Loss Determination at 900MHz for Maiduguri, Nigeria. Mathematical Theory and Modeling, 2013. 3(3): p. 1-9.
[15]Weisstein, E.W., Least Squares Fitting–Logarithmic. From MathWorld–A Wolfram Web, 2010.