Software Quality Analysis by Object Oriented
Approach and Comparative Analysis with
MEMOOD TOOL using UML
Anand Handa
M.Tech Scholar Computer Science &Engineering RKDFIST Bhopal
Jasvinder Pal Singh
Assistant Professor Computer Science &Engineering RKDFIST Bhopal
Gaurav Srivastava
Assistant Professor Computer Science &Engineering RKDFIST Bhopal
ABSTRACT
Software Quality is the degree to which a finished product conforms to its specifications. The earlier a fault is detected and is removed the easier it is to fix. Object oriented metrics focus on the combination of functions and data as an integrated object. Object oriented paradigm substantially improves productivity due to the effect of reuse. Requirement specifications, designs and test plans are all artifacts that could potentially be fully or partially be reused in different projects.
General Terms
Software Quality, UML Class Diagrams, Software Maintainability, Understandability, Modifiability.
Keywords
Solution domain, metrics, tools. Object Oriented Design, Metrics and tools.
1.
INTRODUCTION
Quality is defined as the level to which a product conforms to its requirements. This implies that the requirements must be clearly and unambiguously stated in such a way that they cannot be misunderstood. Thus insuring the delivery of high-quality software is becoming an increasingly important goal in the life-cycle of software developed by serious companies.
The ever-changing world makes maintainability a strong quality requirement for the majority of software systems. The maintainability measurement during the development phases of object-oriented system estimates the maintenance effort, and also evaluates the likelihood that the software product will be easy to maintain. The class diagrams plays an important role in the design phase of object oriented software therefore an early estimation of their maintainability may help developers and designers to incorporate required enhancements and corrections in order to improve their maintainability and consequently the maintainability of the final software to be delivered. Hence there is a need of developing a maintainability estimation model, which quantifies the maintainability of object oriented software at design stage. This paper does an extensive review on maintainability of object oriented software and puts forth some relevant information about class diagram maintainability. Two quality attributes of class diagram,
their maintainability. The model developed in this paper estimates the maintainability of class diagram in terms of their understandability and modifiability. While understandability and modifiability of class diagrams are quantified in terms of object oriented design metrics calculated from respective class diagram.
2.
SOFTWARE
QUALITY
METRICS
The first step to making use of metrics should involve assessing a number of available metrics and choosing a package for use according to a company’s quality objectives [1].
There are essentially three measurable entities: products, processes, and people [2]. At the end of the day, if used properly, metrics allow us to quantitatively define success and failure, and/or the degree of success or failure for a product, process or person. It allows us to identify and quantify improvement, lack of improvement or degradation in the performance of a product, process or person. It helps us to make meaningful and useful managerial and technical decisions. It provides user in making quantified and meaningful estimates. It helps in making meaningful comparisons can only be made if both the similarities and dissimilarities of the products, processes or people being compared are taken into account.
3.
METRICS
AND
OBJECT
ORIENTED
PARADIGM
While metrics for the traditional functional decomposition and data analysis design approach measure the design structure and/or data structure independently, object-oriented metrics must be able to focus on the combination of function and data as an integrated object. The quality of the software is dependent on its design [3]. A various number of Object Oriented design quality metrics are defined of which CK metrics (Chidamber and Kemerer) [4] are the popular one. The Metrics are used to calculate the efficiency parameter and various tools are used for that which are discussed in this paper and are as follows:
3.1
Weighted Methods per Class (WMC)
…… (1)
WMC analyzes the class structure and the result has a bearing on the understandability, maintainability, and reusability of the system as a whole. The number of methods and the complexity involved is a predictor of how much time and effort is required to develop and maintain the class. The WMC can be calculated by using Equation (1) for any number of methods. Chidamber and Kemerer clarified the definition of method count as “the methods that require additional design effort and are defined in the class should be counted, and those that do not, should not”.
3.2
Depth of Inheritance Tree (DIT)
The depth of inheritance of a class is its depth in the inheritance tree. If multiple inheritances is involved, then the depth of the class is the length of the maximum path from the node representing the class to the root of the tree [5]. The root class has a DIT of 0.DIT is essentially a measure of how many ancestor classes can possibly affect this class. It is worth noting that deeper trees constitute greater design complexity, since more methods and classes are involved. However, deeper trees also signify a greater level of internal reuse in the system so a balance between reuse and reduced complexity needs to be struck. This metric primarily evaluates efficiency and reuse but also relates to understandability and testability.
3.3
Number of Children (NOC)
NOC simply counts the number of immediate sub-classes subordinate to a particular class in the class hierarchy. This gives an indication of the potential influence a class can have on the design and on the system. The greater the number of children, the greater the likelihood of improper parent abstraction, and it may be an indication of sub-classing misuse. Again, there has to be a compromise because a greater number of children indicate a larger degree of internal reuse of the particular class
3.4
Coupling between Object Classes
(CBO)
CBO for a class is a count of the number of non-inheritance related couples with other classes. Excessive coupling between objects outside of the inheritance hierarchy is detrimental to modular design and prevents reuse since the more independent an object is, the easier it is to reuse in a different application. It provides a scale to measure the interdependency between the classes [6]. The foremost objective is to reduce the cross coupling in order to increase the quality of the final solution.
3.5
Response for a Class (RFC)
The RFC is the "Number of Distinct Methods and Constructors invoked by a Class." The response set of a class is the set of all methods and constructors that can be invoked as a result of a message sent to an object of the class. This set includes the methods in the class, inheritance hierarchy, and methods that can be invoked on other objects. The net amount of effort in testing and maintenance depends on the response count.
|RS|= {M} U all i {Ri}
Where {Ri} = set of methods called by method i and {M} =set of all methods in the class [7].
4.
EXTRACTING
STRUCTURAL
METRIC
INFORMATION
FROM
UML
DIAGRAMS
It has been established that all the information required can be obtained from a combination of class diagrams, activity diagrams, collaboration diagrams and sequence diagrams. The calculative analysis of the various approaches can be now done with the help of the UML approaches. Calculating WMC will require the information from two types UML diagrams and various methods that have been used earlier in which object oriented approach was not used. The following methodologies help in identifying the enhancement of the OO feature.
4.1
Class Diagram
The class diagram will be used for obtaining a list of methods for each class. By default, the Cyclomatic Complexity of each method will be one. However, if there are methods for which there exists an Activity Diagram describing changes in activity within the methods, the Cyclomatic Complexity for those methods should be calculated from their Activity Diagrams.
The inherited methods are not counted unless they are re-defined in the current class.
4.2
Activity Diagram
Activity diagrams can be used to show the changes in activity within the methods. They are very similar to flowcharts. If a method has an activity diagram associated with it, its cyclomatic complexity is calculated as follows:
Cyclomatic Complexity = no. of edges – no. of nodes + 2
If a method does not have an activity diagram associated with it, then its cyclomatic complexity is taken to be 1. This follows from the notion that in theory, object-oriented methods are so small and specific that their complexity can be taken to be 1.
4.3
Depth of Inheritance Tree (DIT)
The depth of inheritance of a class is its depth in the inheritance tree. If multiple inheritance is involved, then the depth of the class is the length of the maximum path from the node representing the class to the root of the tree. The root class has a DIT of 0.
(DIT = 0)
Animal
Domestic Farm Wild Animal Animal Animal
(DIT =1)
Cat Dog Cow Pig Lion Pig
[image:3.595.72.266.466.630.2](DIT = 2)
Fig 1: Illustrating how DIT readings can be made from UML Class Diagrams
4.4
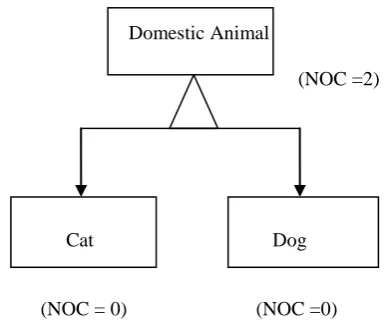
Number of Children (NOC)
NOC simply counts the number of immediate sub-classes subordinate to a particular class in the class hierarchy. This information is easily obtainable from a class diagram as follows.
Domestic Animal
(NOC =2)
Cat Dog
(NOC = 0) (NOC =0)
Fig.2: Illustrating how NOC values can be obtained from UML Class Diagrams
4.5
Coupling between Objects (CBO)
CBO for a class is a count of the number of non-inheritance related couples with other classes. UML class diagrams will be needed to obtain information for calculating CBO. Class diagrams can show the different couplings between objects.4.6
Lack of Cohesion in Methods
(LCOM)
Cohesion refers the degree of interconnectivity between attributes of a class. A class is cohesive if it cannot be further divided in to subclasses. It measures the method behavior and its relevance where it is defined. Pair of methods using data object proves the cohesiveness where as the methods not participating in data access makes it less cohesive. Consider C is a class and M1, M2...,Mn are its methods using set of class instances[9].
I1={a,b,c,d}, I2={a,b,c} and I3={x,y,z} are set of instances used by the methods M1,M2 and M3 respectively. If intersection of object set is non-empty then the method using them is cohesive and their relevance in the class is proved. i.e. I1 ∩ I2 = {a, b, c} means M1 and M2 are cohesive. But intersection of I1, I3 and I2, I3 is empty set. High count in LCOM shows less cohesiveness and class need to be divided to subclasses. Apart from CK and MOOD, other metrics [8] based on Object Oriented principles are also assess the design quality.
5.
C
OMPARATIVES
TUDYIt is known from the study that very few commercial and open source tools are available for quality evaluation of object oriented software design [10]. Each tool is performing well with defined metrics individually but failed to cover all proposed in the literature. Output format of the report generated by few tools are not having friendly features which will have an impact on assessing the result. The proposed methodology shows the gradual increase in the efficiency when design phase has been effectively measured and implemented. The use of UML increases the efficiency of the object oriented model [11] to a greater extent.
Quantification of class diagram’s understandability and modifiability is prerequisite for the maintainability estimation model. Therefore before developing MEMOOD, two models for understandability and modifiability have been developed [12].
Fig3: Maintainability Estimation Model (MEMOOD)
The above figure, describes the quantification process of the maintainability model (MEMOOD). Understandability and
NC
MaxD
IT
NAgg
H
NGen
H
NGen
[image:3.595.310.533.511.698.2]two (‘NC’, ‘NGenH’) and five (‘NC’, ‘NGen’, ‘NGenH’, ‘NAggH’, ‘MaxDIT’) class diagram metrics respectively. The maintainability is estimated in terms of understandability and modifiability.
5.1
Modifiability Model
In order to establish a multivariate model for modifiability of class diagram, metrics listed in Table 1, will play the role of independent variables while modifiability will be taken as dependent variable. To identify metrics those are effectively contributing in the prediction of modifiability, the technique of backward stepwise multiple regression has been used. This procedure starts with a model, which initially includes all the independent variables and gradually eliminates those, one after another, that does not explain much of the variation in the dependent variable, until it ends with an optimal set of independent variables. Now applying backward stepwise regression, on the available data has resulted into the following modifiability model.
Modifiability = 0.629 0.471*NC–0.173*NGen– 0.616*NAggH–0.696*NGenH 0.396*MaxDIT
… (2)
Where, NC is the ‘Number of Classes’, NGen is ‘Number of Generalizations’, NAggH is ‘Number of Aggregation Hierarchies’, NGenH is ‘Number of Generalization Hierarchies’ and MaxDIT is Maximum DIT. From the model it can be interpreted that modifiability of class diagram is directlyproportional to ‘Number of Classes’ and ‘Maximum DIT’, while ‘NGen’ and ‘Number of Generalization and Aggregation Hierarchies’ are inversely proportional to modifiability of class diagram.
5.2
Understandability Model
After establishing a model for modifiability the next task is to build a similar model for understandability also. Applying the same technique of stepwise backward multiple regressions on the available data resulted into the following understandability model ([12]).
Understandability = 1.166 + 0.256*NC– 0.394*NGenH …. (3)
Where, NC is the ‘Number of Classes’ and NGenH is ‘Number of Generalization Hierarchies’. From (3) it could be interpreted that understandability of class diagram is directly proportional to ‘NC’, while ‘NGenH’ is inversely proportional to the understandability of class diagram.
5.3
Maintainability Model (MEMOOD)
Before establishing the model for maintainability, it is important to ensure the proper correlation among maintainability, understandability and modifiability of class diagrams. The correlation between understandability and modifiability is not so strong. This supports their candidature to be act as independent variables in the maintainability model. Now the next job is to quantify the influence of understandability and modifiability on maintainability. For this, the technique of multiple regressions has been applied taking maintainability as dependent, while understandability and modifiability as independent variables ([13]).Maintainability = -0.126 + 0.645*Understandability + 0.502*Modifiability ...(4) From the model (4) it could be interpreted that maintainability of the class diagram is directly proportional to the corresponding understandability and modifiability.
5.4
Proposed Model
The data and parameters so collected from various xml files and UML diagrams have been used to design a new model that produces better results as compared to the existing model results. The modifiability so calculated by the given parameters has been changed as the MaxDIT depends on the number of methods and the total number of the inheritances.
Modifiability = 0.629 0.471*NC–0.173*No. of relations– 0.616*NAggH – 0.696*NGenH + .396*No. of total methods.
… (5)
Understandability = 1.166 +0.256*No. of total Methods–
0.394*NGenH …. (6)
Maintainability = -0.126 + 0.645*Understandability + 0.502*Modifiability ...(7)
6.
C
ORRELATION OF THEU
NDERSTANDABILITYR
ESULTS [image:4.595.313.527.475.659.2]The data being collected is analyzed and then is being statistically analyzed to find the correlation coefficient. The values obtained from the MEMOOD Tool and from the proposed method are being compared and the correlation coefficient is being calculated that comes out to be 1 that shows that the significance factor is optimally the best one in its class.
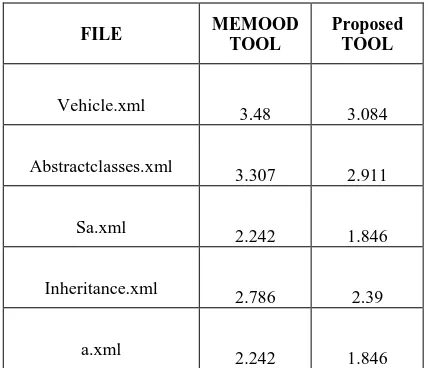
Table 1: Comparative Analysis for modifiability model
FILE MEMOOD TOOL
Proposed TOOL
Vehicle.xml
3.48 3.084
Abstractclasses.xml
3.307 2.911
Sa.xml
2.242 1.846
Inheritance.xml
2.786 2.39
a.xml
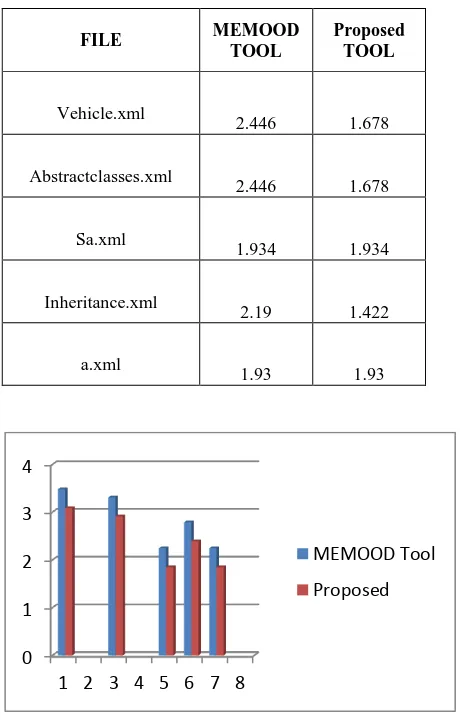
Fig. 4 Comparisions of Modiafibility Factor of MEMOOD TOOL and Proposed Model.
[image:5.595.320.536.206.634.2]The table 1 and graphical analysis shows that the data being gathered from varoius files produces better results for the modifiablity factor that was existing earlier. Every time the data that was being generated from the files is being executed through the existing channels and through the proposed model, we received better results that were shown graphically.
Table 2: Comparative Analysis for understandability model
FILE MEMOOD TOOL
Proposed TOOL
Vehicle.xml
2.446 1.678
Abstractclasses.xml
2.446 1.678
Sa.xml
1.934 1.934
Inheritance.xml
2.19 1.422
a.xml
1.93 1.93
Fig. 5 Comparisions of Understandabilty Factor of MEMOOD TOOL and Proposed Model.
The table 2 and graphical analysis shows that the data being gathered from varoius files produces better results for the understandability that was existing earlier. Every time the data that was being generated from the files is being executed through the existing channels and through the proposed model, we received better results that were shown graphically. The results shows a better degree of understanability of the achieved results and scaleness.
Table 3: Comparative Analysis for maintainability model
FILE
MEMOOD TOOL
Proposed TOOL
Vehicle.xml
3.19863 2.504478
Abstractclasses.xml
3.111784 2.417632
Sa.xml
2.246914 2.048122
Inheritance.xml
2.685122 1.99097
a.xml
3.1117 3.1117
Fig. 6 Comparisions of Maintainability Factor of MEMOOD TOOL and Proposed Model.
The table 3 and graphical analysis shows that the data being gathered from varoius files produces better results for the maintainabilty that was existing earlier. Every time the data that was being generated from the files is being executed through the existing channels and through the proposed model, we received better results that were shown graphically. 0
1 2 3 4
1 2 3 4 5 6 7
MEMOOD Tool
Proposed
0 1 2 3 4
1 2 3 4 5 6 7 8
MEMOOD Tool
Proposed
0 0.5 1 1.5 2 2.5 3 3.5
1 2 3 4 5 6
MEMOOD Tool
[image:5.595.52.282.367.727.2]achieved results and scaleness. The results so obtained from the MEMOOD Tool are being compared with the proposed methodology to show optimum and better results for the class.
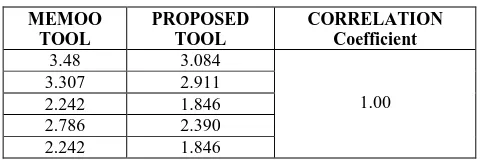
Table 4: Comparative Analysis MEMOO
TOOL
PROPOSED TOOL
CORRELATION Coefficient
3.48 3.084
1.00
3.307 2.911
2.242 1.846
2.786 2.390
2.242 1.846
The data being collected is analyzed and then is being statistically analyzed to find the correlation coefficient. The values obtained from the MEMOOD Tool and from the proposed method are being compared and the correlation coefficient is being calculated that comes out to be 1 that shows that the significance factor is optimally the best one in its class. The table 4 shows that the correlation coefficient between them is 1.00. The values are considered to be optimum if the Pearson’s coefficient for the data lies between 0.9 to 1.00 which means that the efficiency must be 99% or the results are accurate.
7.
CONCLUSION
AND
FUTURE
ENHANCEMENT
In this paper major efforts are done to find out the relationships between the various fields of object oriented metrics for various models. The object oriented metrics which are applied at the design phase helps in improving the quality of the software as we can analysis various parameters during the development phase only. The factors such as understandability, modifiablity and maintainablity have been used in order to compare the results of various tested models. The data analysis shows that the results collected from the proposed model may helps in improving the quality of the software at the design phase only as they are known to the user prior to the end of the project. In this study, efforts are done to collect data from various other models and then relationships were found on the basis of the fields and parameters decided. The proposed methodology helps in providing better results as compared to the earlier metrics which were used to collect data from the XML files. The proposed models can be used to develop more enhanced and predictive models that may produce more quality enhancements and efficient results for the software models to be developed in future. The objective of this paper is to design a common platform for all the quality metrics which are used for software analysis such as maintainability, understandability and maintainability.
8.
ACKNOWLEDGMENTS
I would like to thank Mr. Jasvinder Singh Pal for his assistance and guidance on software quality analysis and metric calculations and Mr. Gaurav Srivastava for the selection of fields for comparisons being done.
9.
REFERENCES
[1] Sandeep Purao and Vijay Vaishnavi “Software Metrics for Object-Oriented systems”, ACM Computing Surveys,Vol 35, No2, JUNE 2003, pp 191-221.
[2] Seyyed Mohsen Jamali, ”Object Oriented Metrics –A Survey Approach”, January 2006.
[3] Dr. Rakesh Kumar and Gurvinder Kaur, “ComparingComplexity in Accordance with Object Oriented Metrics”,International Journal of Computer Applications(0975 – 8887) Volume 15– No.8, February 2011.
[4] Shyam R. Chidamber and Chris F. Kemerer “A Metrics Suite for Object Oriented Design”, IEEE TRANSACTION ON SOFTWARE ENGINEERING, VOL 20,No 6, JUNE 1994.
[5] Robert Martin, “OO Design Quality metrics”, October 28, 1994.
[6] Rüdiger Lincke, Jonas Lundberg and Welf Löwe, “Comparing Software Metric Tools”, 2008 ACM 978-1- 59593-904-3/08/07.
[7] P. Edith Linda, V. Manju Bashini, S. Gomathi, “Metrics for Component Based Measurement Tools”, International Journal of Scientific & Engineering Research Volume 2, Issue 5, May-2011.
[8] Stojanovic M and El Eman K, “ES2: A Tool for Collecting Object-Oriented Design Metrics from C++ and Java Source code”, National Research Council of Canada, June 2001.
[9] Dr. M.P Thapaliyal and Garima Verma, “Software Defects and Object Oriented Metrics–An Empirical Analysis” International Journal of Computer Applications (0975 – 8887) Volume 9– No.5, November 2010.
[10] Linda Westfall, The Westfall Team, “12 Steps to Useful Software Metrics”, The Westfall Team, 2005
[11] Dr. Linda H. Rosenberg, “Applying and Interpreting Object Oriented Metrics”, Track 7 - Measures/Metrics.
[12] S.W.A. Rizvi and R.A. Khan,” Maintainability Estimation Model for Object Oriented Software in design Phase (MEMOOD)” Journal of Computing, Volume 2, Issue 4, 2010, ISSN 2151-9617